E139 Lecture 7 (Muscle Mechanics I)
1/50
There's no tags or description
Looks like no tags are added yet.
Name | Mastery | Learn | Test | Matching | Spaced | Call with Kai |
|---|
No study sessions yet.
51 Terms
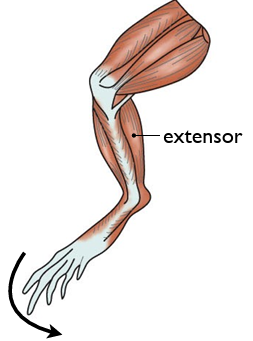
extensors
gastroc
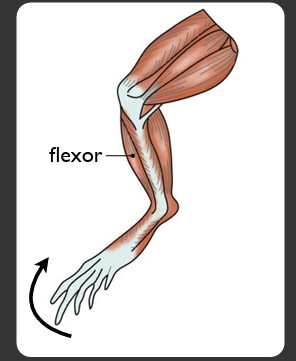
flexors
peroneals
muscle: levels of organization
muscle (cm) → muscle fascicle (mm) → muscle fiber (100 um)
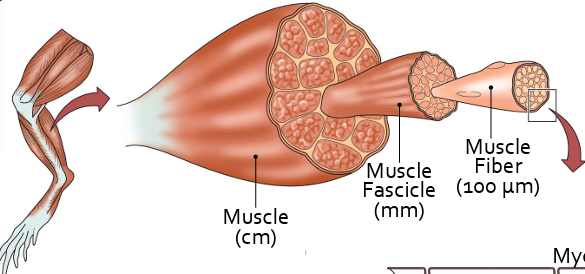
muscle fascicle
a bundle of skeletal muscle fibers (cells) wrapped in a connective tissue sheath
myofibrils
long contractile fibers in the muscle
t-tubules
deep invaginations of the sarcolemma that allow for rapid transmission of action potentials into the cell interior
SR
a specialized type of smooth endoplasmic reticulum found in smooth and striated muscle fibers that acts as the primary storage site for calcium ions
relationship between non-contractile material vs force capacity
inverse
sarcomere
a structural unit of a myofibril in striated muscle
1.5 - 4 um
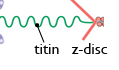
z disc
end of sarcomere; delineate the lateral borders of sarcomeres and are the smallest functional units in striated muscle
contractions move the z discs together
consists of actin
sarcomere components
z disc, actin, myosin, nebulin, titin
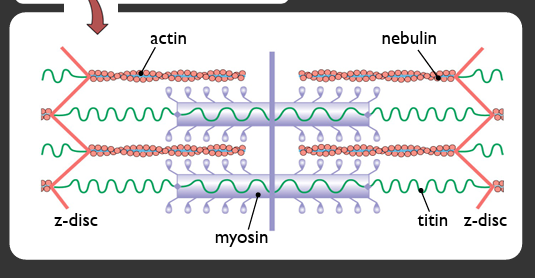
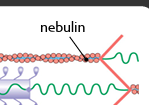
nebulin
underlies actin filament (scaffold around actin); mutation will shorten or lengthen actin filament; maintains spacing between actin and myosin
titin
runs from one z disc to the next; controls distance of lattice; can change stiffness with Ca2+
steps of muscle contraction
motor command → neuromuscular junction → muscle AP → Ca2+ signal → contraction cycle (ATP → ADP) → force and motion
excitation contraction coupling: NMJ → contraction cycle
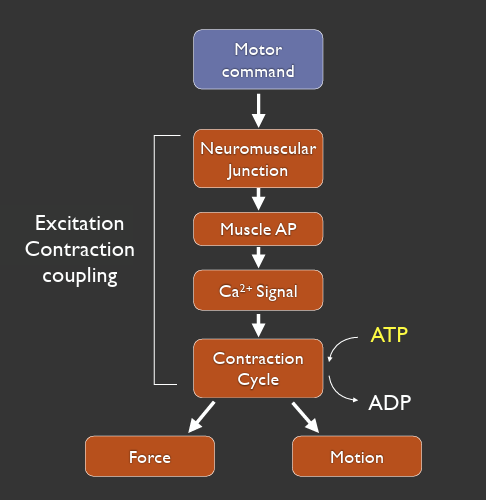
mechanical work
involves force and motion
calcium in contraction
critical regulatory signal in muscle contraction
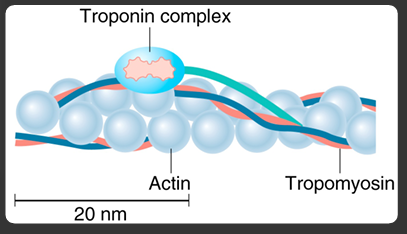
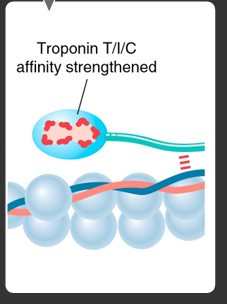
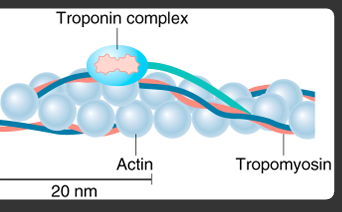
troponin
covers actin binding sites for the myosin heads; presence of Ca2+ uncovers
Keeps tropomyosin covering actin; binding to calcium moves it
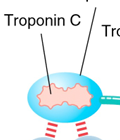
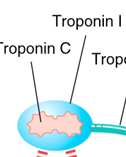
troponin C
binds calcium to initiate contraction
troponin I
inhibits actomyosin interaction at rest
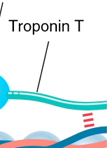
troponin t
anchors the complex to tropomyosin
what hapens when troponin binds to calcium
troponin t, i, and c affinity strengthened
tropomyosin
moves once troponin binds to Ca2+; exposes actin for myosin binding
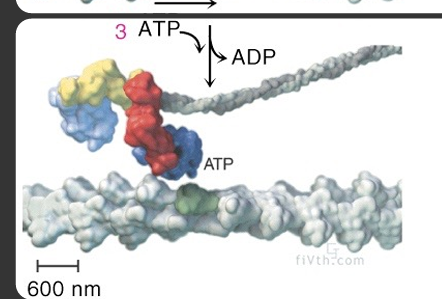
what is required for cross bridge detachment
atp, which is needed for x-bridge cycling
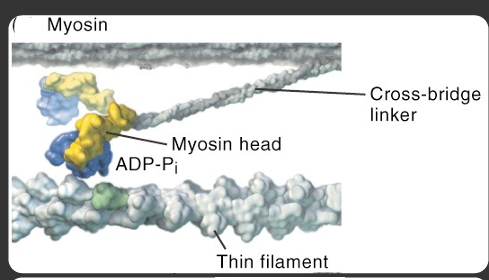
what does the myosin head look like before ca2+ binding
myosin head is in the high energy state because it is bound to ADP and Pi group
what is the energy level when the myosin head detaches
low energy
how is low energy level achieved
achieved by binding and ratcheting
power stroke occurs, not a muscle contraction
muscle contraction occurs from multiple power strokes
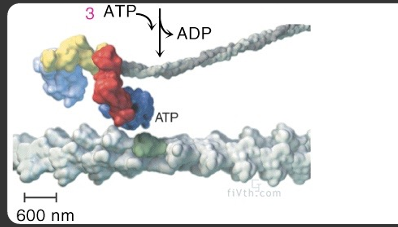
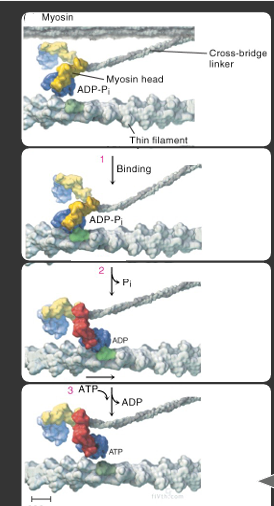
steps of myosin head binding and disengaging
calcium binds → myosin head (attached to ADP-Pi) binds to the actin filament
releases Pi group → myosin head goes into low energy state
3 ATP go in → 3 ADP out = release myosin head from actin filament
during which steps is ATP necessary
Ca2+ signal = ATP is needed to sequester Ca2+ back in the SR
contraction cycle = needed for cross bridge detachment which is needed for crossbridge cycling
what is the contribution of each crossbrudge to overall force in a muscle
stress = (Fx nx)/A
Fx = force per crossbridge
nx = # of attached crossbridges
A = cross sectional area
force per cross bridge (Fx)
about 2 - 3 pN (2E-12 to 3E-12 N)
pN to N conversion
1 pN = 1E-12 N
how many mysoin heads per thick filament
200 myosin heads/thick filament
myofibril diameter
1 um
um to m conversion
1 um = 1E-6 m
myofibril area (A)
0.78 um²
nm² to um² conversion
1 nm² = 1E-6 um²
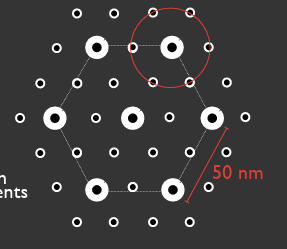
calculating thick filament area
pi (distance between adjacent myosin filaments/2)²
calculating number of thick filaments
myofibril area/ thick filament area
A = 0.78 um²
thick filament area = pi (distance between adjacent thick filaments/2)²
arrangement of thick and thin filaments
hexagonal shapre
calculating nx
(# thick filaments)(200 myosin heads/thick filaments)
um² to cm² conversion
1 um² = 1E-8 cm²
Bz value
0.2 um
actin length (a) value
1 um
sarcomere length
subject to change
myosin length (m) value
1.6 um
relationship between sarcomere force and overlap (um)
proportional
calculating Hmax
Hmax = (m-Bz)
relating force and overlap
Fs/Fmax = H/Hmax
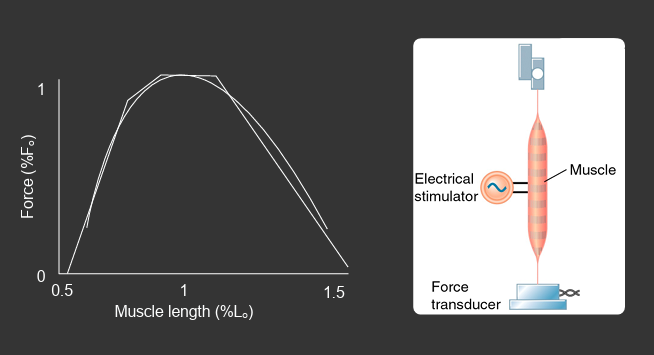
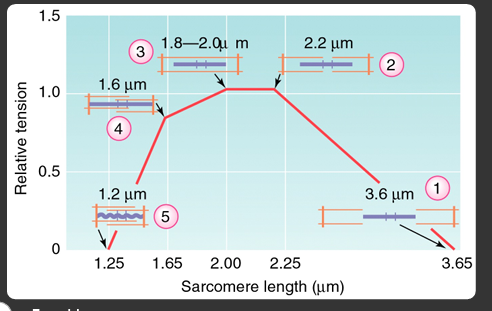
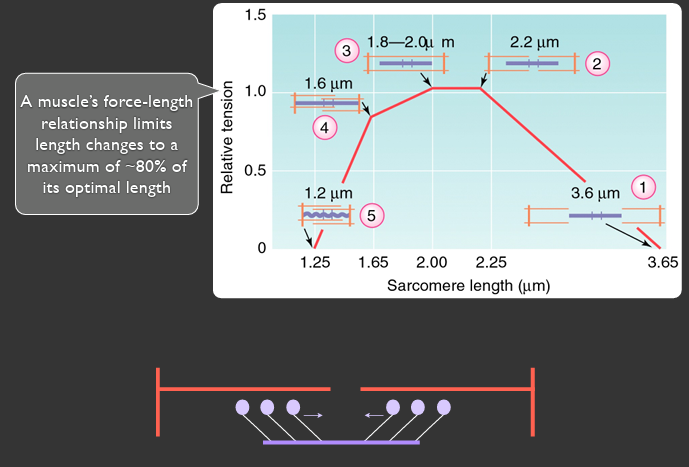
graph of tension vs sarcomere length
x axis = sarcomere length (um)
y axis = relative tension
most optimal is intermediate overlap and sarcomere length
a muscles force-length relationship limits length changes to a max of ___% of its optimal length
80%
what is the graph of muscle length vs force
x axis = muscle length (% Lo)
y axis = force (%Fo)