Lecture 5: Metabolic Rate lll
1/53
There's no tags or description
Looks like no tags are added yet.
Name | Mastery | Learn | Test | Matching | Spaced |
|---|
No study sessions yet.
54 Terms
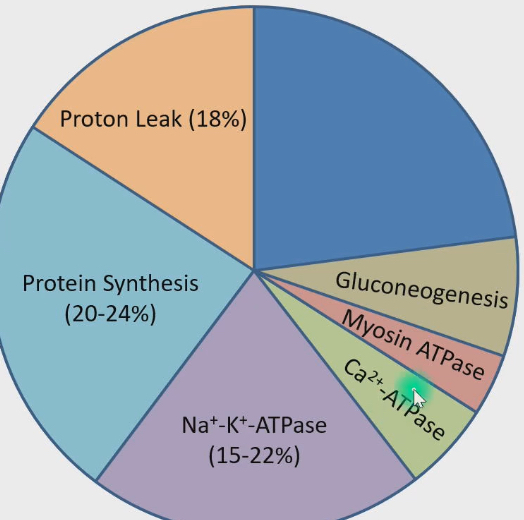
3 biggest contributors 60% or more of BMR or SMR
Proton leak (18%)
Protein synthesis (20-24%)
Na+-K+-ATPase (15-22%)
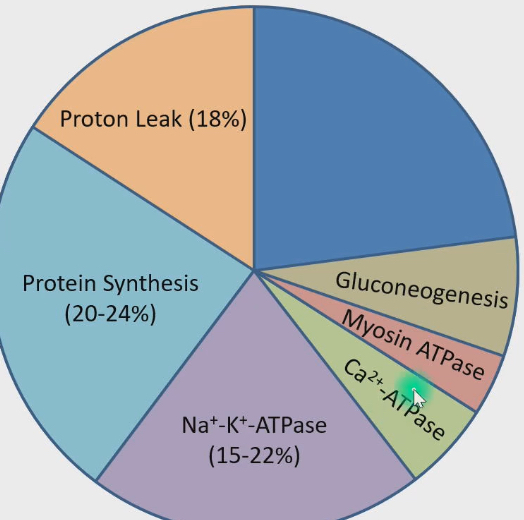
3 smaller contributors to BMR or SMR
Ca2+ ATPase
Myosin ATPase
Gluconeogeneis
Ca2+ ATPase
Helps muscles to relax by pumping all Ca out of cells
Myosin ATPase
Muscle contraction, gives myosin energy to pull on actin filaments to cause muscle contraction
Ex. Diaphragm, postural muscles are contracting even if we are not moving
Gluconeogeneis
Synthesizing glucose from non carbohydrate precursor, like amino acid. Since we are not feeding, we are not consuming any glucose.
When we go through period of not eating, body has to generate glucose form non carbohydrates (because we don’t store carbs in the body) to regulate blood glucose levels
Requires energy to convert amino acid to glucose
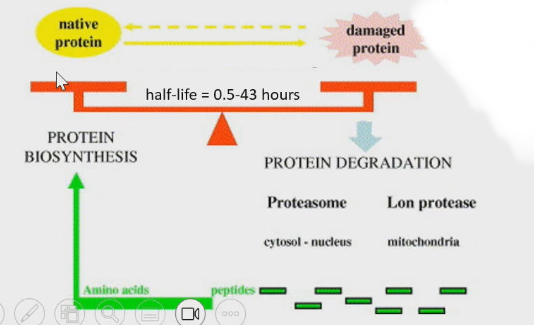
protein synthesis
Proteins in body don’t last forever
Over time proteins become damaged
Typical half life of protein is half an hour to 43 hrs
Every day or two all proteins in body have to be remade to maintain structural and functional integrity of body
Proteins get degraded to amino acids and then we rebuild amino acids to functional proteins we need
Requires energy
ATP is needed to load amino acids on to the tRNA molecules which is needed for building amino acids→ proteins
Biggest contributor to SMR or BMR (20-24%)
Do we need protein in diet, or can we just live off of the protein we already have as it degrades and gets rebuilt again
Don’t let figure mislead you to think you never need to consume proteins in your life. But we will loose proteins or amino acids from body
This can happen amino acids in the blood can get filtered out by kidney and end up in urine. We might not reabsorb all those amino acids
Some amino acid lose in urone (exported organic matter)
Protein in skin cells that can be lost to environment (exported organic matter)
Amino acids sometimes used when they are oxidized for energy
Amino acids does need to be in diet to be able to replenish amino acids lost

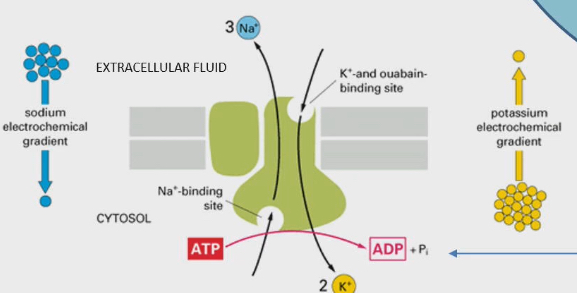
Na+-K+-ATPase (15-22%)
Enzyme found in plasma membrane of every cell in animal body
Enzyme uses energy in ATP to pump sodium ion out of cell (into extracellular fluid) and pump K ions into the cell (into intracellular fluids or cytosol)
This established gradients
Sodium gradient: concentration of sodium is high in extracellular fluids, but low inside the cell
Potassium gradient: concentration of K is high inside the cell, but low outside the cell
The gradients are useful
Generate action potentials
Function of neurons
Represent energy stores
It takes energy to generate gradients across cell membrane. Gradients themselves are a source of energy
A process not at equilibrium = process is an energy source
If you let it come back to equilibrium, releasing free energy you can use
Cells can tap into energy stored in these gradients to do work. ATP not always used to do certain processes, sometimes its the gradients that provide the energy
Cell membrane is semipermeable to K and Na witching the sodium potassium pump → weakness in process
Some K and Na that we pump across cell membrane leak back across that membrane and dissipate the gradient. We have to spend energy to pump ions back and reestablish gradients
That leak and pumping that we do to compensate for that leak, thats why Na+-K+-ATPase is always active within our cells
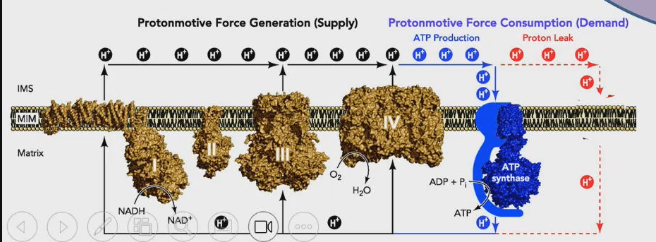
Proton leak
Electron transport system in mitochondrial membrane
Complex 1-4 take NADH and FADH from oxidation of glucose, fats, sometimes proteins
Electrons get passed through the complexes to complex 4 where O2 enters the picture → oxygen gets reduced to water
Since O2 has high affinity for electrons, as we are passing electrons through system to O2, there is this release of free energy that takes place
These complexes use release of free energy to pump protons across the inner mitochondrial membrane. From inside mitochondrial (mitochondrial matrix) to the inter membrane space (in between inner and outer mitochondrial membrane )
Proton gradient gets established across inner mitochondrial membrane, that can be used as an energy source to power synthesis of ATP
ATP synthase (in inner mitochondrial membrane) will allow protons to flow back to mitochondrial matrix and dissipate the proton gradient. This releases energy and this energy powers the synthesis of ATP
This occurs when protons are able to cross inner mitochondrial membrane Independent of the ATP synthase. When protons find a different way back to mitochondrial matrix bypassing the ATP synthase, there is energy release that is not conserved as ATP, but as heat that leaves the body
Mitochondrial electron transport system has to repump protons back to make up for that leak. This leak of protons that we compensate for accounts for 18% of BMR
almost 40% of contributors to BMR or SMR
Is due to the leakiness of membranes toward ions and protons
Factors affecting BMR/SMR
Membrane pacemaker hypothesis
Thyroid hormones
Body mass
Membrane pacemaker hypothesis
The leakiness of membranes is a major factor that determines what BMR or SMR will be
Basic structure of phospholipid
3 parts
Glycerol backbone: 3 carbon molecule
Attached to first carbon : phosphate contains head group
Attached to 2 and 3 carbon: fatty acids attached

2 types of fatty acids
Saturated
Unsaturated
Saturated fatty acid
No double bonds in structure
Only single bonds
Carbons are bonded to max hydrogen thats possible (saturated with hydrogens)
Bottom fatty acids attached in diagram
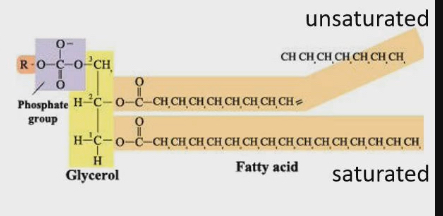
Unsaturated fatty acid
Double bonds
Causes kink or bend in chin
Top fatty acids in diagram

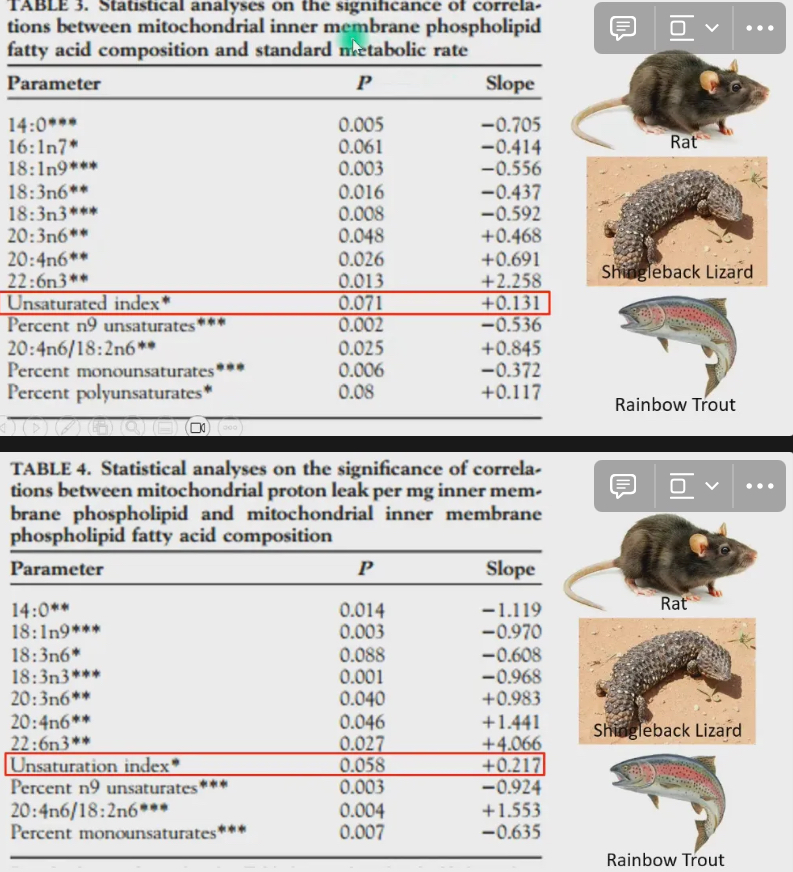
Different type of fatty acids affect how leaky membranes are
Study done examining mitochondrial proton leak, and phospholipid fatty acid composition in lots of animals (rats, shingleback lizard, rainbow trout)
Unsaturation index: measure of how unsaturated fatty acids are within phospholipids of mitochondrial inner membrane
More double bonds = higher unsaturation index will be
Positive correlation between mitochondrial proton leak and phospholipids of fatty acids of mitochondrial inner membrane
More unsaturated fatty acid of phospholipids of membrane are, the leakier the membrane is to protons and K and Na ions
Unsaturated membrane, with unsaturated fatty acids in their phospholipids are leakier to protons and ions, compared to membranes with saturated fatty acids in phospholipids
Also examined relationship between mitochondrial inner membrane phospholipid fatty acid composition and standard metabolic rate
There is still positive correlation in unsaturated index
Put 2 tables together conclusion is : more unsaturated fatty acids you have within the phospholipids in membrane, the leakier the membrane will be for protons, and K and Na ions.
Therefore more energy you will have to spend to keep pumping protons and ions against that leak. That will push value of SMR or BMR higher
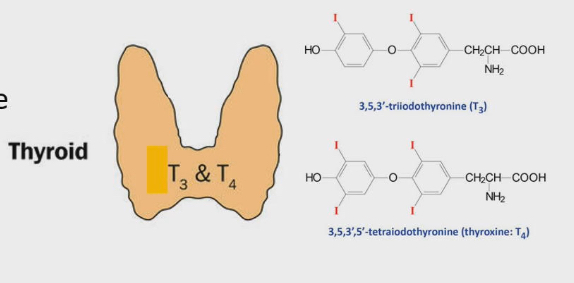
Thyroid hormones
Vertebrates have a thyroid gland. Mammals have W shaped thyroid gland that hugs larynx (voice box) in throat
makes 2 hormones
T3 or triiodothyronine
3 iodines in structure
T4 (thyroxine) or tetraiodothyronine
4 iodines in structure
Thyroid hormones have iodine atoms in structure. This makes them unique to other compounds in biology. Iodine in diet is needed to build thyroid hormones
thyroid hormones have role in
Maintaining SMR/BMR
Neurological development in utero
Thyroid hormones also affect BMR/SMR by influencing NA-K-ATPase activity, protein synthesis and proton leak
Inject animlas with more thyroid hormones = more activity in these 3 mechanisms
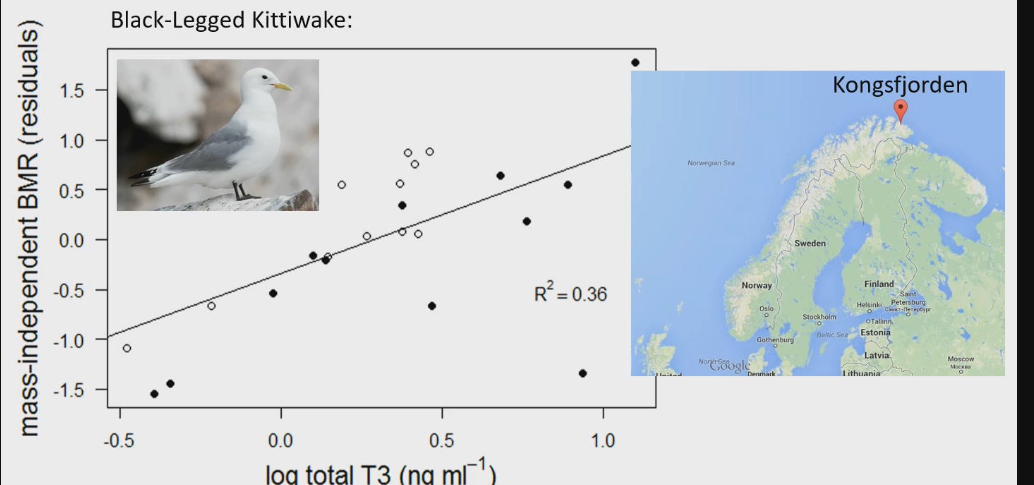
Study in thyroid hormones
Study took place in north of Norway (HA HA HA HAALAND) Called Kongsfjordon
There is a bird called black legged kittiwake
Researchers caught these birds, took blood sample and measure T3 in plasma. Took them back to lab to measure BMR
Residual = BMR after factoring out body size
Positive correlation between T3 and BMR. More T3 =higher BMR was
Therefore T3 and T4 increase BMR
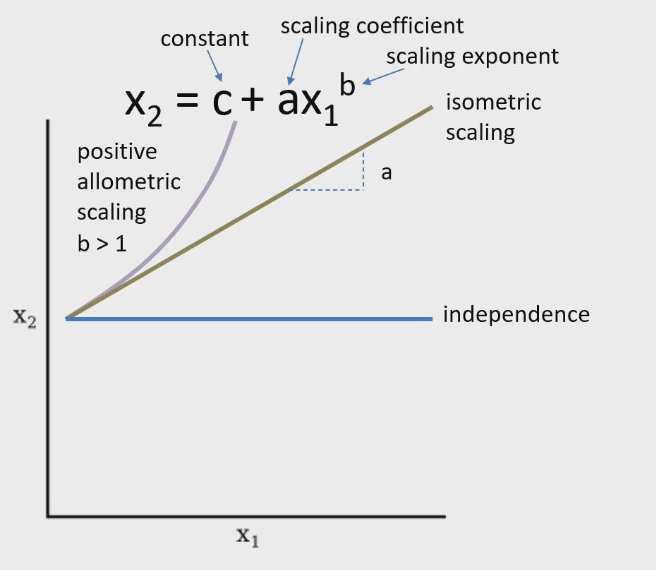
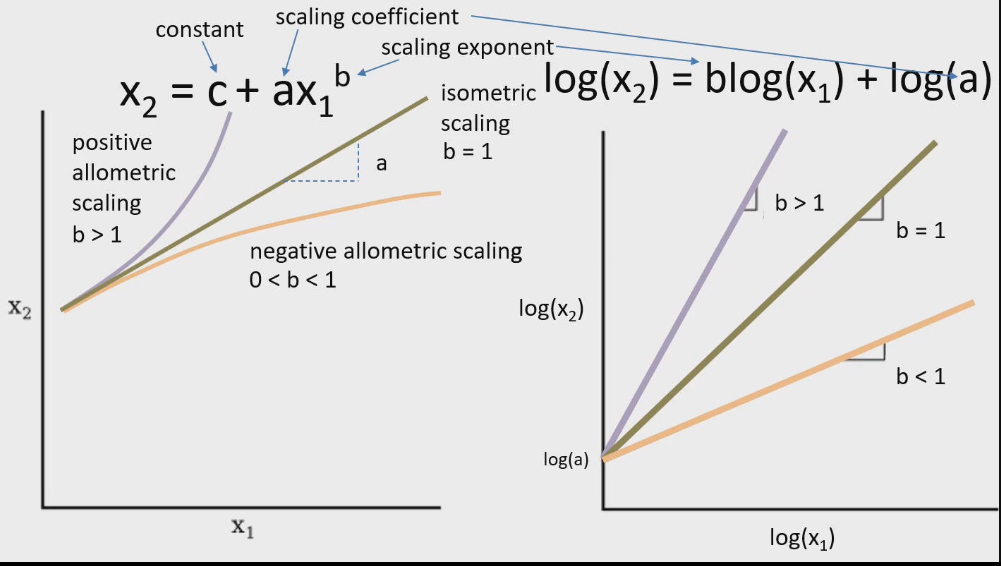
Interested in relationship between two random biology parameter X1 and X2
We explore nature of this relationship, we think about how they could be related
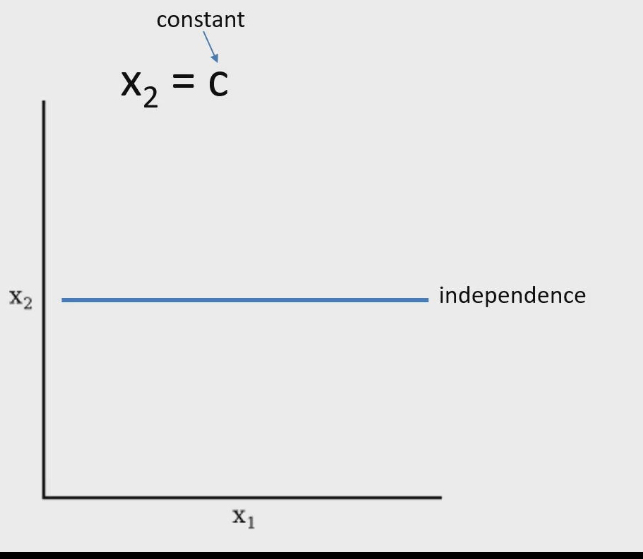
Blue line: as X1 increases, X2 not changing (this is Independent relationship)
Green line: as X1 increases, X2 also increases. Rate of increase of X2 is constant (constant slope of a)
Purple line: as X1 increases X2 also increases. Rate also keeps getting greater as X1 increases
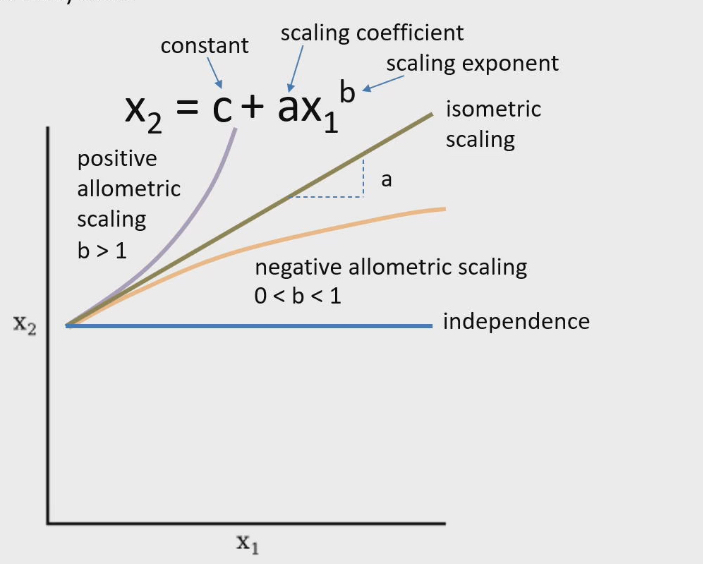
Orange line: as X1 increases X2 also increases. Rate of increase gets gradually less. Slope decreases as value of X1 increases.
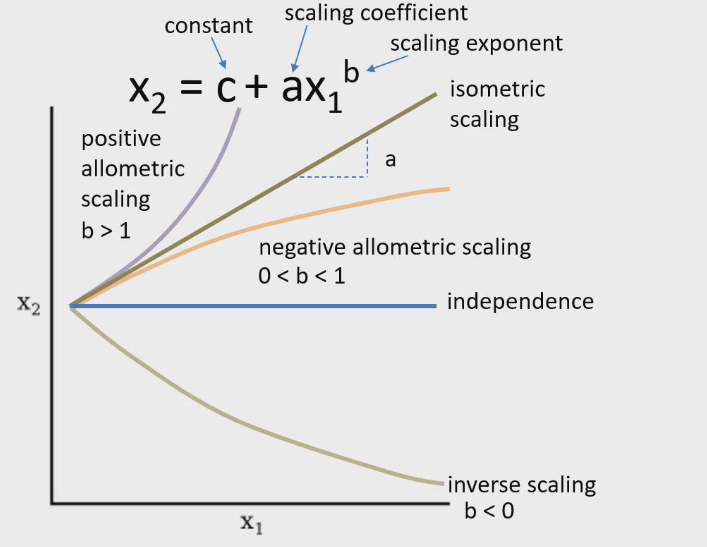
Bottom line (green again for some reason): As X1 increases, X2 decreases.
X2= c+ aX1 ^b shows how any 2 bio parameters relate. If we know value of scaling exponent, that tells us nature of their relationship.

Independent relationship
Blue line: as X1 increases, X2 not changing (this is Independent relationship)
X1 and X2 are Independant parameter that don’t influence each other
Formula : X2 = c(constant)
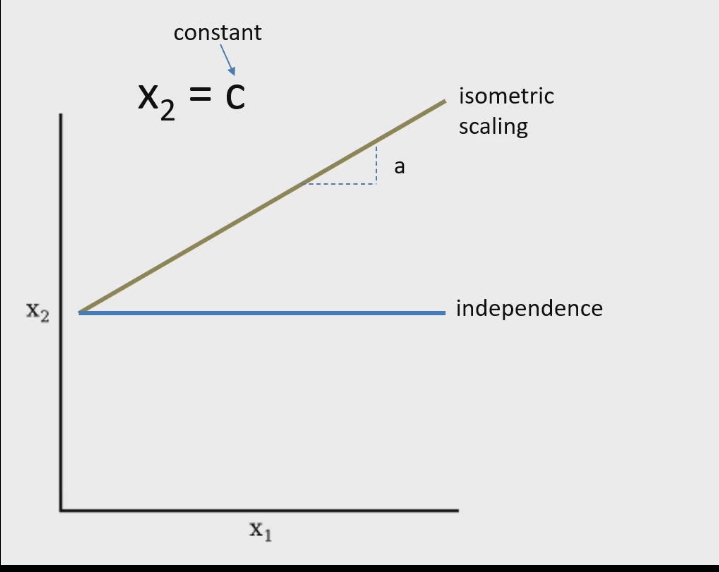
Isometric scaling (linear relationship)
Use isometric in physiology because “iso” means same
Green line: as X1 increases, X2 also increases.
Rate of increase of X2 is constant (constant slope of a)
Slope of line is same no matter value of X1 is
Formula: X2 = c + aX1 (basically y=mx +b)
a= scaling coefficient
c= constant
Positive allometric relationship
“Allo” means different, something other than isometric
Purple line: as X1 increases X2 also increases.
Slope also keeps getting greater as X1 increases
Formula
X2= c+ aX1 ^b
a= scaling coefficient
c= constant
b=scaling exponent on X1 value. If exponent is >1 it will give positive allometric relationship between X1 and X2
Exponent being greater than 1 is what drives X2 to increase more rapidly as X1 increases
Negative allometric scaling
Orange line: as X1 increases X2 also increases. Rate of increase gets gradually less. Slope decreases as value of X1 increases.
Has same formula as positive allometric scaling (X2= c+ aX1 ^b ) but exponent b has to be 0<b<1
Inverse scaling
Inverse relationship
(green again for some reason): As X1 increases, X2 decreases.
Has same formula as positive allometric scaling (X2= c+ aX1 ^b ) but exponent b has to be b<0
Can we use the big equation X2= c+ aX1 ^b for isometric and independent relationship
Yes
Isometric
Value of scaling exponent = 1
X1 ^1 is X1 then you get the linear equation you had before
Independent
Value of scaling exponent = 0
X1^0 =1
1 x a(thats a coefficient but also another constant) + actual constant c
Basically gone done to X2= c
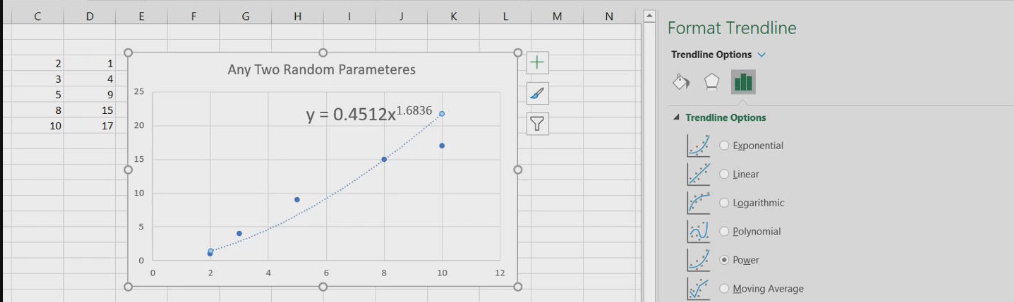
X2= c+ aX1 ^b Is what type of function
Power function
Because X1 is a variable base, and exponent b will have a value
Not exponential because our base is not constant
This is important because when we get data set we can put them into excel and plot data, and get trend line, choose power treadline, tell it to get us the equation
Y=0.04512x^1.6836
Nature of relationship is positive allometric because b is > 1
isometric, positive allometric and negative allometric relationships Without computers
Nonlinear relationships made it hard to find exponents before excel systems
In past they figured this out by transforming nonlinear data to linear by doing log transformations (X1, X2) → (log(X1), log(X2) )
makes all the relationships linear
log (X2) = blog(X1) + log (a)
b (scaling exponent) is now the new slope and scaling coefficient is a
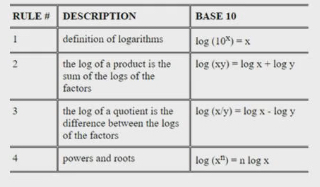
Properties of logarithms
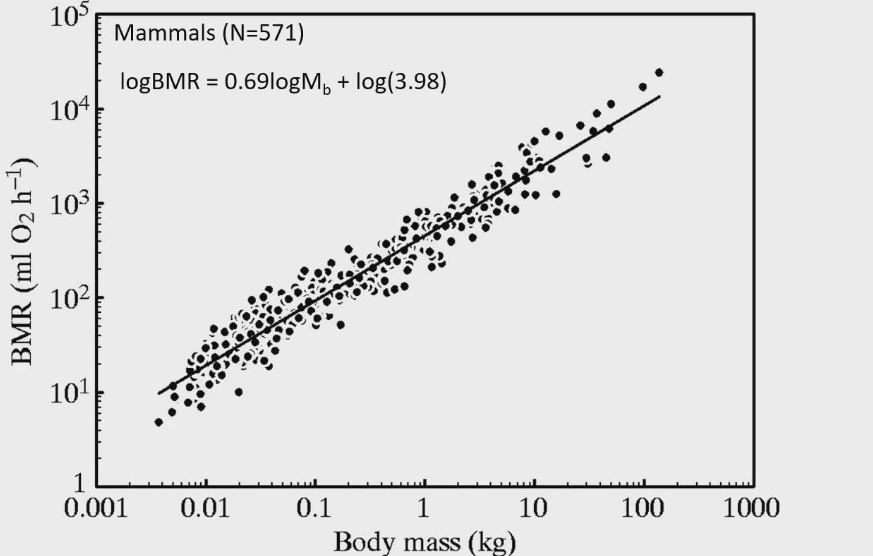
Body mass
Plot where someone plotted BMR vs Body mass for 571 mammals
These are log scales not linear (we can tell because scale 0.001, 0.01. 0.1, 1 etc)
Linear relationship
The scaling exponent in 0.69 → slope of line
The exponent tells us relationship is negative allometric because b is 0<b<1
Relationship between body mass and BMR in animals is
Negative allometric
As body mass increases (smaller to larger species) the BMR increases. It increases in a way where slope of that relationship get smaller and smaller
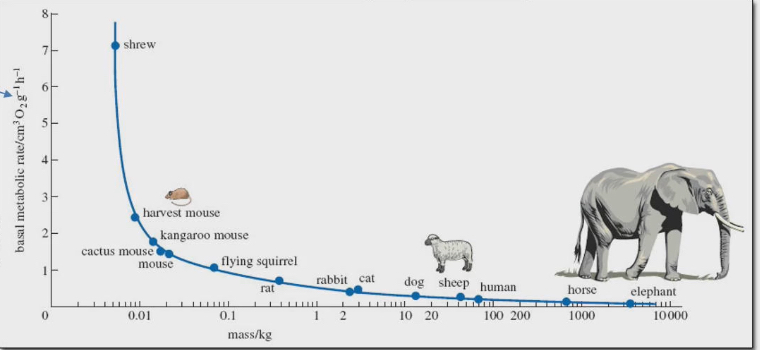
Shrew elephant curve
Body mass on x axis
BMR that is mass specific on y axis
Taken BMR and divide by weight of animal to figure out per gram body mass value of BMR
1 g of shrew consumes 7ml of O2 an hour
1 g of elephant consumes 0.3 ml of O2 an hour
They don’t consume same amount of O2
Obviously overall BMR, elephants will have more than shrew because they are more
Smaller animals (like shrews) have higher metabolic rates per gram of body tissue than larger animals (like elephants).
This means a shrew burns through energy much faster relative to its size than an elephant does.
The curve shows an inverse relationship: as body size increases, the mass-specific metabolic rate decreases. → this is because the slope keeps decreasing as body mass increases
Body mass vs BMR
= negative allometric
Body mass vs mass specific BMR
= inverse allometry (scaling)
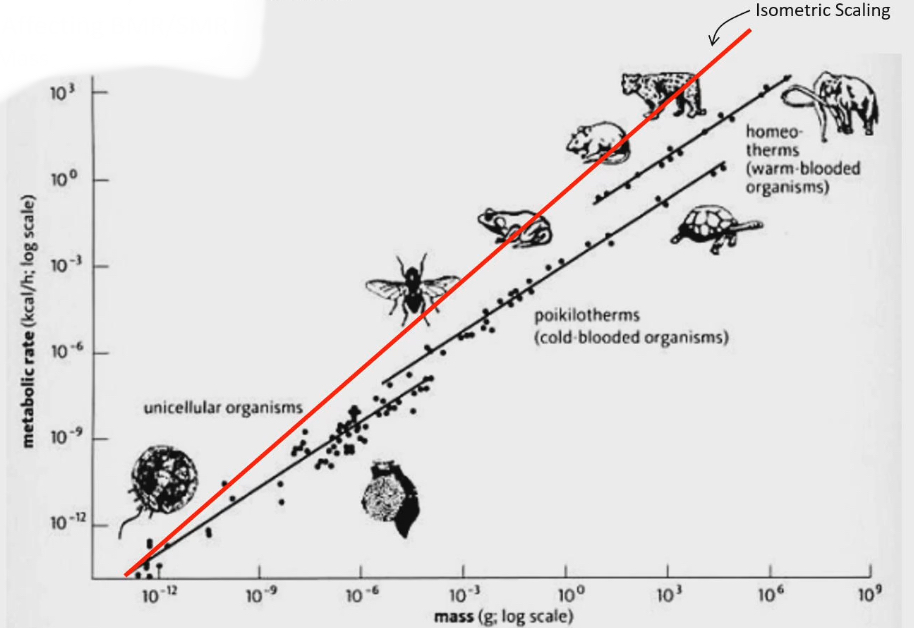
Shrew elephant curve Not just for mammals or animals
metabolic rate on y axis, mass on x axis, both are log scales
Red line have slope of 1 =isometric relationship between metabolic rate and mass
Slopes for poikilotherms, homeotherms and no animals unicellular organisms, the slope is less than one (even though all the lines start overlapping the red, they end up below the isometric line) = negative allometric relationship
3 ideas why does BMR/SMR scale with negative allometry
Surface law
Cell size variation
Surface Law
Put forward by German physiologist Max Rubner in 1883
Based on geometry
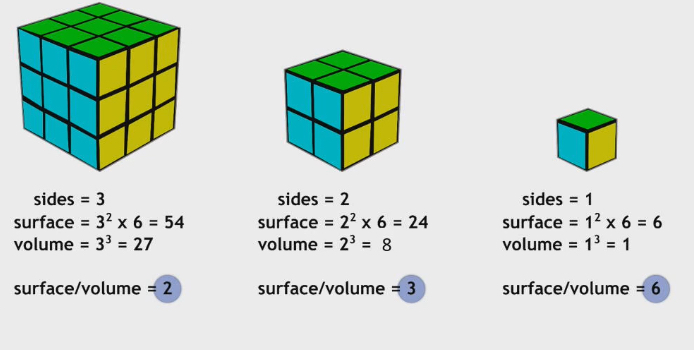
Think of animals as cubes (can also represent these as powers)
Smallest cube
Sides of length: 1
Surface area: LW x 6 sides = 1x1 x6 =6
Volume : LxWxH = 1x1x1=1
Surface / volume = 6/1 =6
Medium cube
Sides of length: 2
Surface area: LW x 6 sides = 2x2 x6 =24
Volume : LxWxH = 2x2x2=8
Surface / volume = 24/8 =3
Large cube
Sides of length: 3
Surface area: LW x 6 sides = 3x3 x6 =54
Volume : LxWxH = 3x3x3=27
Surface / volume = 54/27 = 2
The surface area and volume of largest cube is obviously larger. But surface area/volume ratio decreases
As shapes increase in size, surface area doesn’t increase as much as volume does and so surface area/volume ratio decreases
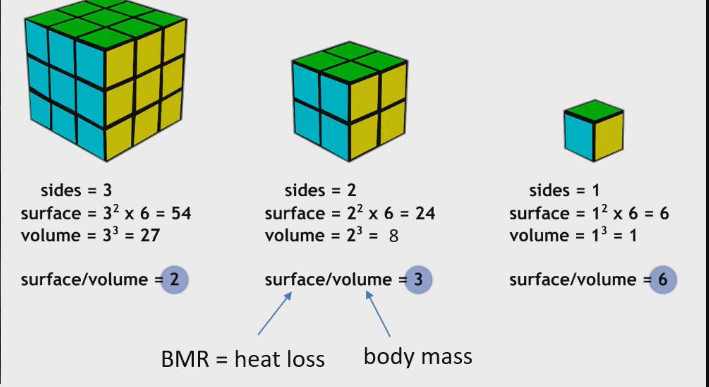
Rubner said body mass of individual is proportional to volume (how much stuff can I fit in body volume)
MR should not exceed the rate that you can loose heat from body, thats how we maintain constant body temp
BMR = heat loss = surface area
Rubner surface law equation
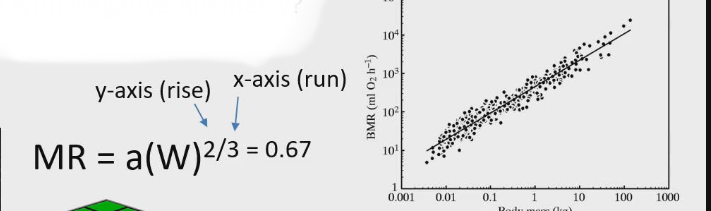
MR =a(W) ^(2/3)
BMR= body surface area = l² = 2 in the exponent
W= Body mass = volume = l^3 = 3 in exponent
Led to conclusion that scaling exponent is 2/3
Why not scaling exponent in Rubner surface law equation be 3/2 instead of 2/3
Linear lines on log scales, the slope = scaling exponent
Slope = rise/run = yaxis (BMR)/ x axis (Body mass) = 2/3
Rubner side conclusion
We can predict the scaling exponent between any 2 biological parameters if we know how the parameters are related to length, surface area or volume of organism
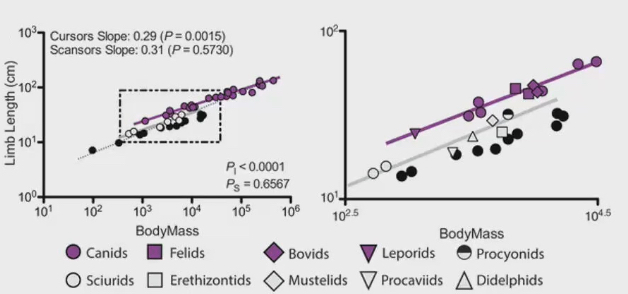
Study between body mass and limb length (ON TEST PREDICTING SCALING EXPONENT)
Limb length = body length = l^1
Body mass = volume
Predicted exponent using surface law was 1/3
Calculated slope was 0.29 for cursor (animals adapted to running
Calculated slope was 0.31 for sensors (animals adapted to climbing)
Why do runners have shorter limb length than predicted
Flaws in Rubner surface law
Surface law for mammals and endothermic (animals with high MR that can regulate their own temp)
Ectotherms can’t use their own heat to regulate body temp because low MR
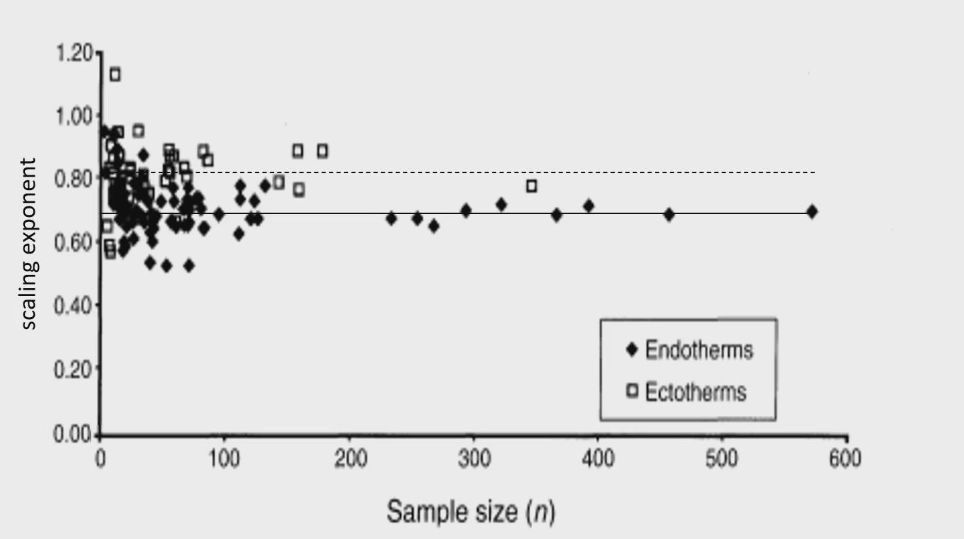
Different studies and plotted what scaling exponent was
For endothermic (mammals and birds) the average scaling exponent was 0.67 (exactly what surface law predicts)
Ectotherms the average scaling exponent was 0.8. Surface law was unable to predict scaling exponent for ectotherms
For endothermic, high MR, large metabolic heat, ability to get rid of heat is a constraint and limititation to how fast MR can be
Ectotherms are not limited by how they get rid of body heat, they barely produce any body heat at all.
Surface law great for enthrotherms, not ectotherms
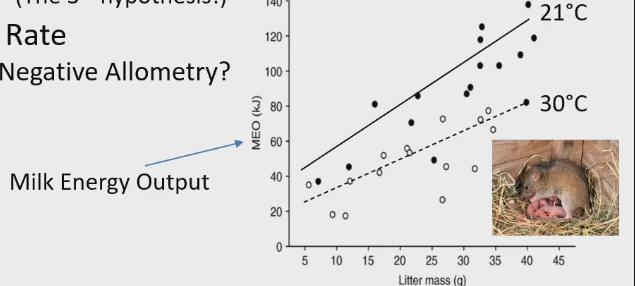
Heat dissipation limitation hypothesis (3rd hypothesis)
Endothermic like mammal or birds, the highest MR they can achieve is determined by their ability to eliminate body heat across body surface
Faster animal can eliminate heat across body surface, higher MR can be
Study to support Heat dissipation limitation hypothesis
MR increase after birth because of intensity of milk production
In study measure, milk energy output (how much energy leaves mice in milk → exported organic matter)
As literature mass increases, milk energy output increases
More pups to feed, more milk you need
Kept moms at 2 temps
21ºc or 30ºC
At 30ºC, same litter mass, reduce milk energy output
When its hot outside they can’t dissipate heat from body easily, can’t ramp up MR to make all milk, they slow metabolism down
If they tried to make as much milk at 30ºC that they do at 21ºC they can’t get rid of milk effectively, temp will keep getting hotter and hotter, they’d kill themselves by heating themselves from inside out
Therefore max MR increases if you have better ability to dissipate heat from body
if you shave female mice they will produce more milk
Because they can dissipate heat better, higher MR AKA Heat dissipation limitation hypothesis
After female mice feed they will move around
To expel heat from body so they will produce more milk
dissipate heat better, higher MR AKA Heat dissipation limitation hypothesis
Cell size variation
O2, CO2, nutrients and wastes all enter /exit cells across their surface
Not across entire animal, but each individual cell
What allows elephant to get large at cellular level (2 possibilities)
Cell hypertrophy
Cell hyperplasia
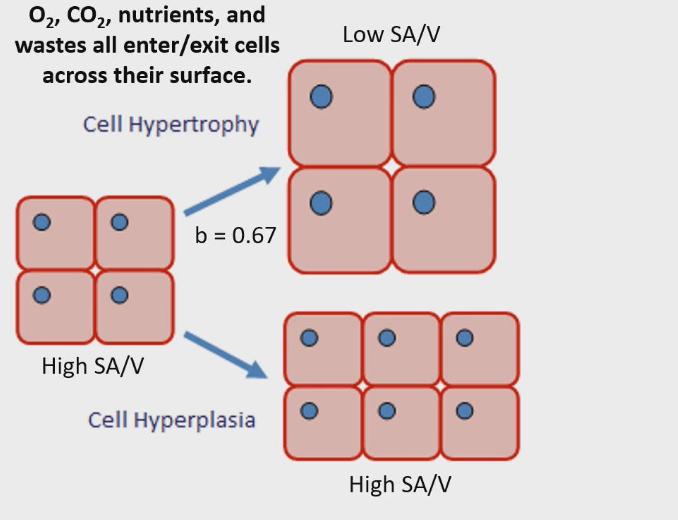
Cell hypertrophy
Cells get bigger in size.
Ex. Elephant gets bigger because cells as larger. Me and elephant have same number of cell, but theirs are 10x LARGER = so 10x bigger
Low SA/V ratio (remember shrew to elephant curve)
Big volume, surface area not keeping up
Can’t get O2, CO2, nutrients and wastes all enter /exit cells across their surface very rapidly
Has to constrain metabolism of each cell so it doesn’t outpace ability to get things in and out of cell across membrane
b= 0.67 → surface limitation just like surface law, just at cellular level
Cell hyperplasia
Animal is big because it has more cells
Elephant is bigger than me because its cells and my cells are the same size, but elephant has 10 x MORE = so they are 10x bigger
Small cells have high surface area/volume ratio
Small cells don’t have surface area constraint, they’re constraint is their volume, how many cells are there
b=1
Volume of cells is determining metabolic rate
Exponent between 0.67 <b<1
0.67 and 1 are boundaries, but a scaling exponent in between suggests animal uses combination of Cell hypertrophy and Cell hyperplasia
Evidence supporting Cell size variation
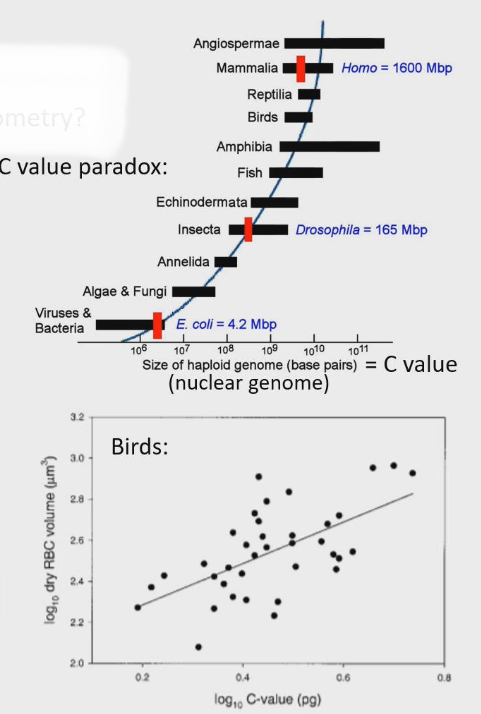
C value = measure of haploid nuclear genome size ( how many base pairs is one copy of nuclear genome)
Biologists used to think more complex organism is , bigger C value should be = more genes means more complexity
That’s not true
Angiosperms (flowers and plants) have highest C value
Amphibians have highest C value in animals
No relationship between complexity and higher C value
Why don’t humans or more complex animals have more genes?
Not number of genes that makes you complex, but number of proteins you have
Produce many proteins from single gene (no 1:1 relationship)
C value is a good predictor of volume of cells
Study in bird species. Positive correlation, bigger c value, bigger cell volume
Reason for that, bigger c value, more genes you have, bigger nucleus has to be, bigger cell has to be
C value bad predictor of organism complexity, good predictor of cell volume
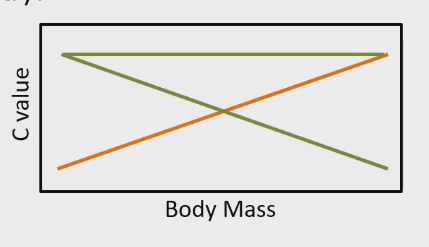
Relationship between c value and body mass
Positive correlation: Cell hypertrophy (orange line)
Bigger animals get bigger because bigger cells with bigger genome
Positive c value slope = cell hypertrophy = b value of 0.67
Constant or negative correlation : Cell hyperplasia (green line)
Zero/negative c value slope = Cell hyperplasia = b value of 1
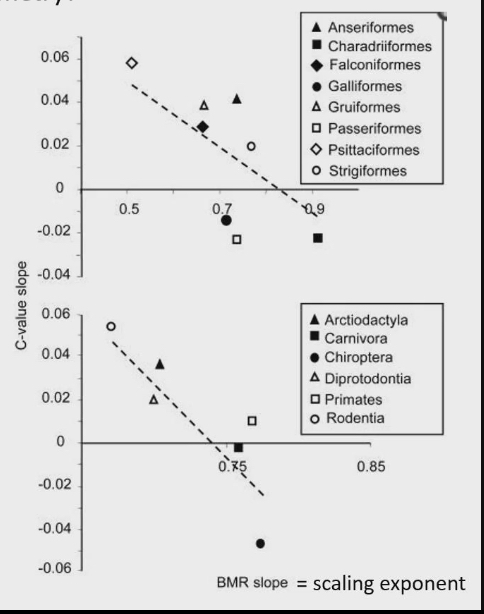
Test of cell size variation hypothesis
C value slope on y acid
BMR slope = scaling exponent = x axis
Zero or Negative slope = scaling exponent of 1 = high BMR slope
Positive slope = scaling exponent of 0.67 = low BMR slope