3.3 Changes in Equilibrium Price and Quantity The Four-Step Process
1/15
There's no tags or description
Looks like no tags are added yet.
Name | Mastery | Learn | Test | Matching | Spaced |
|---|
No study sessions yet.
16 Terms
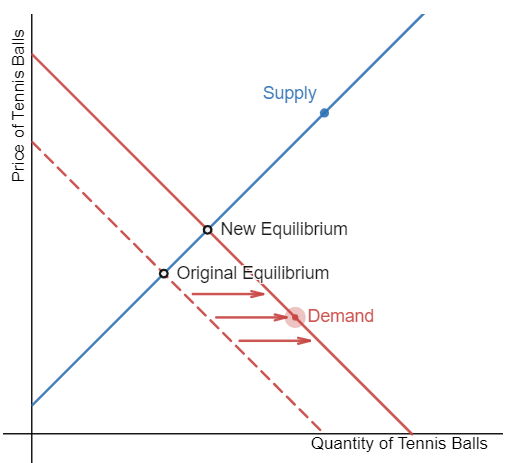
Demonstrate the effect a decrease in the price of tennis rackets will have on the equilibrium price and quantity of tennis balls. Drag the demand curve to demonstrate this effect.
Step 1: Draw the initial supply and demand curves with the initial equilibrium price and quantity.
Step 2: Is the supply or demand affected? A decrease in the price of tennis rackets will increase the demand for tennis balls because they are complementary goods.
Step 3: The demand curve will shift to the right.
Step 4: A rightward shift in the demand curve results in an upward movement along the supply curve. Equilibrium price and quantity of tennis balls will rise.
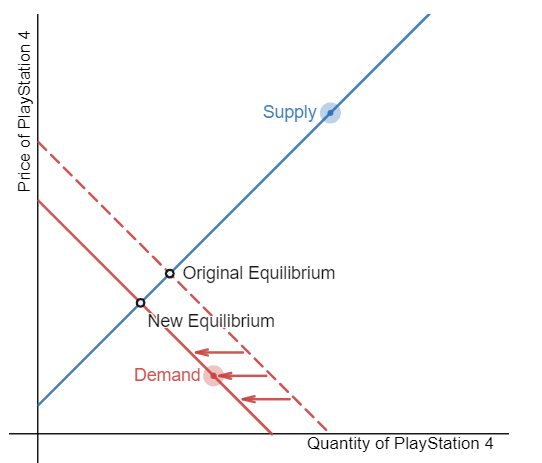
Sony has announced the debut of the PlayStation 5. Demonstrate the effects on the equilibrium price and quantity of the PlayStation 4 due to this announcement.
Grab the pull tab on the supply or demand curve to shift it in the appropriate direction.
Step 1: Draw the initial supply and demand curves with the initial equilibrium price and quantity.
Step 2: Is the supply or demand affected? Consumers are anticipating the release of a new and improved product, which affects demand for the current version.
Step 3: The demand for PlayStation 4s decreases, and the demand curve shifts left.
Step 4: A leftward shift in demand causes a movement down the supply curve, decreasing the equilibrium price and the equilibrium quantity.
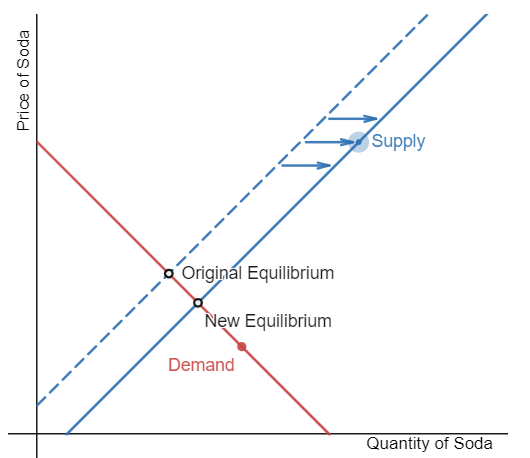
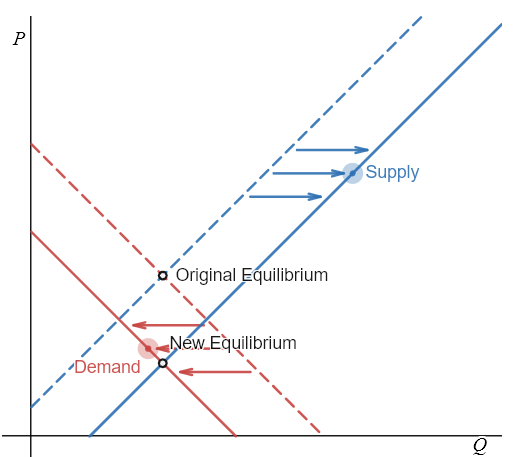
Suppose that a soda tax, intended to curb obesity, is already in place. Demonstrate the effect of a reduction in the soda tax on the equilibrium price and quantity of soda. Recall that taxes are considered as input costs to the producers.
Step 1: Draw the initial supply and demand curves with the initial equilibrium price and quantity.
Step 2: Is the supply or demand affected? The tax decrease will cause the costs to decrease for the producers of soda.
Step 3: The supply of soda will increase, shifting the supply curve to the right.
Step 4: A rightward shift in supply causes a movement down the demand curve, decreasing the equilibrium price and increasing the equilibrium quantity.
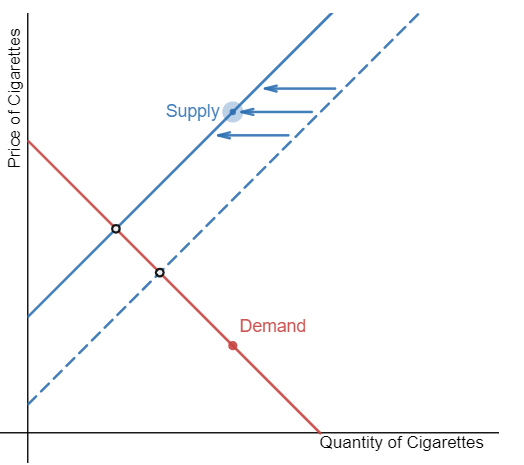
Tax rates on the sales of cigarettes have been reduced. Demonstrate the effect of the tax on the equilibrium price and quantity of cigarettes.
Step 1: Draw the initial supply and demand curves with the initial equilibrium price and quantity.
Step 2: Is the supply or demand affected? The reduction in taxes will increase the supply of cigarettes because profits will be increased.
Step 3: The supply of cigarettes will increase, shifting the supply curve to the right.
Step 4: A rightward shift in supply causes a movement down the demand curve, decreasing the equilibrium price and increasing the equilibrium quantity.
Given the supply and demand curves for cigarettes below, graph the change in the market if the government imposes a tax on the production of cigarettes.
Government policies can affect the cost of production and the supply curve through taxes, regulations, and subsidies. A tax placed on the production of cigarettes leads to a shift of the supply curve to the left. Equilibrium price of cigarettes rises, whereas equilibrium quantity falls.
Farmers are given a subsidy to encourage the production of more corn. At the same time, trendy diets have discouraged the use of corn syrup in products. Demonstrate the effect of these events on the equilibrium price and quantity of corn.
Provide your answer below:
Since this problem involves two disturbances, we need two four-step analyses.
First we'll analyze the shift in supply of corn.
Step 1: Begin with the initial supply and demand curves with the initial equilibrium price and quantity to illustrate the the market for corn looked like before this scenario starts.
Step 2: Did the described change affect supply or demand? A subsidy decreases the production cost of corn, impacting supply.
Step 3: Was the effect on supply positive or negative? The supply of corn will increase, shifting the supply curve to the right.
Step 4: Compare the new equilibrium price and quantity to the original equilibrium price. A rightward shift in supply causes a movement down the demand curve, decreasing the equilibrium price and increasing the equilibrium quantity.
Second, we'll analyze the shift in demand for corn.
Step 1: Begin with the initial supply and demand curves with the initial equilibrium price and quantity to illustrate the the market for corn looked like before this scenario starts.
Step 2: Did the described change affect supply or demand? A change in tastes toward corn syrup will cause a change in demand for corn.
Step 3: Was the effect on demand positive or negative? A change in tastes away from corn syrup causes decreased quantity demanded at every given price, causing the demand curve for corn to shift to the left.
Step 4: Compare the new equilibrium price and quantity to the original equilibrium price. The new equilibrium occurs at a lower quantity and a lower price than the original equilibrium.
The final step in a scenario where both supply and demand shift is to combine the two individual analyses to determine what happens to the equilibrium quantity and price. These are superimposed on the provided graph. Following are the results:
Effect on Quantity: The effect of the subsidy on corn is that it increases the supply of corn and thus increases the equilibrium quantity. The effect of a change in tastes away from corn syrup is that it decreases the equilibrium quantity. Since the two effect are in opposite directions, unless we know the magnitudes of the two effects, the overall effect is unclear.
Effect on Price: The effect of the subsidy on corn increases supply and thus decreases the equilibrium price. The effect of a change in tastes away from corn syrup also decreases the equilibrium price. Since both shifts are to the left, the overall impact is an decrease in the equilibrium price of corn.
An excise tax is introduced on the sale of propane. At the same time, the use of propane grills is going up due to the summer season. Demonstrate the effects of the tax & increased use on the equilibrium price and quantity of propane. Note that the excise tax affects the supply curve.
Since this problem involves two disturbances, we need two four-step analyses.
First we'll analyze the shift in supply of propane.
Step 1: Begin with the initial supply and demand curves with the initial equilibrium price and quantity to illustrate what the market for propane looked like before this scenario starts.
Step 2: Did the described change affect supply or demand? The excise tax will decrease supply of propane because profits will decrease.
Step 3: Was the effect on supply positive or negative? The supply of propane will decrease, shifting the supply curve to the left.
Step 4: Compare the new equilibrium price and quantity to the original equilibrium price. A leftward shift in supply causes a movement up the demand curve, increasing the equilibrium price and decreasing the equilibrium quantity.
Second, we'll analyze the shift in demand for propane.
Step 1: Begin with the initial supply and demand curves with the initial equilibrium price and quantity to illustrate what the market for propane looked like before this scenario starts.
Step 2: Did the described change affect supply or demand? A change in tastes toward grilling with propane grills during the summer months will cause a change in demand for propane.
Step 3: Was the effect on demand positive or negative? A [seasonal] change in tastes toward grilling causes higher quantity demanded at every given price, causing the demand curve for propane to shift to the right.
Step 4: Compare the new equilibrium price and quantity to the original equilibrium price. The new equilibrium occurs at a higher quantity and a higher price than the original equilibrium.
The final step in a scenario where both supply and demand shift is to combine the two individual analyses to determine what happens to the equilibrium quantity and price. These are superimposed on the provided graph. Following are the results:
Effect on Quantity: The effect of the tax on propane is that it decreases the supply of propane and thus decreases the equilibrium quantity. The effect of a change in tastes toward propane grilling is that it increases the equilibrium quantity. Since the two effect are in opposite directions, unless we know the magnitudes of the two effects, the overall effect is unclear.
Effect on Price: The effect of the tax on propane decreases supply and thus increases the equilibrium price. The effect of a seasonal change in tastes toward grilling also increases the equilibrium price. Since both shifts are to the right, the overall impact is an increase in the equilibrium price of propane.
![<p>Since this problem involves two disturbances, we need two four-step analyses.</p><p style="text-align: start"> </p><p style="text-align: start">First we'll analyze the shift in supply of propane.</p><ul><li><p><strong>Step 1:</strong> Begin with the initial supply and demand curves with the initial equilibrium price and quantity to illustrate what the market for propane looked like before this scenario starts.</p></li><li><p><strong>Step 2:</strong> Did the described change affect supply or demand? The excise tax will decrease supply of propane because profits will decrease.</p></li><li><p><strong>Step 3: </strong>Was the effect on supply positive or negative? The supply of propane will decrease, shifting the supply curve to the left.</p></li><li><p><strong>Step 4: </strong>Compare the new equilibrium price and quantity to the original equilibrium price. A leftward shift in supply causes a movement up the demand curve, increasing the equilibrium price and decreasing the equilibrium quantity.</p></li></ul><p style="text-align: start"> </p><p style="text-align: start">Second, we'll analyze the shift in demand for propane.</p><ul><li><p><strong>Step 1:</strong> Begin with the initial supply and demand curves with the initial equilibrium price and quantity to illustrate what the market for propane looked like before this scenario starts.</p></li><li><p><strong>Step 2: </strong>Did the described change affect supply or demand? A change in tastes toward grilling with propane grills during the summer months will cause a change in demand for propane.</p></li><li><p><strong>Step 3: </strong>Was the effect on demand positive or negative? A [seasonal] change in tastes toward grilling causes higher quantity demanded at every given price, causing the demand curve for propane to shift to the right.</p></li><li><p><strong>Step 4: </strong>Compare the new equilibrium price and quantity to the original equilibrium price. The new equilibrium occurs at a higher quantity and a higher price than the original equilibrium.</p></li></ul><p style="text-align: start"> </p><p style="text-align: start">The final step in a scenario where both supply and demand shift is to combine the two individual analyses to determine what happens to the equilibrium quantity and price. These are superimposed on the provided graph. Following are the results: </p><ul><li><p><strong>Effect on Quantity:</strong> The effect of the tax on propane is that it decreases the supply of propane and thus decreases the equilibrium quantity. The effect of a change in tastes toward propane grilling is that it increases the equilibrium quantity. Since the two effect are in opposite directions, unless we know the magnitudes of the two effects, the overall effect is unclear.</p></li><li><p><strong>Effect on Price: </strong>The effect of the tax on propane decreases supply and thus increases the equilibrium price. The effect of a seasonal change in tastes toward grilling also increases the equilibrium price. Since both shifts are to the right, the overall impact is an increase in the equilibrium price of propane.</p></li></ul>](https://knowt-user-attachments.s3.amazonaws.com/e10cb98c-91cc-4be6-ac4a-847e66dc34cb.png)
If the price of a good were to change will it shift demand or change quantity demanded?
It will shift demand to the right.
It will neither shift demand nor change quantity demanded.
It will change quantity demanded.
It will shift demand to the left.
It will change quantity demanded.
When economists talk about demand, they mean the relationship between a range of prices and the quantities demanded at those prices, as illustrated by a demand curve or a demand schedule. When economists talk about quantity demanded, they mean only a certain point on the demand curve, or one quantity on the demand schedule. A shift in demand means that at any price (and at every price), the quantity demanded will be different than it was before. A change in the price of a good or service causes a movement along a specific demand curve, and it typically leads to some change in the quantity demanded, but it does not shift the demand curve.
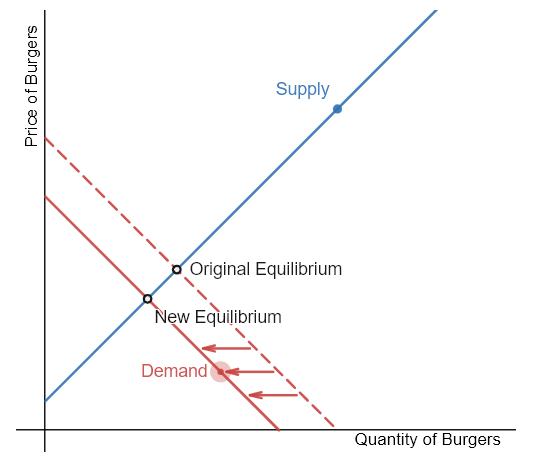
The market for burgers is initially in equilibrium. If the price of French fries (a complement) increases, demonstrate the effect on equilibrium price and quantity of burgers.
Step 1: Draw the initial supply and demand curves with the initial equilibrium price and quantity.
Step 2: Is the supply or demand affected? French fries and burgers are complements. If the price of French fries increases, the demand for burgers will be affected.
Step 3: The demand for burgers will decrease, or shift left.
Step 4: A leftward shift in demand causes a downward movement in equilibrium price and quantity.
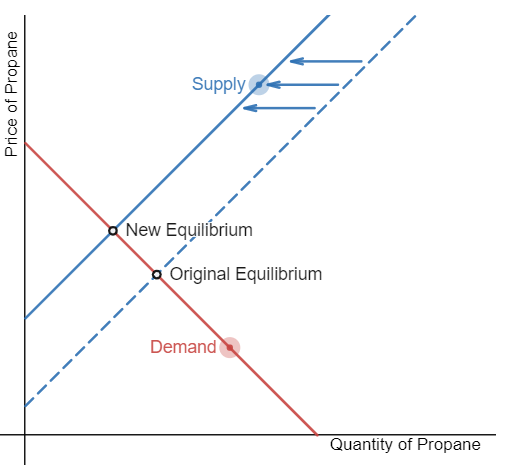
An excise tax has recently been applied to the sale of propane. Demonstrate the effects of the tax on the equilibrium price and quantity of propane.
Note: An excise tax is a tax on a particular good, for example on gasoline, tobacco, and alcohol.
Step 1: Draw the initial supply and demand curves with the initial equilibrium price and quantity.
Step 2: Is the supply or demand affected? The excise tax will decrease supply because profits will decrease.
Step 3: The supply of propane will decrease, shifting the supply curve to the left.
Step 4: A leftward shift in supply causes a movement up the demand curve, increasing the equilibrium price and decreasing the equilibrium quantity.
The graph below depicts the market for shoes in Portugal. Suppose the price of rubber, a key input in the production of shoes, decreases. Illustrate the effect of the change in the price of rubber on the market for shoes in Portugal by adjusting the graph accordingly.
One of the factors affecting supply is the cost of inputs. A fall in the cost of an input is a change that increases the quantity supplied at any given price. In this question, the price of rubber, a key input in the production of shoes, has fallen. Therefore, the quantity supplied of shoes at any given price would increase, shifting the supply curve of shoes to the right.
The demand curve does not shift because none of the factors affecting demand have changed. The result of demand remaining unchanged and supply increasing is a higher equilibrium quantity and a lower equilibrium price of shoes.
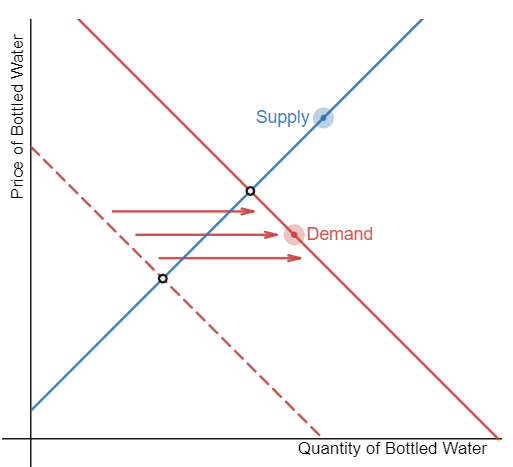
The graph below represents the market for bottled water. Graph the change in the market if a category 5 hurricane is predicted to hit the area by shifting the supply or demand curve in the appropriate direction.
Note: Assume that it is against the law for suppliers to pull water bottles from the stores in order to sell it later at higher prices.
When consumers hear the news of a major event, such as a hurricane, they stock up on the necessary goods to weather the storm. In this case, the demand for bottled water increases whereas supply stays unchanged. The shift of demand increases both equilibrium quantity and equilibrium price.
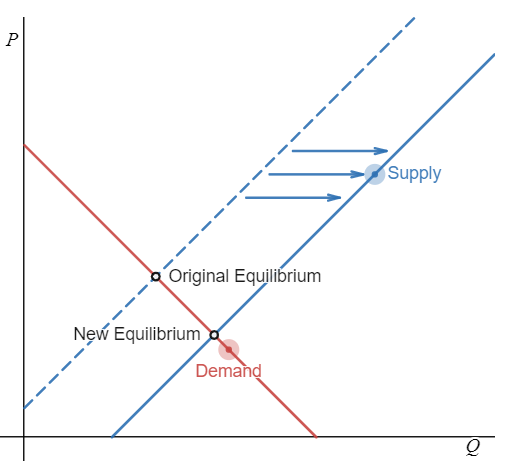
The Millennial generation sees a 10% wage decrease compared to the previous generation. How does this impact the demand for apartments as opposed to houses?
Step 1: Draw the initial supply and demand curves with the initial equilibrium price and quantity.
Step 2: Is the supply or demand affected? Apartments are an inferior good, so when income decreases, demand for apartments instead of houses increases.
Step 3: The demand for apartments will increase or shift right.
Step 4: A rightward shift in demand causes a movement up the supply curve, increasing the equilibrium price and the equilibrium quantity.
A drought results in a very small crop of sweet potatoes at the same time as the American Physicians Association releases a journal article praising the health benefits of sweet potatoes. Which of the following statements is true about the equilibrium quantity of sweet potatoes?
We do not know the magnitude of the shift in supply and demand; therefore, we cannot determine the effect on equilibrium quantity.
Equilibrium quantity must increase due to these events.
Equilibrium quantity must decrease due to these events.
None of the above.
We do not know the magnitude of the shift in supply and demand; therefore, we cannot determine the effect on equilibrium quantity.
In this situation, changes in supply and demand have opposite impacts on the equilibrium quantity. An increase in demand (due to the health benefits report) increases equilibrium quantity while a decrease in supply (due to impacted production from the drought) decreases equilibrium quantity. The only way to know for sure the overall effect is to know the magnitudes of the increases in supply and demand. Because the magnitudes of change in supply and demand are unknown, the impact on equilibrium quantity is unknown.
Corn syrup and maple syrup are substitutes. News of health benefits from maple has increased the demand for maple syrup and decreased the demand for corn syrup. Meanwhile, the government has subsidized corn crops, a key ingredient of corn syrup. As a result, the equilibrium price of corn syrup _______ and the equilibrium quantity ________.
is unknown; decreases
is unknown; increases
increases; is unknown
decreases; is unknown
decreases; is unknown
The supply for corn syrup increases (shifts right) due to the subsidy, and the demand decreases (shifts left) as people substitute maple syrup for corn syrup. Equilibrium price of corn syrup falls due to the two events, but the impact on quantity depends on the magnitude of the changes in supply and demand, so its effects are unknown.
Which of the following is not a factor that could cause a shift in the demand curve for a certain good?
Note: consider the difference between demand and quantity demanded.
a change in the price of a good
an increase in popularity of the good
an increase in the price of a complement
a change in income
a change in the price of a good
A change in the price of a good does not change demand for it. A price increase will change the quantity demanded but not shift the demand curve. If the price of a good increases, fewer people will want to purchase it, as explained by a downward sloping demand curve.