Standard scores
1/16
There's no tags or description
Looks like no tags are added yet.
Name | Mastery | Learn | Test | Matching | Spaced | Call with Kai |
|---|
No analytics yet
Send a link to your students to track their progress
17 Terms
Standard Scores Definition
A raw score converted to another scale with a set mean and standard deviation.
Standard Scores Purpose
Makes scores easier to interpret; shows performance relative to others.
Standard Score Benefit
Helps compare test-takers fairly across different tests/scales.
z score
Mean = 0
Standard Deviation (SD) = 1
Shows how far and in what direction a raw score is from the mean in SD units.
T score
Mean = 50
SD = 10
Always positive, avoids negative numbers.
Stanines
Mean = 5, SD ≈ 2
Range: 1 to 9 (whole numbers only)
Each stanine = ½ standard deviation wide
5th stanine = average (middle 20% of scores)
4th & 6th stanines capture about 17% each below/above average
Commonly used in achievement tests in schools
What is a z score?
A z score indicates how many standard deviations a raw score is above or below the mean.
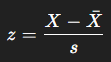
Formula for calculating a z score?
X = raw score
Xˉ\bar{X}Xˉ = mean
sss = standard deviation
What does a z score of +1 mean in terms of percentile?
About 84% scored equal or below, only ~16% scored higher.
Why are z scores better than raw scores?
They provide context:
Show relative standing in the distribution.
Allow comparison between different tests/scales.
Example of comparison across tests (Crystal’s case)?
Reading raw = 24 → z = +1.32 (above average).
Arithmetic raw = 42 → z = –0.75 (below average).
→ Even though raw arithmetic > raw reading, the z scores reveal better relative performance in reading.
T-Score is developed by
Standard score system developed by W.A. McCall (1922, 1939)
Named in honor of E.L. Thorndike
Other Standard Scores
Stanines
IQ (Deviation IQ)
SAT Scores (Linear Transformation Example)
IQ (Deviation IQ)
Mean = 100, SD = 15 (typical)
Approx. 95% of IQs fall between 70–130
Another type of standard score
Allows comparison across different age groups or tests
Sometimes called deviation IQ
SAT Scores (Linear Transformation Example)
Based on z scores
Converted to scale with mean = 500, SD = 100
Linear transformation: keeps direct relationship with raw scores
Differences between raw scores = same differences between standard scores
Linear vs. Nonlinear Transformations
Linear: Direct numerical relationship to raw score; differences preserved
Nonlinear: Used when data aren’t normally distributed → creates normalized standard scores
Normalized Standard Scores
Used when raw scores form a skewed distribution
Process = "stretching" distribution into a normal curve shape
Makes scores comparable across tests
Caution: Should only be used if skewness is due to the test, not the population