biology topic 7a
1/48
Earn XP
Description and Tags
sampling, populations in ecosystem
Name | Mastery | Learn | Test | Matching | Spaced | Call with Kai |
|---|
No analytics yet
Send a link to your students to track their progress
49 Terms
what are the 2 types of sampling?
random
systematic
why do ecologists undertake sampling?
estimate population size
calculate species diversity
investigate effect of independent variable on population eg pH soil
how do you recognise random sampling
study a large and uniform area/ comparing 2 area
how do you recognise systematic sampling
use when there is a gradual change across the area being sampled eg down rocky shore
whats a description of random sampling?
lay out tape measure at right angles to create 10×10m grid
use random number generator to give co-ords to place each quadrat
record the (% cover/number) of (plant/species) in many (20+) quadrats
(if asked work out mean by adding %/number of plant in each quadrat then dividing by number of quadrats) if not say total
how do you describe systematic sampling?
set up belt transect by laying a tape measuring down eg slope
place the quadrat at regular intervals (every metre) at side of the tape measure
count number/% cover of plant/species in each quadrat
repeat with many quadrats (20+)
repeat with belt transect at different places along eg slope
(can be continuous or interuppted)
define population
a group of organisms of the same species occupying a particular space at a particular time that can potentially interbreed.
define community
all populations of all the different species in an ecosystem/habitat
what is carrying capacity?
the size of a population of a species that an ecosystem can support
whats a niche?
role an organism occupies within its environment (particular biotic and abiotic factors to which it is adapted) eg plant species, temp/pH preferences
whats the difference between interspecific and intraspecific competition?
interspecific competition: individuals of different species competing for the same resources
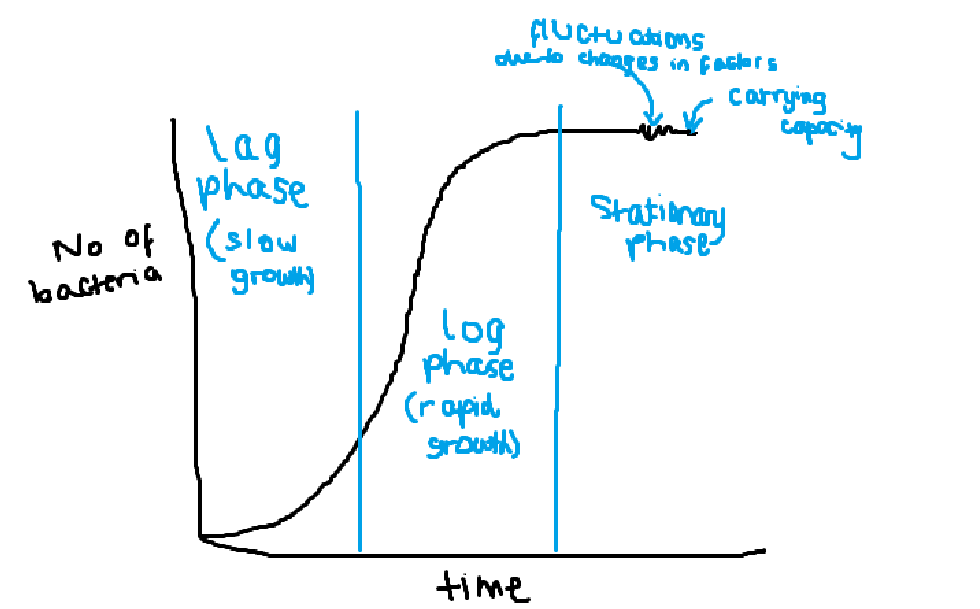
intraspecific competition: individuals of the same species competing for the same resources → causes carrying capacity (levels off graph)
what can population size vary as a result of?
effect of abiotic factors
interactions between organisms ie biotic factors (interspecific and intraspecific competition and predation)
what are ecosystems?
dynamic systems ie they can change
what curve is used to show changes in population?
population growth curve
how do scientists count the number of bacteria when there were such large numbers of them to find population size?
use serial dilution
what are examples of biotic factors?
predation
intra/interspecific competition
trampling
disease
what are examples of abiotic factors?
temperature
light intensity
wind speed
pH
water availability
nutrients → nitrates and phosphates
what is succession?
the progressive change in the composition and diversity of the species in a community in one place over a period of time
what are the 2 types of succession?
primary succession: starts in new habitats with no soil and no previous community; extreme environmental conditions
secondary succession: starts on bare soil where there had previously been a community extreme environmental conditions
describe the process of succession
pioneer species colonise as they survive in hostile environments
as organisms in PS die and decompose, results in humus and nitrates forming soil
makes environment less hostile
new species can survive and outcompete PS
overtime species diversity increases as more humus and nitrates added (even less hostile) and this continues until climax community is reached.
what happens since pioneer species are first to colonise?
they are subjected to extreme abiotic conditions eg extreme temperature and pH, lack of water and soil (nitrates and phosphates), and wind
how do pioneer species adapt to survive in the hostile environment?
to rapidly colonise a new area - asexual reproduction; rapid life cycle
to reach new areas to colonise - production of seeds with efficient long dispersal; rapid germination
to tolerate extreme conditions - photosynthesise; nitrogen fixing from atmosphere; tolerate little water and extreme pH
what does high biodiversity cause?
the community to be stable due to lots of species present so more complex food webs so if there was a change in one species then there would be little effect on others
what are features of climax community?
populations are stable over long periods of time
abiotic factors staying more or less constant
what can human actions do to succession?
can halt succession, sometimes deliberately eg mowing, coppicing, burning heater. farmers can grow crops, plough, use herbicides and graze animals
what sampling technique is used for mobile organisms and describe the process
mark, release, recapture
capture a large sample of organisms, count and mark them, release them back into same area
mark should not be toxic, affect survival, or make them more visible to predators
leave time for them to reintegrate into the population (but not reproduce)
capture a second sample and use the following calculation → (number in1st sample X number in 2nd sample)/ number of marked individuals in 2nd sample
what are some assumptions to do with mark release recapture?
no immigration between taking the samples
no births in population
mark is not lost/rubbed off
marked individuals distribute themselves
if any not true, can lead to over/underestimation
what are reasons for conservation?
economic - species as food/sources of medicine/products
aesthetic and cultural - enjoy countryside
ethical - all species have right to exist
ecological/personal - species are interdependent (food chains)
what does conservation work involve?
the managment of succession to preserve the species found at a particular stage. there is often a need to manage the conflict between human needs and conservation in order to maintain sustainability of natural resources
what are the sources of variation due to genetic factorss
main source - mutations (creates new alleles)
meiosis (new combination of alleles in gametes IS 2n and RBCO )
random fertilisation of gametes (2n)2
whats the specific variation affected by genetic factors alone?
discontinuous variation and can be represented on a bar graph or pie chart eg blood group
how do environmental factors affect variation?
exerts influence on all organisms and affect how the genes are expressed hence determine where these limits lie. eg butter cup height may have potential to be tall but can be limited by sunlight, wind etc
how is variation due ot environmental factors displayed?
continuous variation and can be shown on a normal distribution curve
what is selection pressure?
environment factors (that result in some individuals having a selective advantage) that limit the population of a species eg predation, competition, disease
what are the key words used to describe natural selection
random mutations
new alleles
selective advantage
better able to survive and reproduce to pass on alleles to offspringe
allele frequency increases
what competition does natural selection rely on?
intraspecific competition (only occurs if there are too many offspring produed)
what are the 3 types of selection
stabilising selection preserves the average phenotype (more likely to survive and reproduce) , selecting against extreme phenotypes
directional selection selecting phenotypes that vary in one direction from the mean (more likely to survive and reproduce) changes the phenotypes of population
disruptive selection is selecting for individuals with both extreme phenotypes, selecting against average phenotype
define speciation and give the 2 types
evolution of new species from existing ones
allopatric and sympatric
define species
group of similar individuals that are capable of interbreeding to produce fertile offspring
define and describe allopatric speciation
new species form from different populations in different areas
population reproductively isolated by geographical isolated
random mutations create new alleles (natural selection)
2 populations have different selection pressures
different individuals in both populations would have a selective advantage, be able to survive, reproduce and pass on their alleles
different change in allele frequency in 2 populations
separate gene pools form over many generations, individuals cannot interbreed to produce fertile offspring
define and describe sympatric speciation
new species form from a population living in the same area (reproductively isolated not geographically due to eg temporal, behavioural, mechanical isolation)
two groups within same population reproductively isolated
random mutations produce genetic variation
2 groups subjected to different selection pressures
different individuals survive and reproduce and pass on their alleles in the 2 groups - different change in allele frequency
gene pools become so different that they become separate gene pools - individuals cannot interbreed to produce fertile offspring
whats genetic drift
greater change in allele frequency will occur more quickly in small populations due to lower genetic diversity so allele frequency will be higher so passed on more quickly therefore mutant allele will have greater impact
when do you use t test and whats the degrees of freedom?
use when comparing means of 2 sets of data to see if difference in mean is significant
no in sample 1 + no in sample 2 -2
when do you use spearmans rank test and whats the degrees of freedom?
use when looking at correlation (can be plotted on scatter graph) between 2 variables and see if significant
no of pairs of data - 2
when do you use chi square test and whats the degrees of freedom?
when comparing observed and expected results when data is in categories and use raw data to see if there’s a significant difference
no of categories -1
how do you start a null hypothesis?
there is no significant [difference/correlation] between..
what do you use degrees of freedom for?
to tell you which row of the critical value table to look at which will give you a p value to compare to your calculated test value
what are the different levels of significance for the different p values
p value less than or equal to p=0.05 → significant difference/correlation
p value less than or equal to p=0.01 → very significant
p value less than or equal to p=0.001 → highly significant
p value more than p=0.05 → no significance
how do you compare critical and test value to eg if the calculated value is bigger than the critical value at p=0.05
there is less than 0.05 probability that the difference/correlation [..] is due to chance. there is a significant difference/correlation therefore reject null hypothesis. then finally make specific to investigation eg so the drug does reduce blood pressure