APHUG - Unit 2 - Population and Migration Patterns and Processes
1/31
There's no tags or description
Looks like no tags are added yet.
Name | Mastery | Learn | Test | Matching | Spaced | Call with Kai |
|---|
No analytics yet
Send a link to your students to track their progress
32 Terms
Physical factors
Natural elements that influence human behavior, settlement patterns, and migration
Ex. climate, landforms, water bodies
Human factors
The various social, cultural, economic, and political elements that influence the behavior and decision-making of individuals and groups within a population
Ex. cultural norms, economic opportunities, history, political stability
Arithmetic density
Number of people per land area
Can be misleading because it treats all land equally, failing to distinguish between arable land, deserts, or urban areas
High density: lot of people, little land (ex. India, Bangladesh, Japan)
Low density: little people, lots of land (ex. Canada, Greenland, Australia)
Physiological density
Number of people supported by a unit of arable land
Shows how many people are relying on a certain area of land —> more reflective of population pressure on arable land
High density: lot of people, little arable land (ex. Singapore, Hong Kong, Egypt) great pressure to produce enough food, more stress on land
Low density: less people, lot of arable land (ex. Canada, USA)
Agricultural density
Ratio of the number of farmers to the amount of arable land
Measures agricultural efficiency
High density: lot of farmers for available farmland; suggests labor-intensive, subsistence farming (ex. Egypt, Bangladesh)
Low density: lot of farmland, little farmers; indicates industrialized, machine-based farming (ex. US, Canada, Western Europe)
Carrying capacity
The maximum, sustainable population size an environment can support indefinitely without environmental degradation
Little correlation between population density…
…and economic development (ex. Bangladesh and Japan have similar population densities but Japan has a much higher GDP per capita)
Greater intellectual capital
Rising population leads to greater chance society will produce entrepreneurs and innovators
Improved technology and business
Helps improve living standards
Environmental concerns
Global warming, deforestation, decreasing biodiversity
Green-belt land
A policy and land-use designation
Used in planning to retain areas of largely undeveloped, wild, or agricultural land surrounding or neighbouring urban areas
It is a critical tool for managing urban growth, sustainability, and land-use patterns
Ex. farmland, forests, natural habitats
Population pyramids
Graphical illustration showing the distribution of various age groups divided by gender
Used to assess population growth and decline
Predict markets for goods and services
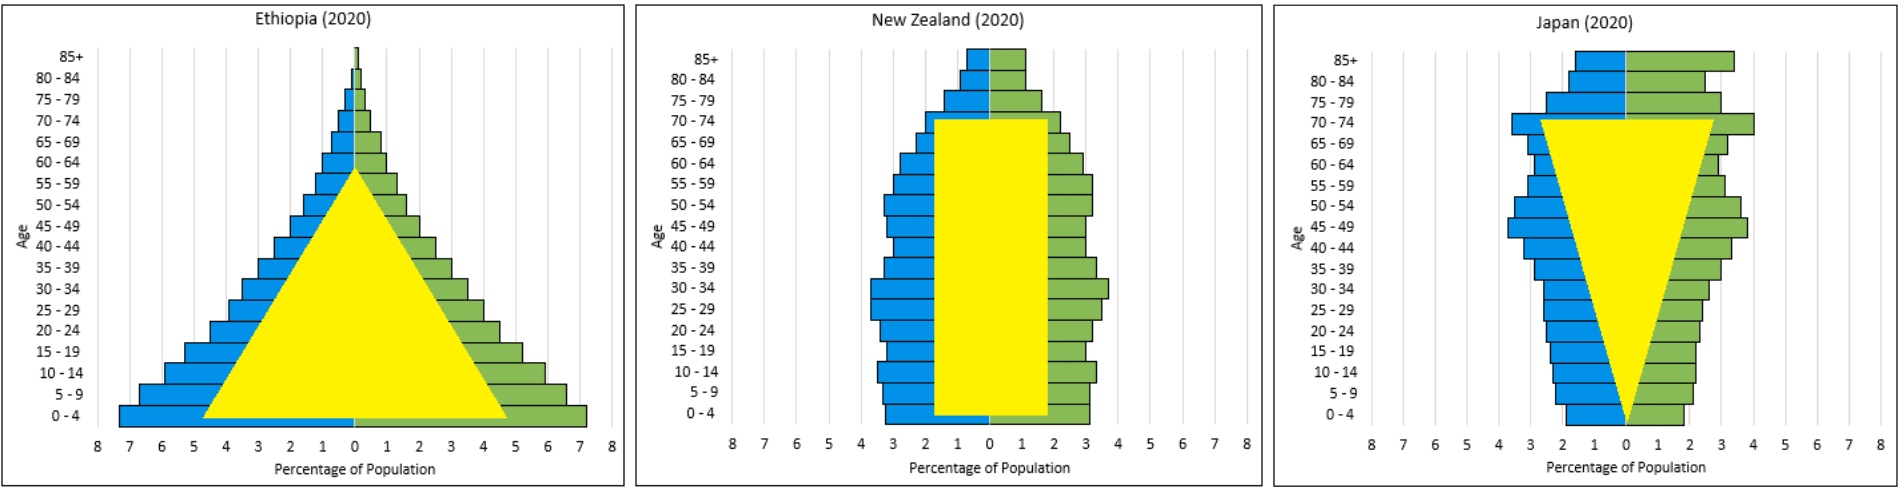
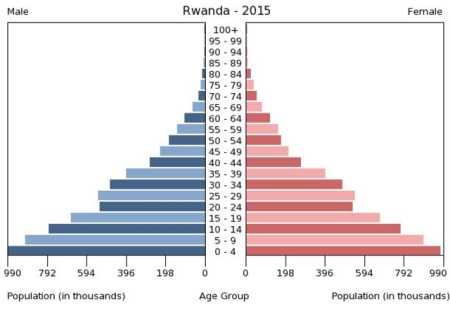
Expanding expansive
Wide base
Birth rates are high —> many children and young people
People are dying earlier, but rapid population growth
Stage 2
Developing country
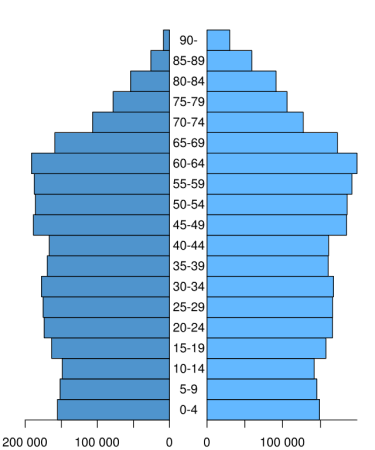
Stable stationary
Slow growth
Birth rate is constant
Future: graying population —> many old dependents
Strain on resources to fund elderly care, people will have to be in workforce longer
May need more immigrants to provide labour
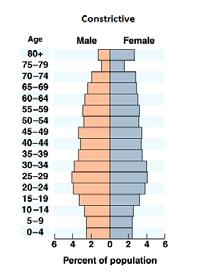
Declining constrictive
Low birth rate
Small numbers of young people
Graying population —> large number of dependents
Stage 4/Stage 5, developed countries
Decline in growth —> encouraging migration or pro-natalist policies
Total Fertility Rate (TFR)
The average number of children per woman
A TFR of about 2.1 is generally considered necessary for a population to replace itself in developed countries, taking into account mortality rates
Mortality rate
The number of deaths per 1000 individuals
Migration
The movement of people from one place to another with the intention of settling temporarily or permanently in a new location
Economic opportunities, environmental conditions, and social dynamics
Natural Increase Rate (NIR)
Percentage by which a population grows in a year
EXCLUDES MIGRATION
CDR - CBR
Doubling time
The number of years needed to double a population, assuming a constant rate of natural increase
Factors that influence birth rate
Technology (birth control methods, etc.)
Social (more wealth and leisure time, education, etc.)
Cultural (birth control methods, more women in the workforce, etc.)
Economic (costs of supporting a bigger family in MDCs, more children is better for tending to farms and agriculture in LDCs, etc.)
Government policies (China’s one child policy, etc.)
Factors that influence mortality rate
Increased food supplies and distribution
Better nutrition
Improvements in medical and public health technology (immunizations, antibiotics, etc.)
Improved sanitation and personal hygiene
Safer water supplies
Factors that influence migration
Age, sex, marital status, education, occupation, employment
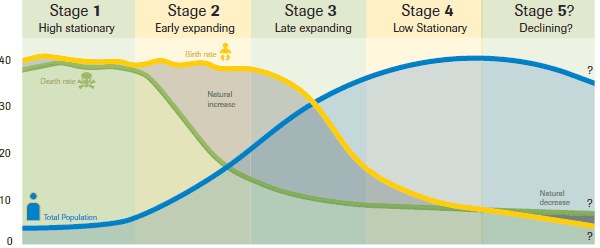
The demographic transition model
Stage 1: high birth rate and high death rate, NIR is close to zero, pre-industrial and least developed
Stage 2: high birth rate, declining death rate (modern medicine, sanitation, vaccinations, and improved nutrition), NIR is very high (Niger, Democratic Republic of the Congo, Somalia)
Stage 3: birth rate goes down, death rate remains low, population continues to grow slower, women gain education and access to contraception, costs of living rise, reduced child labour, increased family planning
Stage 4: low birth rate, low death rate, strong contraceptive use, high female education, expensive childcare, NIR is close to zero, the wealthy and urbanized world
Stage 5: both very low, CBR may drop below CDR, extremely low fertility rates and aging populations, promote pro-natalist policies, incentivize childbirth
Agricultural revolution
More food, sustain a bigger population, steady growth, high birth rates
Industrial revolution
More wealth —> more food, more money spent on sanitary conditions, CDR decreases
Medical revolution
Diffusion of medical technologies lower death rate in LDCs
African countries: CBR remains high but CDR decreases
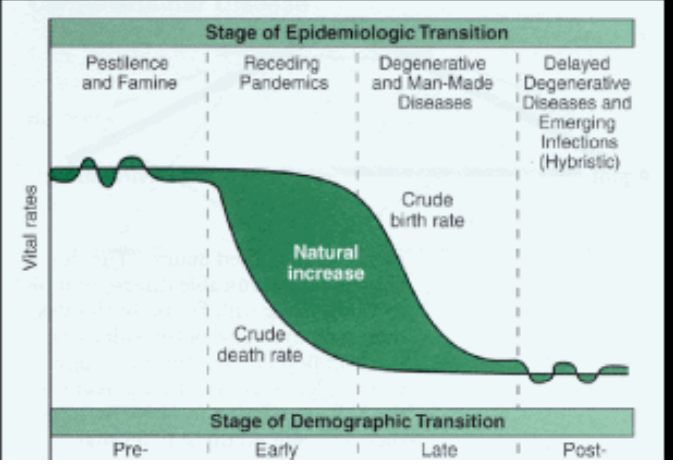
Epidemiological Transition Model
Explains causes of changing death rates
The age of pestilence and famine, the age of receding pandemics, the age of degenerative diseases, and the age of delayed degenerative diseases
Stage 1: The Age of Pestilence and Famine: Mortality is high and fluctuating, causing low population growth. Primary causes of death are infectious diseases, plagues, and famine (e.g., Black Plague).
Stage 2: The Age of Receding Pandemics: Mortality drops rapidly as pandemics become less frequent due to improved sanitation, nutrition, and medicine. Population growth is sustained (e.g., Industrial Revolution).
Stage 3: The Age of Degenerative and Man-Made Diseases: Mortality continues to decline but at a slower rate. Infectious diseases decrease, while chronic, lifestyle-related diseases (e.g., heart disease, cancer) become the primary causes of death.
Stage 4: The Age of Delayed Degenerative Diseases: Mortality is low, and life expectancy peaks. Cardiovascular diseases and cancers are delayed to older ages due to advanced medical technology and better lifestyles.
Stage 5 (Proposed/Modern): The Age of Re-emergence: Some argue for a fifth stage where infectious diseases, previously controlled, return due to antibiotic resistance, urbanization, and rapid global travel.
Malthusian Theory
Population growth (exponential/geometric) will outpace food production (linear/arithmetic)
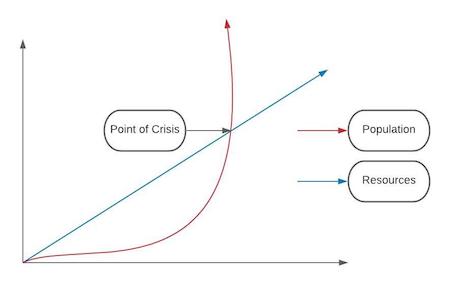
Neo-Malthusians Arguments
Believe population growth is worse than Malthus predicted
Failed to anticipate that poor countries wood have the most rapid population growth because of the transfer of medical technologies (but not wealth) from MDCs
Gap between population growth and resources
Population growth outpaced economic development
Critics of Malthusian Arguments
Population growth is not a problem
World’s supply of resources is not fixed
Human action and new technology can expand the supply of food and resources
More people —> more chance to invent good ideas for improving life
Poverty, hunger, and social welfare problems are a result of unjust social and economic problems
Pro-natalist
Encouraging the bearing of children
Government support of a higher birthrate
Ex. financial incentives, tax breaks, “sex day” in RussiaA
Anti-natalist
Policies aimed at reducing the number of children per family
Effort to curb serious overpopulation concerns and heavy strain on national resources
Ex. education on family planning, increase access to contraceptives by law, China’s One Child Policy