AS 332 Exam 4
1/66
There's no tags or description
Looks like no tags are added yet.
Name | Mastery | Learn | Test | Matching | Spaced |
|---|
No study sessions yet.
67 Terms
Heritability can be estimated by the ____ between genetic values and phenotypes
squared correlation, regression
Repeatbility can be measured by the ___ between producing abilities and phenotypes
squared correlation, regression
Heritability ccan be definaed as ratio of what two variance components?
heritability = BV variance/Phenotype variance
Repeatability can be defined as a ratio of what two variance components
repeatability = PA variance/Phenotype variance
Give an example of a trait with low, moderate, and high heritability
Low - fertility
Moderate - weight
high - carcass
List 2 ways to increase heritability and repeatability. How would this benefit you as a producer?
Measure traits as accurately as possible
Treat animals as uniformly as possible
-increase accuracy of selection and culling decisions
____ contemporary groups provide a better estimate of the group average
Large
What range of value is possible for heritability
0-1
Calculate the ratio of the following calves for birth weight
1 - BW = 80 lbs
2 - BW = 75 lbs
3 - BW = 105 lbs
4 - BW = 95 lbs
5 - BW = 86 lbs
6 - BW = 82 lbs
(Xi/X mean) * 100
Mean = 87.17
1 = (80/87.17) *100 = 91.77%
2 = 86..01%
3 = 120.41%
4 = 108.94%
5 = 98.62%
6 = 94.04%
As a general rule ____ traits have high heritabilities and ____ have low heritabilities
high = carcass
low = survivability, fertility
define contemporary group
group of biologically similar animals raised in the same environment
twinning rate has a hieritability of about 0.10 and loin eye area has a heritability of about 0.50, as measured by ultrasound. If you were selecting only on an individual’s phenotype, which trait vvore accurately estimate breeding values? Why
LEA - phenotype for LEa is a more accurate predictor of LEA breeding values
Define heritability
percentage of phenotype variation explained by differences in breeding values
strength of the relationship between phenotype and breeding value for a trait
what is an important use for heritability
allows you to determine which traits will be improved faster by genetic selection
why does the regression coooefficient increase as the number of records increases
decreasing temporary environmental variation
for traits with repeated records the regression of breeding value on average phenotypic performance is B(BV,P) = (nh²) / 1+(n-1)r. This regression coefficient predicts the change in breeding value given a 1-unit change in phenotype. In this formula, n is the number of performance records, and h² and r is the heritability and repeatability of the trait, respectively. Calculate the regression coefficients for sheep fleece grade and staple length. The repeatability is 0.60 for both traits.
Fleece Grade (h² = 0.35)
Staple length (h² = 0.50)
Number of records = 1, 2, 3, 5, 10
Write a definition of the regression coefficient for staple length (mm: 1 record), including the units
Fleece grade
1 = 0.35
2 = 0.44
3 = 0.48
5 = 0.52
10 = 0.55
Staple Length
1 = 0.50
2 = 0.63
3 = 0.68
5 = 0.74
10 = 0.78
Regression coefficient = We expect a 0.5 mm increase in BV for every 1 mm increase in staple llength phenotype
for traits with repeated records the regression of producing ability on average phenotypic performance is bPA,P = (nr) / 1+ (n-1)r. Thisr regression coefficient predicts the change in producing ability given a 1-unit change in the phenotype. Calculate the regression coefficients for calving interval and milk yield in dairy cattle.
Calving interval (r = 0.15)
Milk yield (r = 0.50)
Numbers = 1, 2, 3, 5, 10
Write a definition of the regression coefficient for milk yield (lbs: 1 record) including the units
Calving interval
1 = 0.15
2 = 0.45
3 = 0.75
5 = 1.35
10 = 2.85
Milk Yield
1 = 0.50
2 = 1.50
3 = 2.50
5 = 4.50
10 = 9.50
Regression coefficient = We expect a 0.5lb increase in BV for every 1lb increase in milk yield phenotype
What is the essential principle involved in the several approaches to increasing heritability and repeatability
Decreasing environmental variation
animal breeders ofttthemical adjustment factors to data to account for “known” environmental effects. A “known” environmental effect is an effect that we can estimate. For example, we can estimate the average weight gain difference between heifers and steersss, so therefore we can “adjust'“ weights for gender of the calf. Why do we use these adjustment factors?
Increases selection accuracy
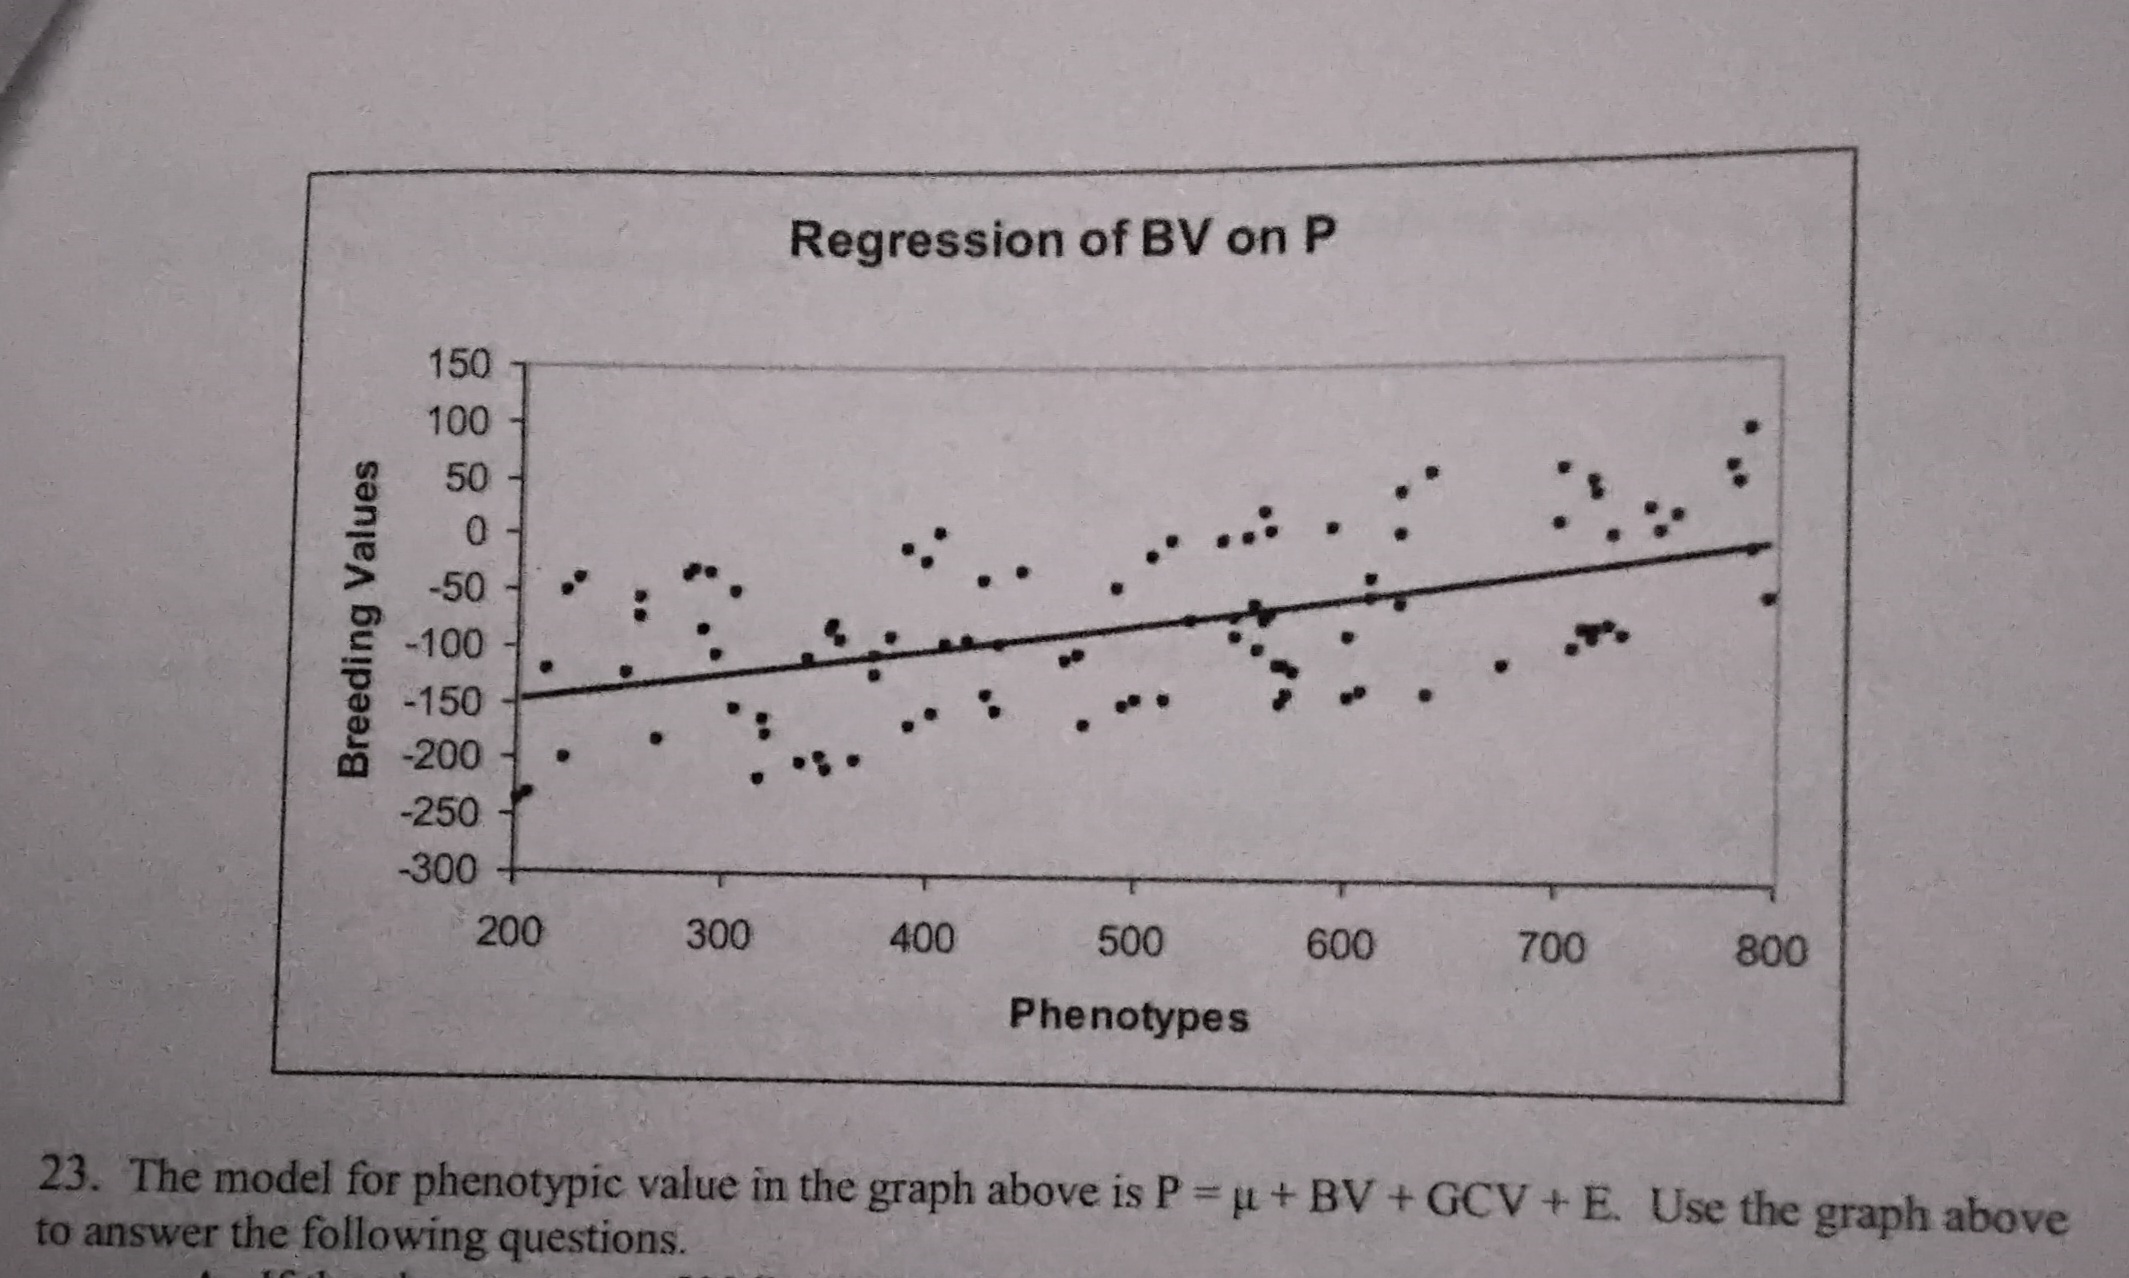
If the phenotype was 500 lbs, approximately what would be the estimated breeding value for this trait?
What is the cause of prediction errors for estimated breeding value? Rephrased, why do the actual breeding values not line up exactly on the regression line
How is heritability depicted in this figure
In what region of the graph are true breeding values under-estimated by the EBV
-75
environmental and GCV
regression
above the line
When defining heritability as a regression coefficient, fill in the missing quantities in the numerator and denominator of the equation:
h² = cov (__ , __) / ___
h² = cov ( P , BV ) / S²P
When defining repeatability as a regression coefficient, fill in the missing quantities in the numerator and denominator of the equation:
r = cov (__ , __) / ___
r = cov ( P , PA ) / S²P
When defining heritability as a correlation coefficient, fill in the missing quantities in the numerator and denominator of the equation:
h² = cov (__ , __) / ___
h² = cov ( BV , P ) / S²BV * S²P
When defining repeatability as a correlation coefficient, fill in the missing quantities in the numerator and denominator of the equation:
r = cov (__ , __) / ___
r = cov ( BV , P ) / S²PA * S²P
explain why heritability for a trait is not constant among different groups of individuals
environment differs among groups of animals
genetics differs among groups of animals
explain why producers should use contemporary groups when possible
increases selection accuracy
why would livestock producers calculate ratios of trait values
ratios help breeders quickly identify above and below average animals for a trait
why data on all of producers animals should be reported to breed associations
the reported animals will receive worse genetic evaluations
increased overall selection accuracy for the breed
what are the four factors that affect rates of genetic gain in a herd or breed
selection intensity, selection risk, genetic variation, generation interval
What does the equation estimate
rBV, BVi oBV
rate of genetic change
why is the two path version of the genetic change equation usually more appropriate than the one path version
often males and females differ in selection accuracy, selection intensity, and generation interval
what quantity in the genetic change equation is measured by the correlation between true breeding values and estimated breeding values
selection risk
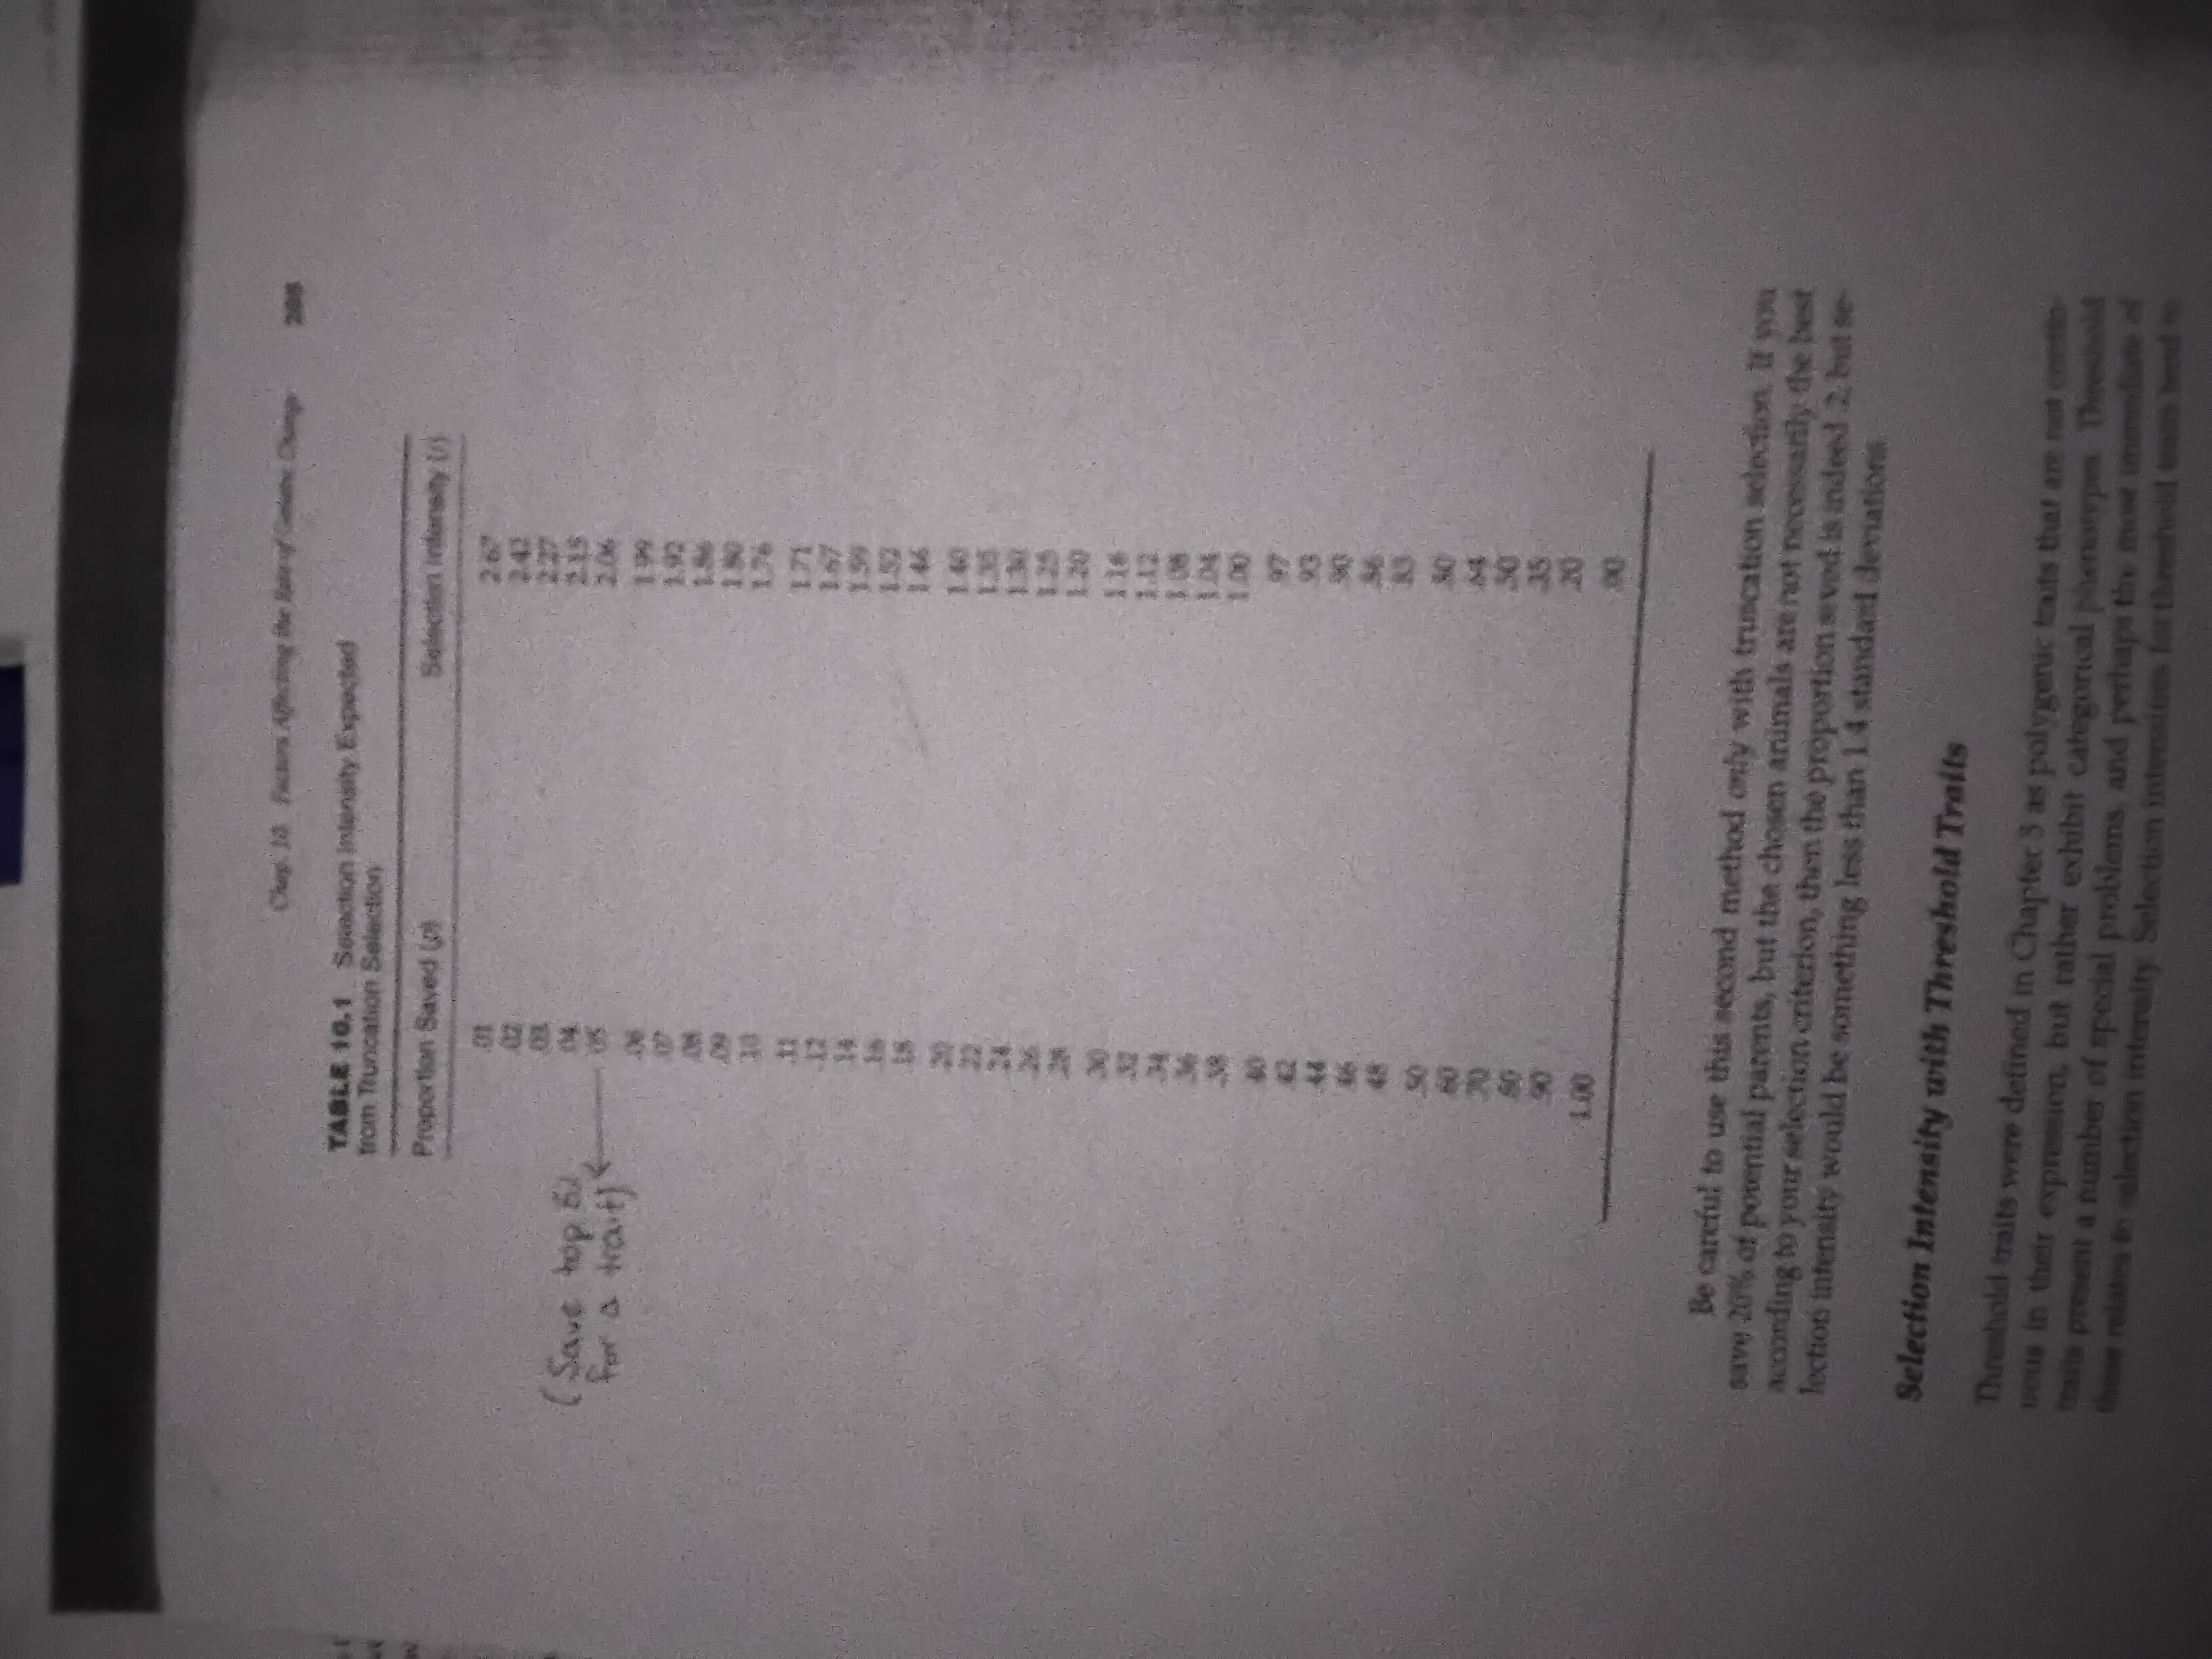
with truncation selection, the selection intensity can be found in a table. what piece of information is needed to find the appropriate selection intensity in the table
proportion saved
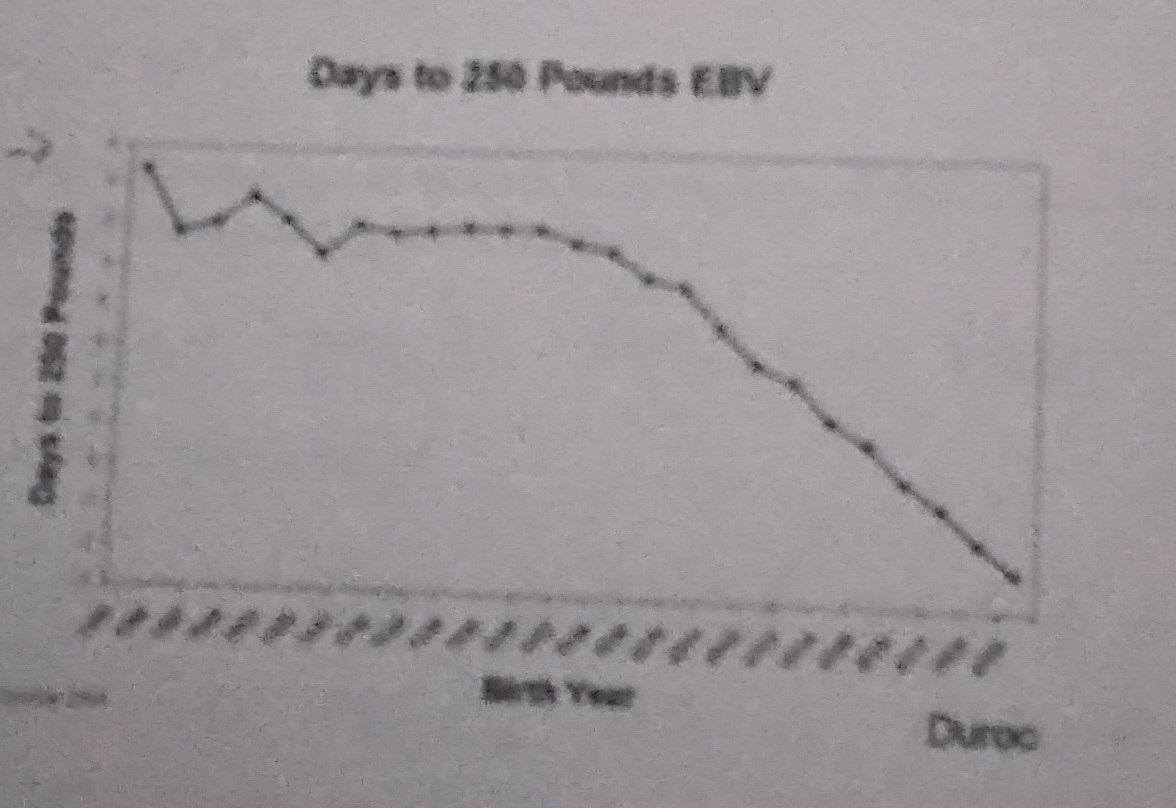
Interpret the genetic trend graph below. Does the Duroc breed appear to be making genetic progress for days to 250 pounds?
Yes - decline = less days to match weight (250 lbs)
adjustment factors increase rate of genetic change by increasing selection ____
accuracy
give a practical example in the livestock industry of high selection intensity vs low selection intensity
high - top 5% of sires for a trait
low - ignoring a trait when selecting animals
give a practical example in the livestock industry of high selection accuracy vs low selection accuracy
high - proven sire
low - young sire
give a practical example in the livestock industry of large genetic variation vs small genetic variation
large - herd with mix of breed compositions
small - inbred or linebred herd
give a practical example in the livestock industry of a small generation interval vs a large generation interval
large - cattle
small - chickens
in terms of the rate of genetic change equation discuss the typical differences between males and females relative to accuracy, intensity, and generation interval
selection accuracy - males often have more offspring than females
selection intensity - fewer males are often needed and I can select more intensely on males as a result
generation interval - often differ between males and females
list two trade-offs of the rate of genetic change equation and why they are important
increased selection accuracy often leads to increased generation intervals
increasing female selection intensity often leads to increased generation intervals
what is the expected rate of genetic gain for yearling weight in a beef cattle herd with the following characteristics and selection policies? assume the phenotypic standard deviation for yearling weight is 60 lbs and heritability is 0.40. animals will be selected on their own yeling weight only with adjustments recommended by the BIF. sires will be selected as yearlings and selected bulls will be the best one of every 20 bulls weighed. Dams will be selected as yearligs and used 4 seasons. Selected cowswill be the best one of every 5 yearling females weighed
generation interval (L)
males - 2 year
females - 4 year
accuracy
males -
females -
intensity
males -
females -
expected yearling increase in BV -
generation interval (L)
males - 2 year
females - 4 year
accuracy
males - 0.63
females - 0.63
intensity
males - 2.06 (1/20 - table)
females -1.40 (1/5 - table)
expected yearling increase in BV - 13.84 lbs/year ((0.40(2.06+1.40)60)/(2/4)
r = sq rt .4 = 0.63
a rancher runs a closed herd of breeding cattle. he norally keeps ad breeds the top 3% of his bull calves based on individual preformance for yearling weight (YW). his sires average three years of age when their offspring are born. he is trying to decide between two female replacement strategies:
saving the top 20% of his heifers based on YW (L = 6 years)
saving the top 60% of his heifers based on YW (L = 3 yeras)
If h² = 0.4 and oP(YW)= 50 lb, calculate the expected rate of genetic change in YW for each strategy
which strategy would you choose and why
which elements of the key equation is the rancher experimenting with
a. 20% = 0.4(2.27+1.40)50/(3+6) = 8.16 lb /yr
b. 60% = 0.4(2.27+0.64)50/(3+3) = 9.70 lb / yr
2 - faster genetic change
female selection intensity and female generation interval
What is the expected rate of genetic gain for days to 280 lbs with the following characteristics and selection polices? Assume that the standard deviation of breeding values is 6 days and that accuracy of selection is 0.32 for females and 0.60 for boars. The average number of days to reach 280 lbs is 180 days. Selected boars reached 280 lbs at an average of 175 days. Selected females reached 280 lbs at an average of 178 das. The phenotypic standard deviation for this trait is 12 days. Complete the following table
generation interval (L)
males - 2 year
females - 3 year
intensity
males -
females -
expected change in BV for days to 280 lbs per year -
generation interval (L)
males - 2 year
females - 3 year
intensity
males - 0.42
females -0.17
expected number born alive increase in BV per year - 0.37 days/yr
Im = |(175-180)/12| = 0.42
If = |(178-190)/12| = 0.17
(0.60×0.42+0.32×0.17)6 / (3+2) = 0.367 days/yr
list three ways that can be used to increase accuracy of a breeding value
increase number of progeny records
increase h²
DNA test
What are 2 general methods for predicting breeding values
selection index
best linear unbiased prediction
what does it mean when we say the EBV is an unbiased estimate of true breeding value
as we collect more data, the EBV is equally likely to increase or decrease
BLUP and selection index are 2 methods for estimating breeding values from phenotypic data
which method is used by breed associations
why
best linear unbiased prediction
accounts for genetic trends, accounts for culling for poor performance, accounts for non-random mating
accuracy of an EBV (or EPD) can be defined as a measure of ____ taken by breeders and producers
selection risk
accuracy of EBV based on progeny performance can reach close to 100% regardless of a trait’s heritability, but accuracy of EBV based on an individual’sss own performance may only reach 30 to 70% depending on heritabiliity. Why?
An individual’s own phenotype is affected by its BV, GCV, and Ep. No matter how many records of own performance we collect, GCV and Ep never go away, preventing us from reaching 100% accuracy.
Each individual progeny record is also affected by GCV and E, along with dam and Mendelian Sampling effects. However, if we collect a large number of offspring records on an animal, all of these effects start to cancel each other out, leaving only ½ * BV of the parent. Accuracy can now reach close to 100%
in the procdures for calculating EBV, what is meant by “regression for the amount of information”
when accuracy of an EBV is low, the EBVs are regressed closer to the mean EBV in the breed
A commercial cow-calf producer wishes to calculate within-herd weaning weight EPDs for 2 of his or her herd bulls. The senior herd sire “Sure Thing “ has sired four calf crops, and his 80 progeny average 10 pounds heavier than their contemporary group mates. he also purchased a yearling bull “Long Shot” with no progeny, but who (himself) weighed 40 pounds heavier than his contemporary gropu average. Assume heritability of weaning weight is 0.30
calculate weaning weight EPD and accuracy of Sure Thing
calculate weaning weight EPD and accuracy of Long Shot
Which sire would you expect to sire the heaviest calves in the future
b = (2(80)(0.3)) / (4+(80-1)*0.3) = 48 / 27.7 = 1.73
EBV = 1.73 × 10 = 17.3 lbs
EPD = ½ * 17.3 lbs = 8.65 lbs
Accuracy = sq rt ((80×0.3) / (4+(80-1)*0.3)) = 0.93
b = 0.3
EBV = 0.3 × 40 = 12 lbs
EPD = ½ * 12 lbs = 6 lbs
Accuracy = sq rt (0.3) = 0.55
Sure thing - Better EPD
The EPDs for yearling weight for 2 bulls are 115 lbs for Trendsetter and 75 lbs for Desperado
by itself, whaat does the fact that Trendsetter has an EPd = 115 lbs mean
how much heavier should Trendsetter’s progeny be, on average, relative to Desperao’s progeny
nothing
40 lbs
what is one strategy a producer could use to mitigate selection risk when using young sires (or sires with lowly acccurate breeding values)
use more young sires
in large-scale genetic evaluations, what is the base
0
why are large scale genetic evaluations more often focused on sire summaries than on dam summaries
sires often produce more offspring over their lifetimes than dams
a bull has a milk EPD = +30 lbs and a weaning weight EPD = +47 lbs. the milk EPD is the maternal effect on weaning weight and weaning weight EPD is the direct effect on weaning weight. what is this bull’s total maternal EPD for weaning weight
30 + (1/2 × 47) = 53.5 lbs
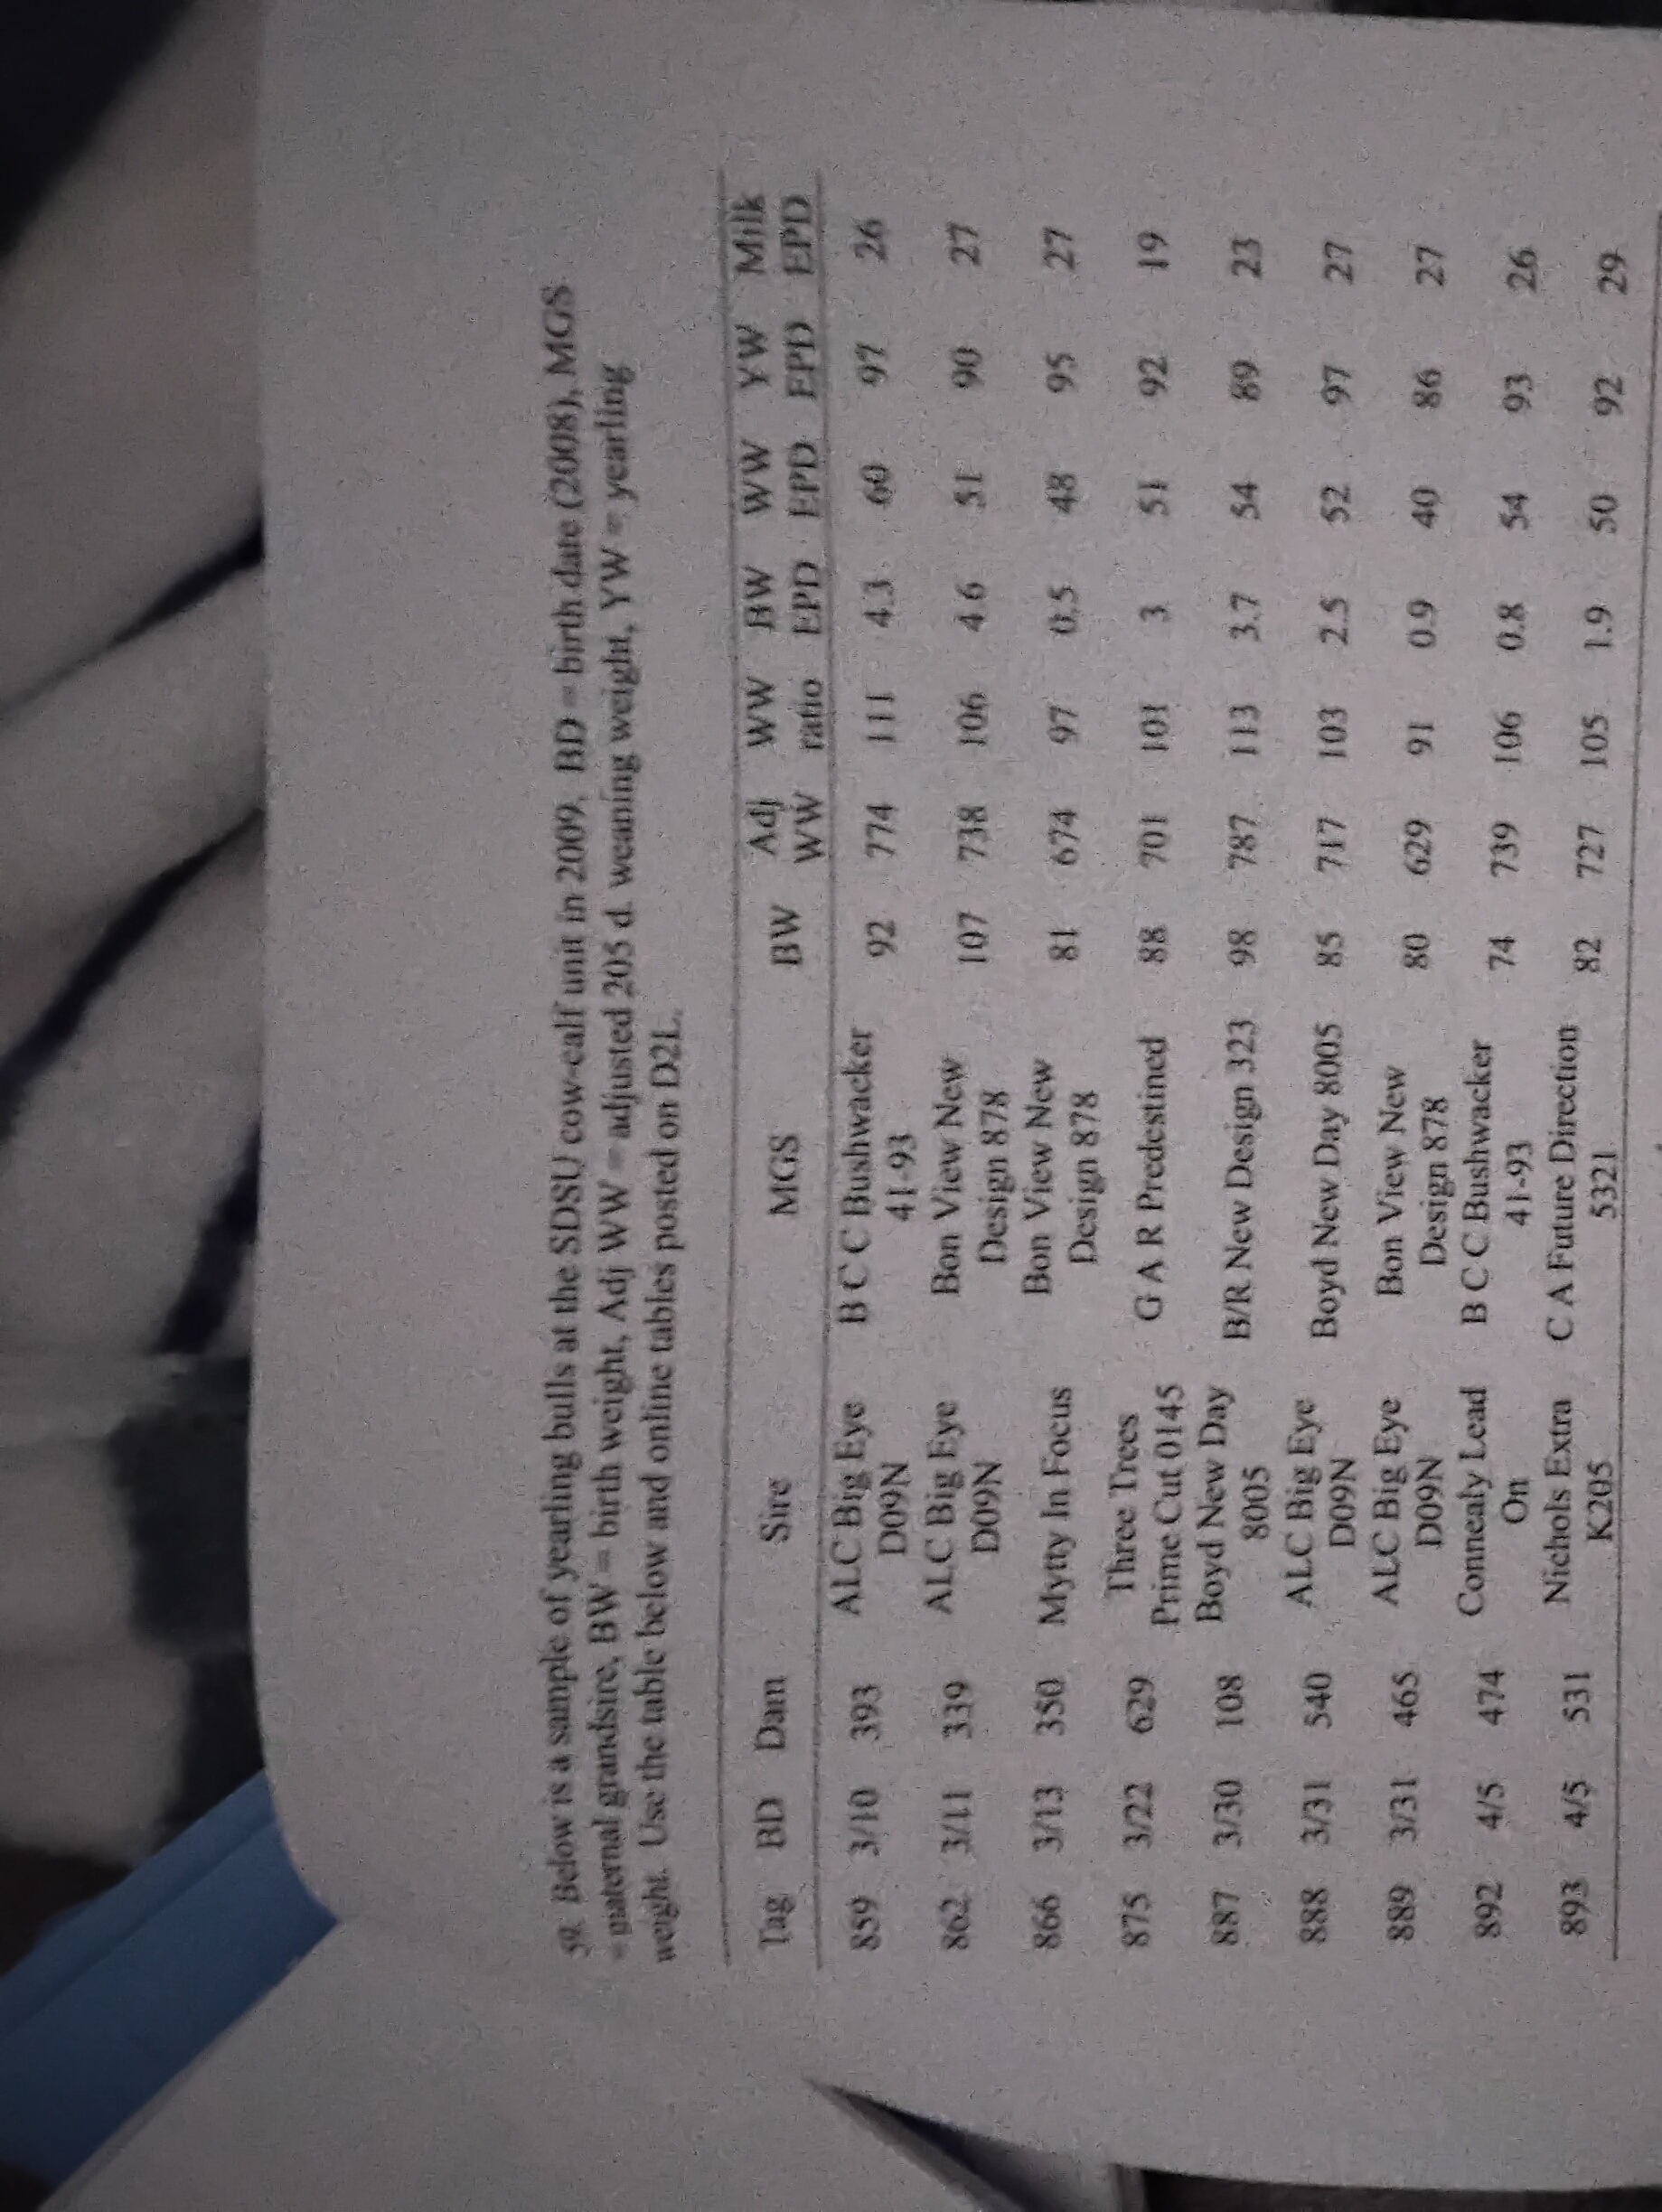
yearling bulls are the SDSU cow-calf unit in 2009. BD = birth date. MGS = maternal grandsire, BW = birth weight, adh WW = adjusted 205 d weaning weight, YW = yearling weight
the progeny of 888 is xpected to be ____ lbs heavier than progeny sires by 889
which bulls have below average 205 d weaning weights for this herd
bull 887 has the highest adjusted 205 d weaning weight, but bull 859 has the highest weaning weight EPD. why would 887 have a smaller weaning weight EPD
which bulls would you select if you were only interested in purchasing 3b ulls based on weaning weight? why
1.6
866, 889
environment, gene combination value
859, 887, 892 - highest WW EPD
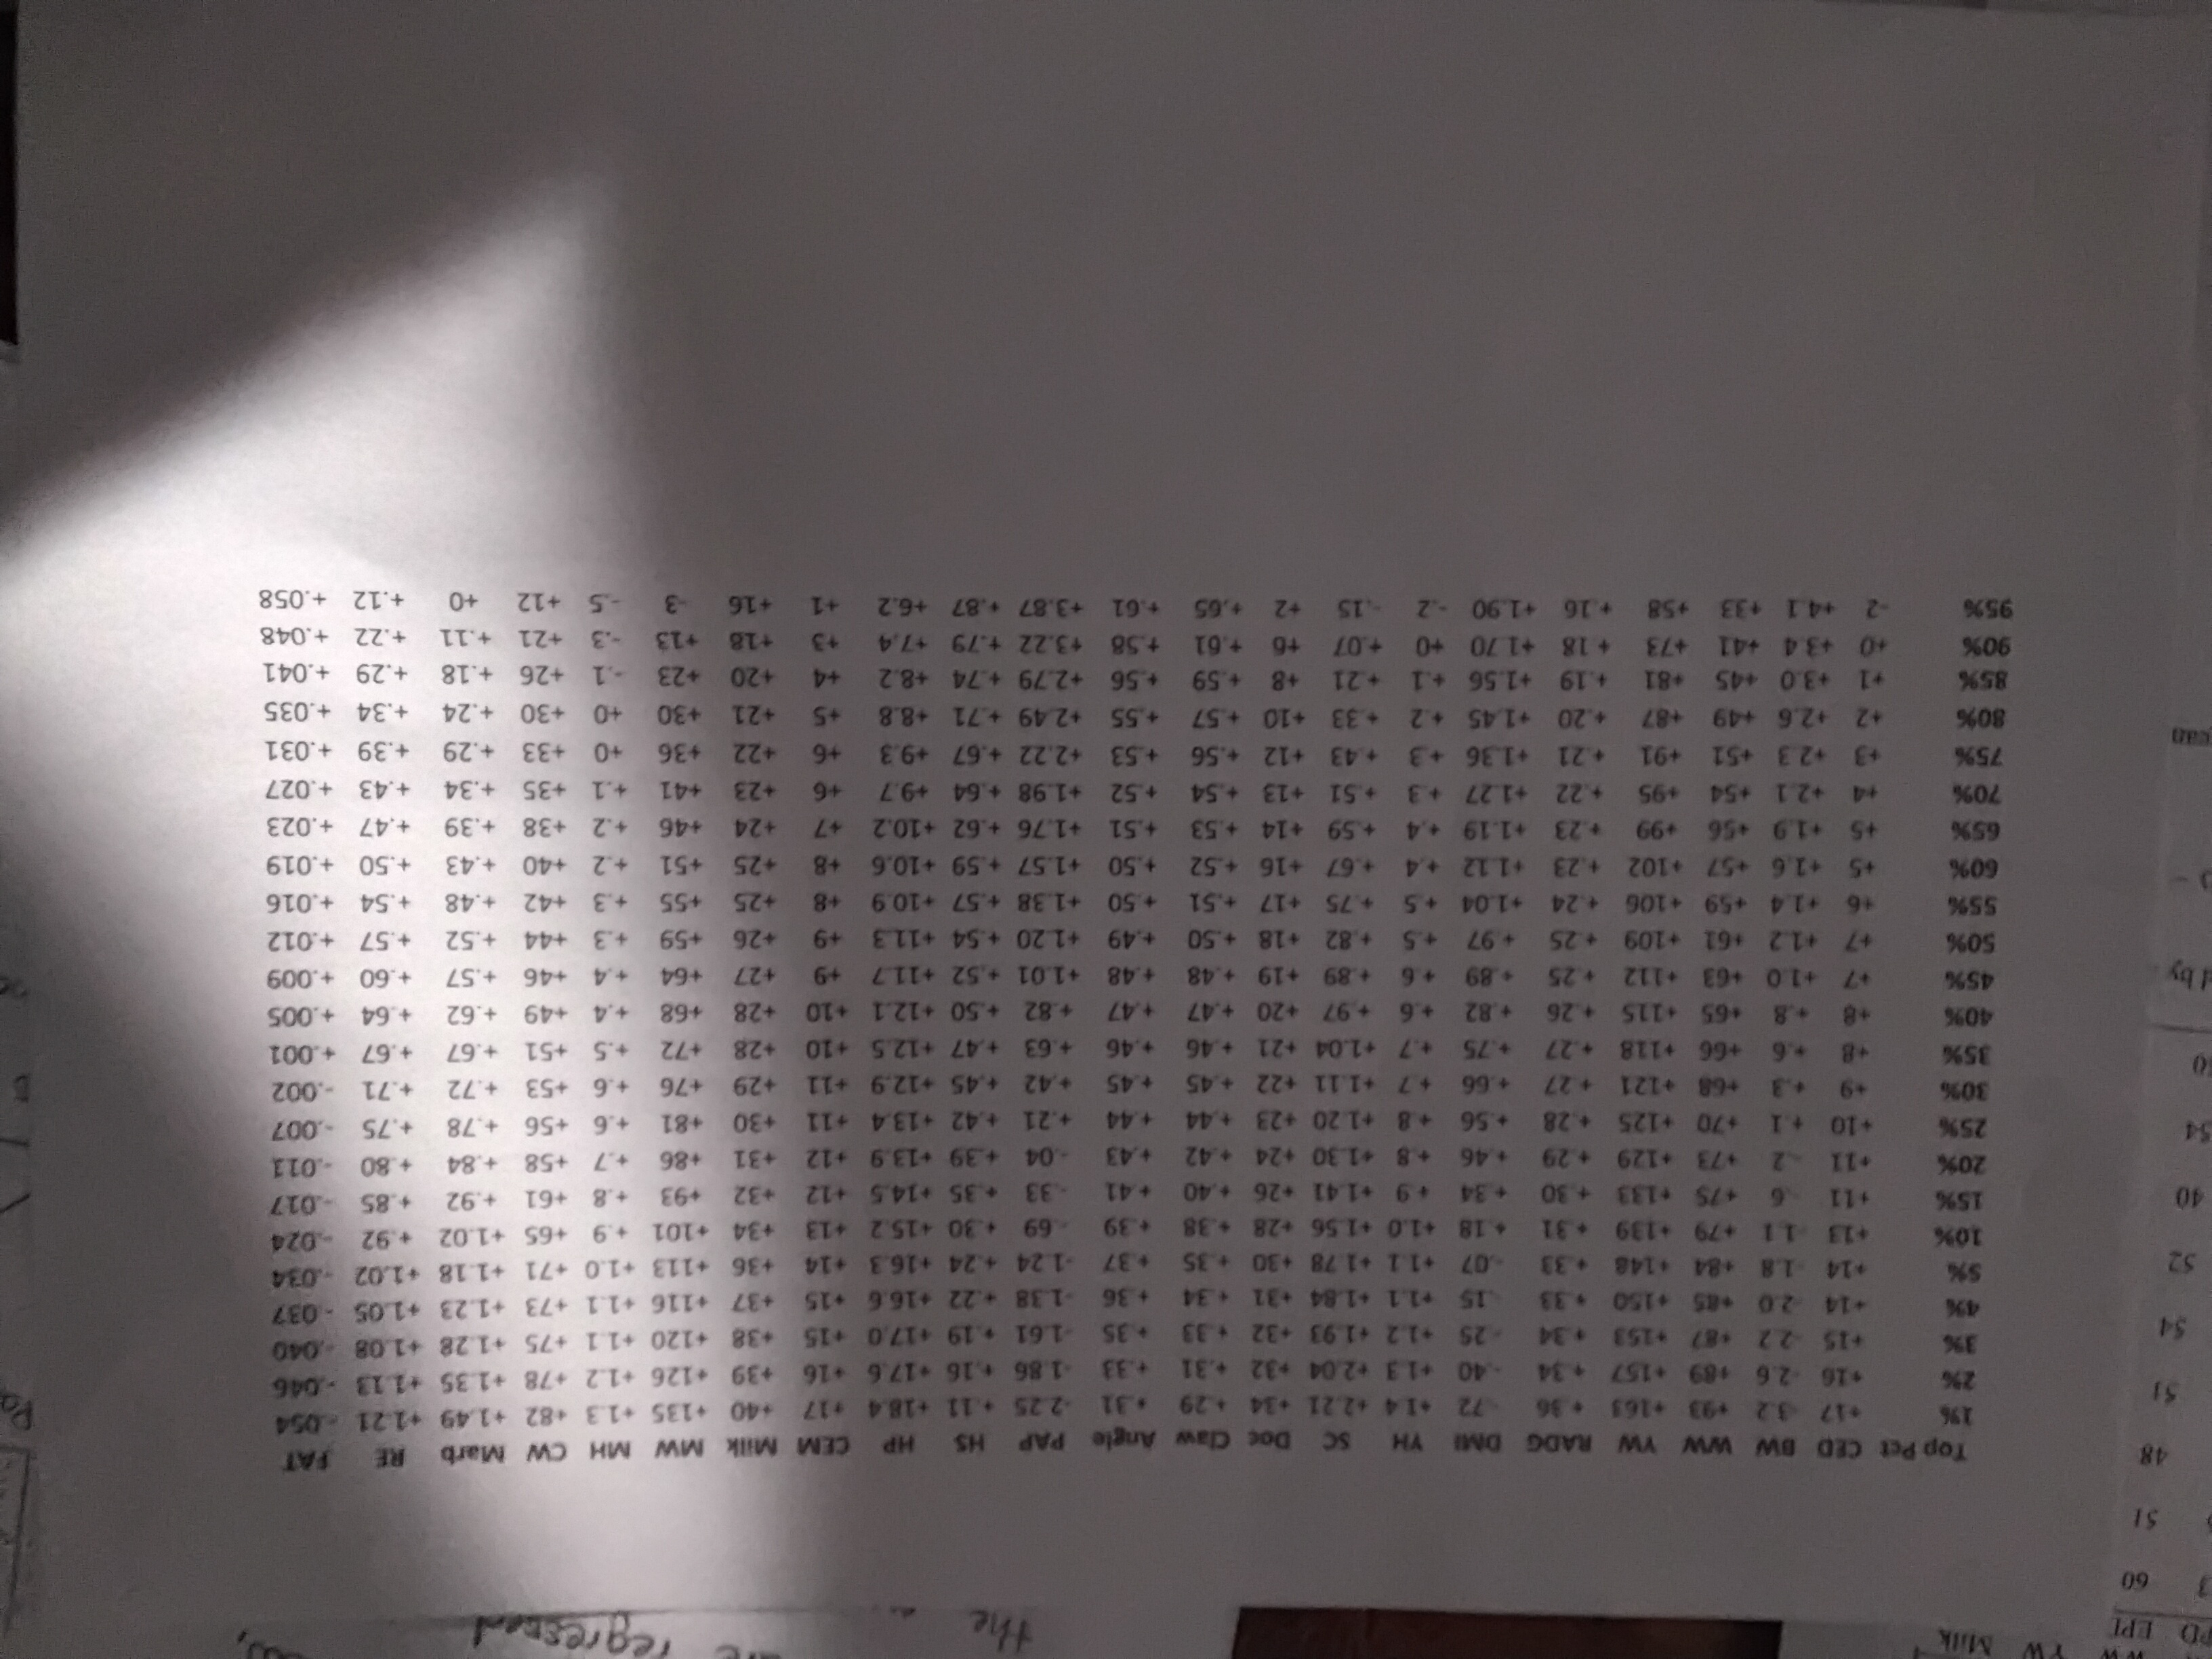
what % of current angus sires have a milk EPD higher than bull 859? (Milk EPD = 26)
45%

Is bull 875 above or below the average yearling weight EPD for current sires in the angus breed (YW EPD = 92)
below average
The weaning weight EPD for a SimAngus bull is 33 lbs. What is wrong with the following statement
The angus bull 889 is expected to produce progeny at weaning that weigh 7 lbs heaiver, on average, than the SimAngus bull
Cannot directly compare EPDs across breeds
Fintry of Graham has a calving ease direct EPD = +4%, and the accuracy of this EPD = 0.50. therefore, we have 68% confidence that Graham’s true calving ease direct PD is between ____ % and ____ %
-1.1 - 9.1
a bull’s 68% confidence range for weaning weight EPD is +30 lbs and + 50 lbs. what does this mean
we are 68% confident that this bull’s true progeny difference for WW is between 30 and 50 lbs
if Graham’s 68% confidence range for calving ease direct is larger than Midland Empire’s 68% confidence range for the same trait, what does this mean
Graham’s EPD has a lower accuracy than Midland Empire’s EPD
the dairy industry reports accuracies of predicted transmitting abilities as _______ which are different from accuracy values reported in other species but should be interpreted similarly
reliabilitiy
T/F - progeny from a sire with a lowly accurate birth weight EPD will not have more variable bith weights than progeny from a sire with a higly accurae birth weight EPD
False
Choose 3 EPDs and explain what is being measured. Make sure to include the econoomic relevenace of the trait.
Calving Ease Direct - Difference in percent of calves born unassisted to heifers - producers with first calf heifers
Docility - difference in cattle temperament - raising seedstock cattle or cattle that will be around old or young people - you want cattle with favorable temperaments
Marbling - difference in percent of intramuscular fat - raising terminal cattle, higher marbling scores can get you more money if sold on a grid