Geography: Core units 1, 2 & 3
1/225
Earn XP
Description and Tags
Name | Mastery | Learn | Test | Matching | Spaced | Call with Kai | Chat |
|---|
No analytics yet
Send a link to your students to track their progress
226 Terms
factors affecting population distribution
Relief - how high/low the land is
Climate - the temperature and weather aspects of the land
Population distribution
the spread and pattern of where people live
Population density
the measurement of the number of people in an area (usually measured in people per square km)
Scales
Global
National
Regional
Local
Factors that influence population density
Physical - relief, climate, resources
Human - political, social, economic
M/LEDC
More/Less Economically Developed Country
H/M/LIC
High/Medium/Low Income Country
NIC
Newly Industrialised Country
BRIC
Brazil, Russia, India, China - rising economic powers
MINT
Mexico, Indonesia, Nigeria, Turkey - countries with potential for rapid economic growth
CIVETS
Colombia, Indonesia, Vietnam, Egypt, Turkey, South Africa - countries with markets associated with rapid development and growth
Next 11
Bangladesh, Egypt, Indonesia, Iran, Mexico, Nigeria, Pakistan, the Philippines, Turkey, South Korea, Vietnam - could become world’s largest economies
CPE
Centrally Planned Economy
RIC
Recently Industrialising Country
Market Economy
An economic system where prices are made with no rules or restricted competition
Core-Periphery theory
Explains regional inequalities by suggesting that core regions accumulate economic wealth and resources, while periphery regions experience a lack of investment and development
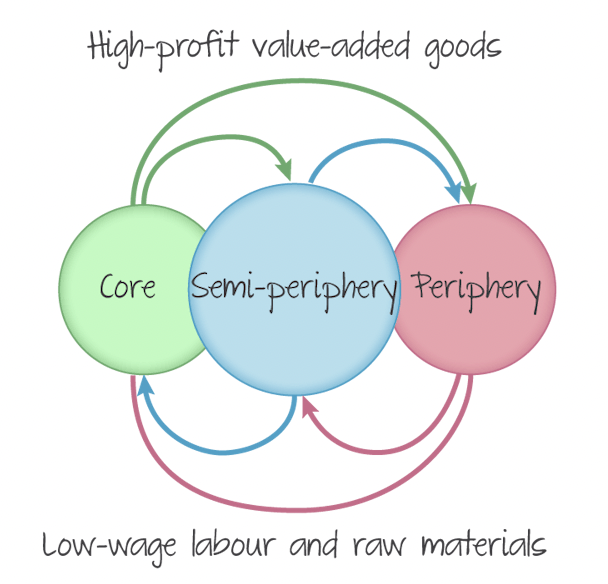
Cores are characterised by
major world powers and the countries that contain much of the wealth of the planet.
Access to health care, education and technology
Water, food, energy security
high literacy rates, skill levels and foreign direct investment
distributes wealth to other regions to promote development
exports manufactured goods and services to other regions
Peripheries are characterised by
countries that are not reaping the benefits of global wealth and globalisation.
lesser developed infrastructure, technology, transportation, etc.
lower literacy, skill and standard of living levels
high poverty levels
lack of job opportunities that lead to migration
resources moving from the periphery to the core to support industrial growth
water, food, energy insecurity
Semi-periphery
some of the characteristics of core and peripheral countries.
industrialised
contribute to manufacturing and exportation of goods
above average land mass
Friedmann’s Theory
Argued that beneficial effects will spread from the core to the periphery
Backwash
rural populations migrating to core countries - effects the development of peripheries
Migration
the movement of people, involving permanent change of residence
Emigration
when someone leaves a country or place
Immigration
when someones enters a country or place
Asylum seeker
someone forced to migrate and is seeking protection from persecution or human rights violation
Refugee
someone who is forced to migrate but they have a recognised status and already have asylum
Political migration push factors
corruption
retaliation
taxes spent poorly
collapsed government
strict laws (against human rights)
dictatorship
Political migration pull factors
high government satisfaction
taxes spent well
gender equality
stable democracy
tolerance for LGBTQ+
Demographic transition
change in population
crude birth rate
the number of live births occurring during the year per 1000 population
crude death rate
the number of deaths occurring per the year per 1000 population
natural increase formula
crude birth rate - crude death rate
fertility rate
the average number of children that would be born alive to a woman during her lifetime
population projection
the prediction of future populations based on present age-gender structure, and with present rates of fertility, mortality and migrations
replacement level fertility
fertility rate that replaces population
population momentum
tendency for population growth to continue beyond the time that replacement level fertility has achieved because of a relatively high concentration of people in the child bearing years
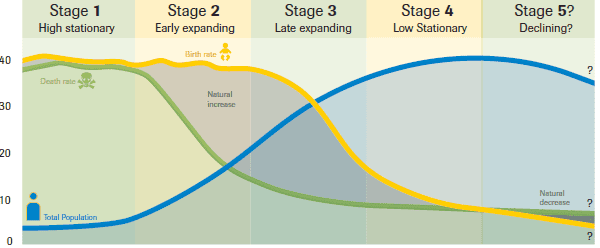
demographic transition model
natural change
difference between the birth rate and death rate
natural increase
when the number of births is higher than the number of deaths
natural decrease
when the number of births is lower than the number of deaths
Stage 1 (demographic transition model)
lots of fluctuating
low population
population is increasing very slowly
high birth/death rates
Stage 2 (demographic transition model)
population is growing faster
decreasing death rate
still a high birth rate, but slowly declining
Stage 3 (demographic transition model)
population still increasing, but the rate of increase is slowing down
decreasing birth rate
low death rate
Stage 4 (demographic transition model)
high population
growth starting to plateau (less fast)
low birth rate
low death rate
Stage 5 (demographic transition model)
population growth declining
birth rate lower than death rate
no population momentum anymore
what could be the main driver behind low birth rates
population pyramid
a graph showing the age-sex distribution of a given population
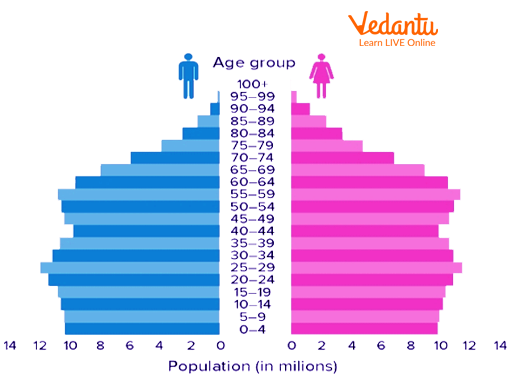
information given by a population pyramid
age and sex structure of a population
birth rates
death rates
immigration and emigration
number of dependents (15>n>65)
life expectancy
population explosion in LEDCs
less access to contraceptives
labour opportunities
growing economy
religion
population decline in MEDCs
more access to contraceptives
independence/liberal
better education (awareness of safe sex)
family planning
dependency ratio
age-population ratio of those typically not working. this ratio is used to measure the financial pressure on the actively working population.
higher ratio = bigger burden on working-age people
lower ratio = more people are working who can support the dependent population
total (age) dependency ratio
population (0-14) + population (64+) x 100
working age population (15-64)
child dependency ratio
population (0-14) x 100
working age population (15-64)
old age dependency ratio
population (64+) x 100
working age population (15-64)
productive population
same as working population
ageing population issues
stress on retirement funds
stress on healthcare sector (doctors, specialisation)
high demand for adequate housing, care, transportation, services, etc.
taxes raised to fulfil demands
ageing population advantages
growing market for leisure and health products
high demand for housing in certain “retirement locations”
a large proportion of ageing people can add experience to work force
how to improve low fertility rates
Promote work-life balance (working from home, flexible working hours, etc.)
Provide direct financial support for families with children
Offer generous and flexible parental leave policies for both mothers and fathers
support population growth
subsidies
social help
adjust laws
youthful population advantages
provides a large and cheap workforce
big working class could be a large base tax and large market
youthful population disadvantages
lack of services and facilities for all young people
strain on food supplies
strain on accommodation
lack of job opportunities in the future
megacity
city with a population of 10 million or more.
attracts people because of:
- work opportunities
- closer services/amenities
- transport
- culture
- family
types of forced migration
conflict-induced displacement
development-induced displacement
disaster-induced displacement
pro-natalist
promoting and advertising more child birth through methods such as:
adverts
billboards
speeches
anti-natalist
being openly against large rates of childbirths
pro natalist policies
subsidies daycare for children
paid parental/maternity leave
tax benefits for families with children
child support/family allowance
anti-natalist policies
encourage use of contraceptives
one child policy
access to education
forced sterilisation or abortion (or banning)
encourage family planning
gender inequality
major barrier to human development. women/girls are discriminated in health, education, political representation, etc. negative consequences for development of their capabilities and freedom of choice
why is there a gender pay gap
physical advantages
social norms from years ago
maternity leave
culture
status/rights of women
quality/length of education
migration
family sizes
legal rights
gender pay gap reduction challenges
unpaid work - women are the dominant carers which doesn’t have economical value
traditional family set up - women are more likely to take maternal leave
national policies - some national policies encourage women to take more leave than their male partners
work culture - male attitudes are favourable to women
human trafficking
illegal transportation and/or exploitation or human parts. It is usually for the purpose of forced labour or sexual exploitation
how to prevent human trafficking
international treaties/policies
victim identification
legal assistance and involvement
provision of immediate protection and support
demographic dividend
the economic growth that may result from changes to a country’s age structure. it refers to a bulge in the number of adults in a population. It occurs when fertility rates decline, which is often followed by a decline in infant & child mortality rates and increase in life expectations
benefits of demographic dividends
labour supply - economy can take in and productively employ more workers
savings - more disposable income which fuels the economy
human capital
economic growth - increase in GDP per capita due to decreasing dependency ratio
Emerging markets
Countries with low to middle per capita income that have undertaken economic development and begun to “emerge” as significant players in the global economy
International poverty line
Monetary threshold under which an individual is considered to be living in poverty
Poverty
The state of not having enough material possessions or income for a person’s basic needs
Purchasing power parities
Exchange rates that account for relative price differences across countries
Scale
places identified at a variety of geographic scales, from local territories to the national or state levels. Climate change affects the world at a planetary level
Poverty reduction
main success of MDGs (Millennium Development Goals) was the global reduction of extreme poverty
number of people living in poverty in LICs went from 1.9 billion in 1990 to 836 million in 2015
MDGs
Millennium Development Goals
Middle class
People who have approximately 33% of their income left over after paying for essentials
Middle class consists of…
non-manual workers
middle management
small business owners
Why does middle class grow
as mean global income increases and absolute poverty falls, the balance between rich and poor shifts, growing the global middle class
Increase in average incomes and fall of poverty caused:
Increase in the proportion of the world’s population that is neither rich nor poor
Finds itself in the middle of the income distribution
Disposable Income
The income of households (wages, salaries, social benefits, etc.) after taking into account the payment of taxes and social contributions. The money you have left to spend or save.
Socio-economic impacts of a growing middle class
Will help to increase sales of goods such as electrical goods, mobile phones, cars, etc.
people will have better access to educational and medical services
Environmental impact of a growing middle class
Increased disposable income, more vacations which results in increase of ecological footprints
Resource consumption increases
Ecological footprint
The area of land and water required to support a given human population at a particular standard of living. Can be measured in global hectares or in number of Earths
Biocapacity
The Earth’s bioproductive land and sea (includes forests, croplands, pastures, etc.). This is not only to provide food, but also to absorb water
Demand
The amount of bioproductive land we need to provide our resources and space for infrastructure and to absorb the waste that we produce
Carbon footprint
total amount of greenhouse gases that are generated by our actions
Water footprint
total volume of fresh water used to produce the goods and services consumed by individuals, communities and businesses
Factors that increase ecological footprint
relying heavily on fossil fuels
meat-rich diets
high level of imported resources
large per capita consumption of food
Ecological overshoot
when human demand exceeds the regenerative capacity of a natural ecosystem
How countries can reduce ecological footprint
Stricter caps on carbon use for companies
Encouraging environmentally friendly choices by offering benefits
Limiting imports of tropical fruits and other products
Campaigns and initiatives to protect animals and plants (ecoduct)
Increasing demand for food due to
Rising population
Growth in middle class (diet change)
Increasing urbanisation (fast-food higher demand)
Increased levels of wealth (minimum wage)
Under-nourishment
Food intake not containing enough energy, calories, etc.
Malnutrition
Food intake lacking essential nutrients
Issues limiting availability of food for LEDCs
Exports limit left over supply
Crops generated for cash, not food
Demands for bio-fuel crops; “loss” of fertile farmland
Corrupt governments
Low levels of technology
Issues limiting availability of food for both M/LEDCs
Natural hazards - floods, forest fires & droughts
Climate change - droughts & global warming
Dietary change - more people meat dependent
Energy grid
Interconnected network for electricity delivery from producers to consumers