Exam One
1/171
There's no tags or description
Looks like no tags are added yet.
Name | Mastery | Learn | Test | Matching | Spaced | Call with Kai |
|---|
No analytics yet
Send a link to your students to track their progress
172 Terms
What range of volume does the micropipet deliver?
0.2 to 1000 µL
Where is the liquid in a micropipet held?
In the disposable polypropylene tip, stable for most aqueous solutions and many organic solvents except chloroform (CHCl3)
What is the micropipet also not resistant to other than chloroform?
Concentrated nitric or sulfuric acids
How does a micropipet prevent aerosols from entering the pipet shaft and causingh corrosion or cross contamination?
Some tips have polyethylene filters
What is the difference between accuracy and percision?
Accuracy refers to how close a measured value is to the true value, while precision indicates the consistency of repeated measurements.
What is an example where a labeling error can result in a significant problem?
Consider a patient’s blood sample with a name labelling error
What is quantitative chemical analysis?
The measurement of how much of a chemical substance is present in a sample.
What is the purpose of quantitative chemical analysis?
To determine the concentration or amount of substances in a sample. Checking to see if there is a difference from the blank measure that is different from the random noise present.
i.e. “Does this mineral contain enough copper to be an economical source?” or “ Has there been a significant increase in the amount of SARS-COV-2 antibodies in this patients blood?”
What is a t-test?
A statistical test used to compare the means of two groups to determine if they are significantly different from each other.
What are some examples of tools for chemical analysis?
Micropipet, Beaker, and Graduated Cyclinder
Fill in the following statement:
Experimental error is present in ______ measurement.
every
True or False
There is no way to measure the “true” value?
True, because all measurements are subject to error.
What are some examples of different types of error?
Human error, Instrumental error, Labeling Error
What do Random/indeterminate errors affect?
The precision of the result.
i.e. Base line noise in a dopamine test
What does random error arise from?
Uncontrolled variables in measurement that have equal chance of being positive or negative and are always present, nor can be entirely eliminated.
What does systematic error deal with?
It affects the accuracy or nearness to the true value.
What does systematic error arise from?
Flaws in equipment or in the experimental design, which are reproducible and can often be corrected.
How do we deal with experimental error?
With care in experimental design, calibration, and repeated trials to minimize its impact. Random errors however are always present so mathematical methods such as propagation rules help to minimize their effects by accounting for the error in the results.
What is an example of how we account for random error?
Signal averaging or lock-in detectors.
What is Gaussian Distribution?
A statistical distribution characterized by its bell-shaped curve, where most values cluster around the mean, and probabilities for values further away from the mean taper off symmetrically.
What is the symbol for the mean in Gaussian distribution?
x̄, the average and center of distribution
What is the symbol for standard deviation in Gaussian distribution?
s, measures how closely the data clusters about the mean, and the width of the distribution
In ideal gaussian distribution, where does the maximum x occur?
At the mean value. (µ)
True or False:
The probability of observing a value within a certain interval is proportional to the area of that interval.
Treu
What is the F-test?
A statistical test used to compare the variances of two populations to determine if they are significantly different.
What is the formula for an F-test?
F = (s1² / s2²), where s1² and s2² are the sample variances of the two populations being compared.
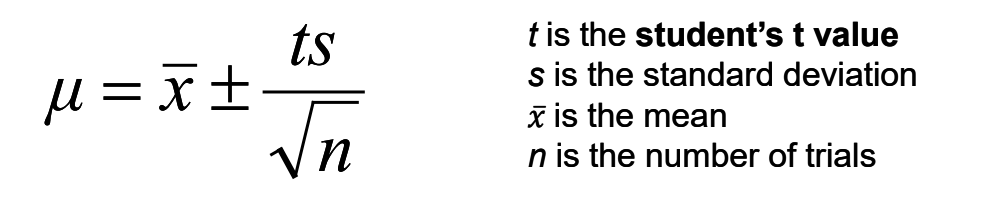
From a limited number of measurements (n),. we cannot find the true population mean, µ, or the true standard deviation, ∂. What can we determine?
The x and s or the sample mean and the sample standard deviation.
What does the confidence interval allow us to state?
At some level of confidence, a range of values that include the true population mean.
Why is a low level of confidence in a confidence interval result in a smaller confidence interval?
Because a lower confidence level means we are willing to accept a higher margin of error, thus narrowing the range of values around the sample mean.
When data sets are compared in a study what does p mean?
The p-value indicates the probability of observing the data, or something more extreme, given that the null hypothesis is true.
The world population at any given time is off by upwards of 2-3% regardless of the method used to count. What does this represent?
The fact that any measurement has some kind of error.
Since experiment measurements will always contain variability whtat cn not be done.
A conclusion can not be drawn with absolute certainty.
What do statistical tools allow us to do?
To accept or deny conclusions which have high (or low) probability of being correct.
For simple gaussian distribution how do you calculate the degrees of freedom?
n-1
What is variance in Gaussian distribution?
A measure of the dispersion of a set of values in a Gaussian distribution, calculated as the average of the squared differences from the mean.
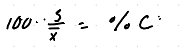
How do you calculate relative standard deviation?
.

How do we calculate percent relative standard deviation?
.
What do we use when the mean values of two sets of measurements are statistically different from each other when experimental uncertainty is considered?
The t-test, which compares the means of two groups to determine if they are statistically different.
What is the null hypothesis?
Data sets A and B are not significantly different.
When can we reject the null hypthesis?
When the chance of it being true is < 5% (95% confidence)
If tcalc < ttable, 95% the null hypothesis is confirmed when?
p>0.05, data is statistically equal
If tcalc > ttable, 95% the null hypothesis is rejected when?
p < 0.05, data is statistically different.
What is the meaning of not significantly different?
We are 95% confident that the data sets are equal.
What about a p < 0.001?
We are 99.9% confident that the data sets are different.
What is the prupose of the Grubbs test?
The Grubbs test is used to detect outliers in a univariate data set, helping to determine if a single data point is significantly different from the rest of the data.
What is the formula of the Grubbs test?
G = max |xi - x̄| / s, where xi is a data point, x̄ is the mean of the data set, and s is the standard deviation.
What is the point of the calculations of the mean and standard deviation?
Even with limited data we can make an educated guess about the distribution of the future measurments.
If we expanded aa data set to 1000 measurements what would the histogram look like?
Gaussian distibution, and we only need the mean and standard deviation to do it.
Finish the Statement:
If n increase then the prediction ________.
Changes as the values approach true distribution
When do we know if a line is a good fit with a least squares regression line?
With a R2 > 0.99
For significant figures, what do you always round standard deviation to?
one significant figure
For significant figures what do you round the mean to?
the same decimal place as the data sets standard deviation.
What is the true origin of the concept of significant figures?
The measurement error, this is why the number of sig figs actually matters
Treu or False:
You can use the Grubbs test twice in the same data set.
False; the Grubbs test is designed to detect only one outlier at a time.
What if data is not Gaussian distribution and we want to use the Grubbs test?
You will have to use another data set because the Grubbs Test only works for normally distributed data.
What ios the method of least squares?
A statistical technique used to determine the best-fitting line by minimizing the sum of the squares of the differences between observed and predicted values.
Why do we square the deviations in the least square model?
To make direction not matter in the solution and to make larger deviation be weighed more heavily.
How is the sum minimized in a least squares model?
By changing the slope and y-intercept of the fitted line.
What is the first step of calibration cureves
Prepare standards in the relevant range
What is step 2 of the calibration curve?
Subtract blank measurements (mean and std dev.) (corrected responses)
What is step 3 of the calibration curve?
Graph the corrected response vs the analyte. Obtain the m and b from least squares analysis.
What is step 4 of the calibration curve?
Unknown anlysis; run samples, subtract the blank (get y), oclve for x using y = mx. + b.
What is one use case of a calibration curve?
To determine the response of a sensor by using standard solution at varying concentration.
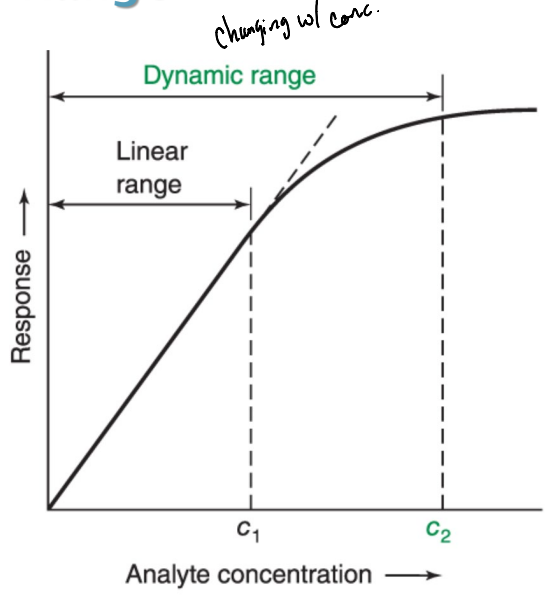
What is linear range?
The concentration range where the instrumental response is a linear function of analyte concentration.

What is the dynamic range?
The concentration range where the instrumental response varies as a function (could be nonlinear) of analyte concentration.
Why should we add error bars to our graphs?
Error bars should be added to graphs to visually represent the variability or uncertainty in the data, allowing for a better understanding of the precision of the measurements.
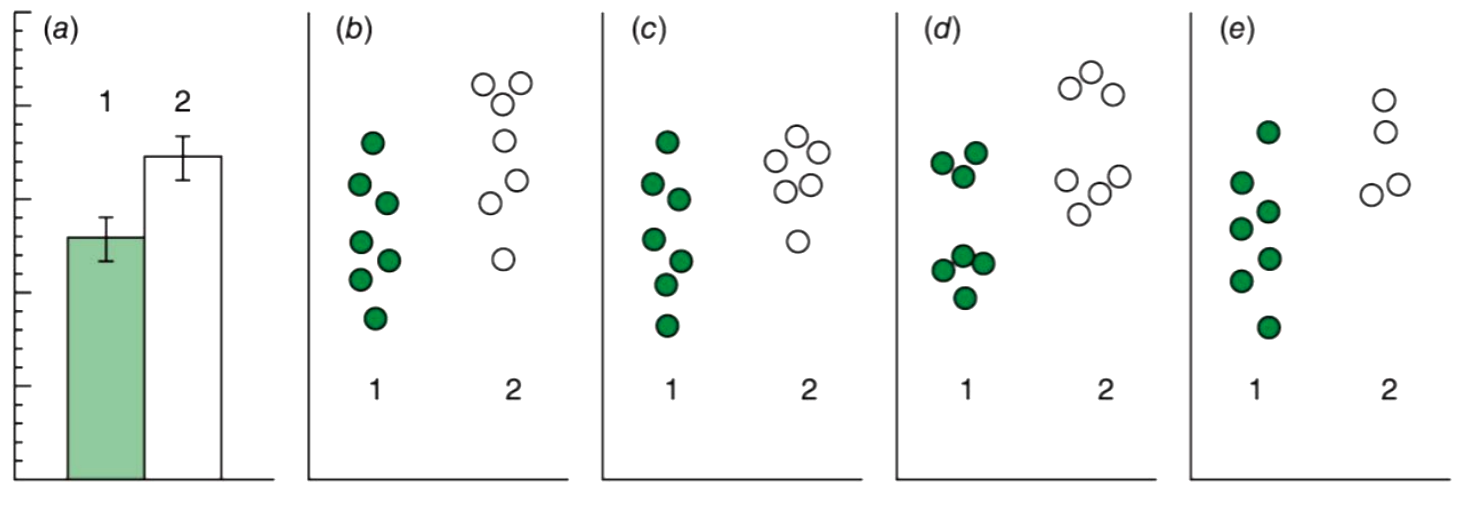
Why is it important to show both scatter and bar graphs when representing data?
Since the bar graph only shows standard deviation and mean, very different data sets could be represented.
What is the slope of the calibration curve represent?
The sensitivity
What is the difference between the measured sample and the blank sample
The corrected measurement
What is the measurable instrumental response versus the analyte concentration?
The dynamic range
What is the concentration range where the instrumental response is a linear function of analyte concentration?
The linear range
What is good practice in calabration curves?
Always graph data
do not extrapolate data beyond the measured range because we do not know what could occur
run ≥ six standard in random order
Add error bars to your data points
What is the calibration curve?
The response of analytical method to known quantities of analyte (Standards)
What is a blank solution?
A solution that contains all the components of the sample except the analyte, used to calibrate the instrument and correct for background signals.
What is the assumption of least squares method?
That the y-errors » x-errors, and all y-errors are similarThis method assumes that the variation in the dependent variable (y) is greater than that in the independent variable (x), allowing for linear regression analysis to minimize the sum of the squares of the residuals.
What does the method of leastt square do?
It minimizes the vertical deviation between the line (which is adjustable) and the data (which is fixed).
What is the first rule to determine if a number is significant?
A non-zero digit is always significant.
What is the second rule to determine if a number is significant?
A zero is significant if it is between non-zero digits.
What is the third rule to determine if a number is significant?
Leading zeros are not significant
What is the fourth rule to determine if a number is significant?
A trailing zero is significant only if there is a decimal point present.
What is the fifth rule to determine if a number is significant?
If the leftmost digit dropped is the number five or greater (5 through 9), round up.
Why is quality assurance of data needed?
to ensure accuracy, consistency, and reliability in data collection and analysis, which ultimately supports informed decision-making and maintains the integrity of research results.
What is the programmed cell death protein that is an inhibitory cell surface receptor that functions as an immune checkpoint. Encoded by the PDCD1 gene, it regulates the immune system by inhibiting apoptosis in regulatory T-cells and promoting apoptosis in antigen specific T-cells to maintain immunity and self-tolerance. Thus, making an attractive target in clinical research to attack tumors and treat certain types of cancer.
PD-1 protein
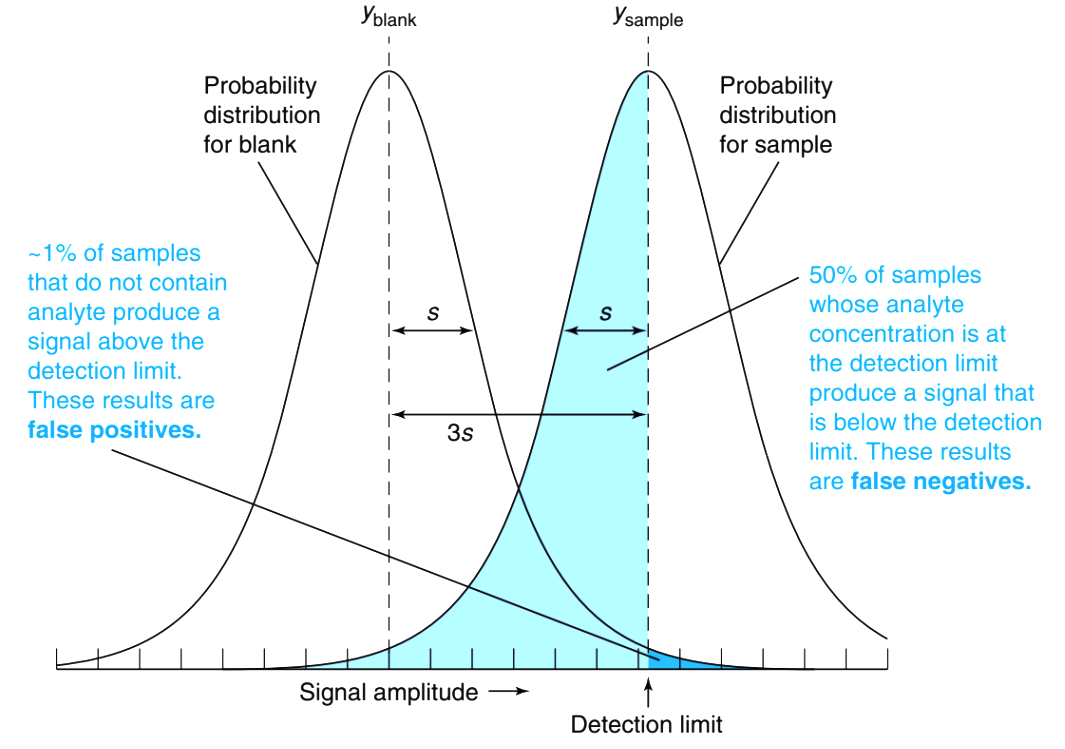
What is a false positive?
An incorrect conclusion that the condition being tested for is true.
i.e. disease diagnosis or water contaminationA false positive occurs when a test indicates that a condition or attribute is present when it is actually not, leading to a misleading result.
What is a false negative?
An incorrect occlusion that the condition being tested is false.
What is selectivity?
The ability to distinguish analyte from other species in a typical sample avoiding interference.
What is sensitivity?
The response of the analytical method to changes in the analyte concentration ([analyte]) (Also known as the limit of detection)
i.e. the slope of the calibration curve
What is a blank?
Everything the but the anlyte
i.e. the “matrix”
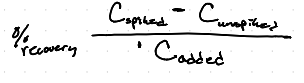
What is the formula for percent yield of a spiked sample?
.
What is the linerarity test.
Utilizing R2 from the least squares model to inform us about the fit to the model, which indicates how well the data points align with the regression line.
When is the linearity test best?
When R2 ≥ 0.995
WHat is the limit of detection?
(LOD) is the lowest concentration of an analyte that can be reliably detected but not necessarily quantified in a sample. It is crucial for assessing the sensitivity of analytical methods. Smallest amount that is statistically different.
What is the Limit of Quantiziation?
(LOQ) is the lowest concentration of an analyte that can be reliably quantified in a sample. It is essential for determining the accuracy of analytical measurements. It is 10 standard deviation from the blank mean measurement.
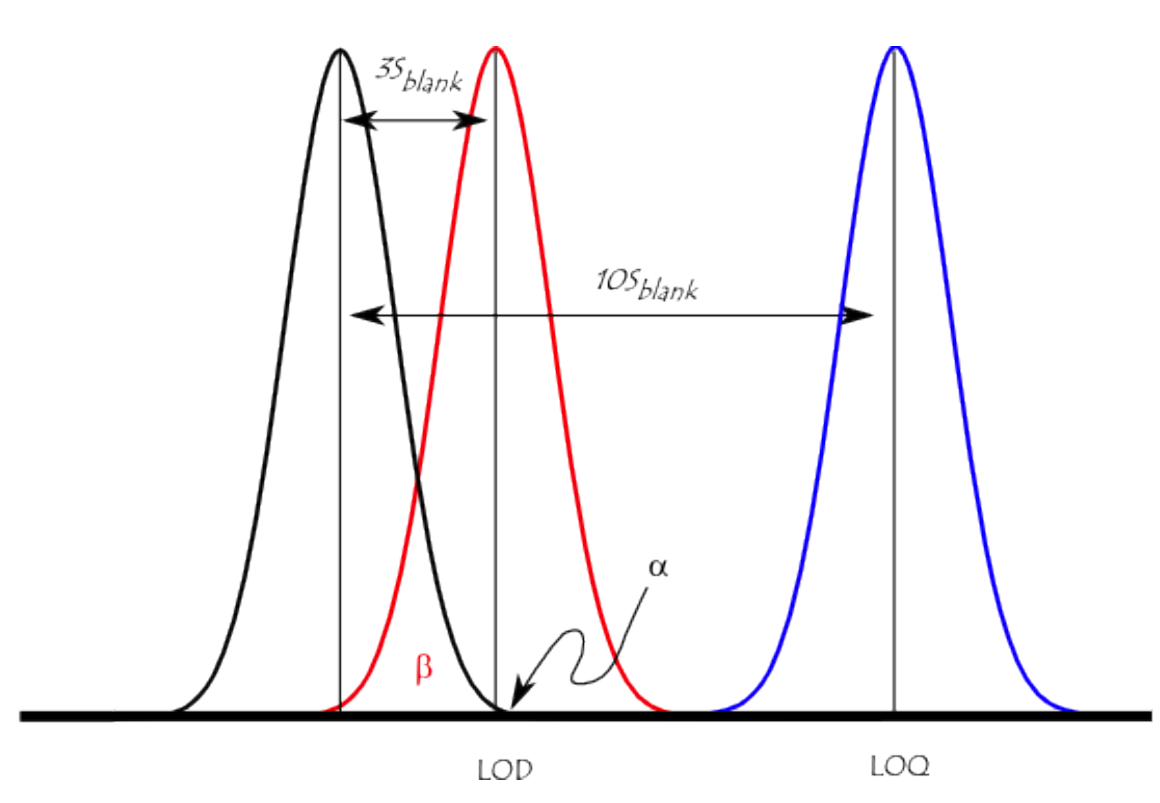
What is the formula for LOD?
The formula for LOD is: LOD = 3.3 × (standard deviation of the blank) / (slope of the calibration curve). This calculation helps in determining the sensitivity of an analytical method.
What is the formula for LOQ?
The formula for LOQ is typically calculated as 10 times the standard deviation of the blank divided by the slope of the calibration curve.
What is a blank sample containing all components except for analyte that has not been subjected to the steps of the chemical analysis?
Reagent blank
What is the concentration interval over which there is measurable response to a change in analyte concentration?
Dynamic Range
What are the quantities reported upon completion of statistical analysis of the data?
Results
What is a blank sample exposed to the environment at the sample collection site and transported in the same manner as other samples back to the lab?
Field Blank
What are individual measurements?
Raw Data