MATH 221 Ch.1 Prt. 2
1/116
There's no tags or description
Looks like no tags are added yet.
Name | Mastery | Learn | Test | Matching | Spaced | Call with Kai |
|---|
No analytics yet
Send a link to your students to track their progress
117 Terms
Def: Continuous Data
Any value within a scale range(Ex. Weight, Temperature, price)
Def: Discrete Data
Can only take certain values(Generally counting values) Ex. Number of Pets, children, cars. (Generally Whole Numbers)
Note. We treat numbers that don't fit perfectly in either category as Continuous, It most often then not.
Levels of continuity and levels of measurement are different, though related.
Def: Confounding variable
Something that may play into a relationship that we haven't considered yet
2 Forms of Observational Studies
Prospective and Retrospective studies
Def: Prospective Studies
Identify individuals and collect information as events unfold
Def: Retrospective studies
Collects data after events have taken place
Def: Simple Random Sampling
The most basic way of sampling - Ex. A Raffle
Def: Strata
When populations are divided into groups (Ex. Sampling football players - divide them into teams or positions)
When designing experiments you need 2 groups
A Control and Treatment Group
Def: Randomization
Randomize patients into groups to account for variables that cannot be controlled
Def: Replication
An increase in cases observed means increased accuracy in estimating the effect of the explanatory variable on the response variable.
Def: Blocking
A concept in which you group cases by a variable that may affect outcome to get an equal representation from the groups
Blocking Example
Ex. Heart attack drugs - block into low-risk and high-risk groups
Def: Blind study
Experiments where participants don't know what group they are in.
Def: Placebo Effect
Slight but real improvement in the control group which is receiving placebo
Def: Operationalization
When we take things that are not measurable and try to define and measure them
If something is too impractical to measure you might need to rely on a proxy measurement
Ex. Death is defined by the absence of all brain activity, including the brain stem - This is diagnosed with an MRI.
However we never put someone suspected to be dead in an MRI, because of how impractical it is
No measurement is perfect
Even if you operationalize it really, really, really well
Def: Classical Test Theory (CCT) or Classical Measurement Theory
It helps us to better understand how imperfect measurement relates to the true, underlying score.
CCT states that there are three parts:
Observed, true, and error score
Def: Observed Score
Is whatever our measurement gives us
Def: True Score
Is the hypothetical "true", underlying score
Def: Error Score
Is whatever difference there is from the true to the observed
CCT formula - X = T+E
X= Observed Score
T = True Score
E = Error Score
Ex1. You measure yourself with a tape measure, and it says you are 68"
What part is that (the 68")
The Observed Score (X)
Ex2. However you go to the most accurate tool for measurement, and you are actually 69.25"
What is 69.25"?
The True Score (T)
Ex3.Therefore, our tape measure seems to be off by 1.25"
What is 1.25"?
The Erro Score (E)
Ex. You have a home blood pressure measure that systolic reading is 126
What part of the CTT equation is 126
The observed score(E)
There are 2 parts to the error in the CTT perspective
Random and Systematic Error
(DEF.) Random error
It is due to chance.
Random Error is an error that occurs not because of the problem with the test or the tester, just random.
It is assumed to cancel out over multiple measurements
Ex, let's say you roll a die and get five 4s in a row.
If there isn't something wrong with the die and if that was just random, in the next 60 trials, we should get 10 of each number on the die. (Probability wise)
Random error is reduced by getting better measurements - either with better instruments or better testers.
However random errors can never be eliminated completely
(DEF.) Systematic Error
Error due to causes that can be remedied that are not chance
Systematic Error can be caused by human error much more frequently than random error
Ex. A company might have made a mistake in dice production, causing them to be weigthed
(DEF.) Validity
How accurate the measurement is.
(Does the instrument measure what is was designed to measure)
Different types of Validity
Criterion, Content, Ecological Validity
(DEF.) Criteron validity
Is the instrument measuring what it claims to measure
(DEF.) Content validity
Do the individuals items represent the construct, and do they cover the full range of the construct
(DEF.) Ecological validity
The Extent to which the results of a study can be applied to the real world.
(DEF.) Reliability
How precisely you measure something
(Will your measurement produce the same results under the same conditions?
Ex. Reliability
If you measure your height , and the measure your height again 3 seconds later, your height shouldn't have changed.
( You shouldn't have grown (or shrank) in that amount of time
One of the most common is test-retest reliability (flip)
If you take the test, then retake it, is it the same?
Ex. If you measure your height and then take your shoes off and measure yourself again, your height probably will/should change.
Is this an issue/concern with realibility?
No, because you changed what you were measuring
(You with and without your shoes)
Ex.2 If you measure your height and then measure your height again after a growth spurt, is this an issue with reliability?
No, because again you've changed what you're measuring
(Different conditions, of later times of growth)
Ex.3 Can a measuring tape be reliable but not valid or valid but not reliable?
Reliable but not Valid
Ex. The tape can say 1ft tall each time but you're actually 5'8
The most useful is the normal distribution, commonly referred to as the bell curve
Normal distributions are symmetrical bell shapes, where the majority of the data are towards the center of the distributions.
(As the scores get higher or lower there are fewer and fewer scores.) (Kurt = 0)
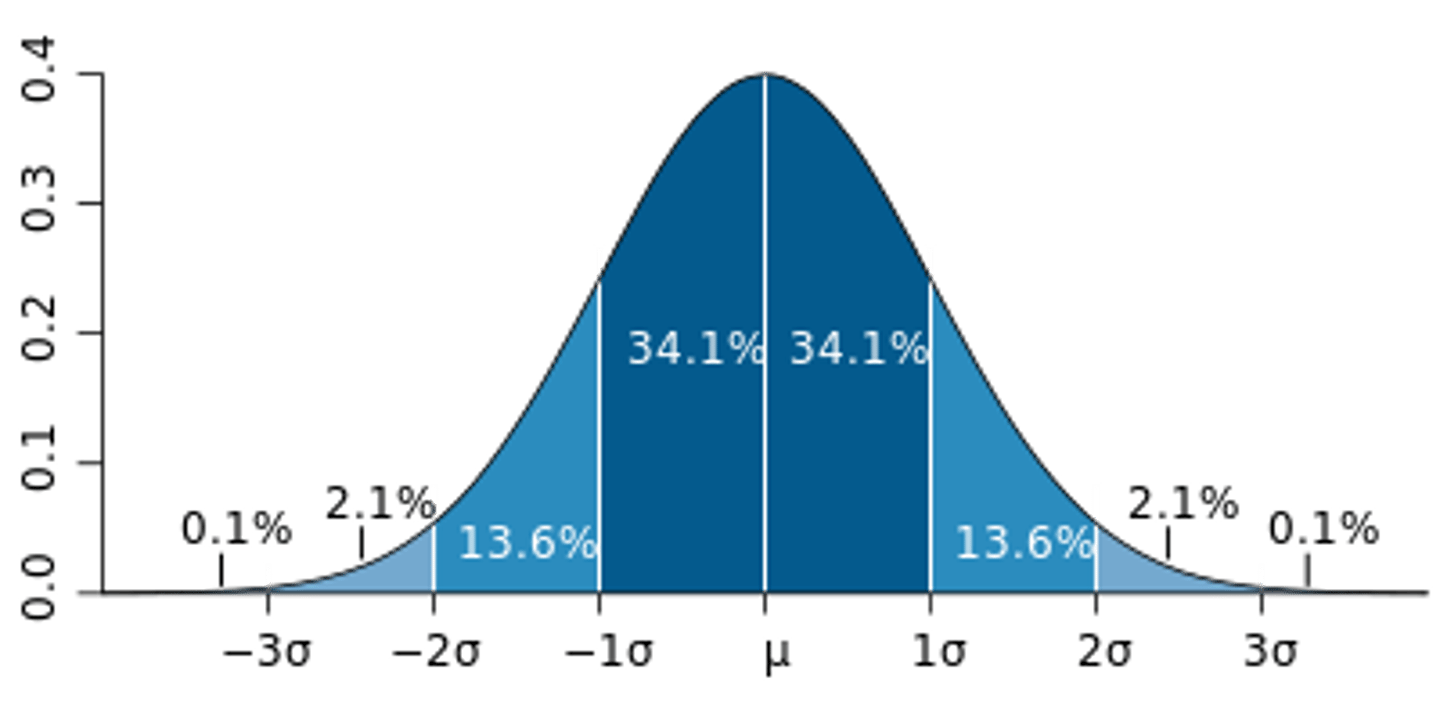
Distributions differ in two main ways: Skew and Kurtosis
We often assume our distributions are normal, which is why we visualize data first, so you can easily see if it's normal or not
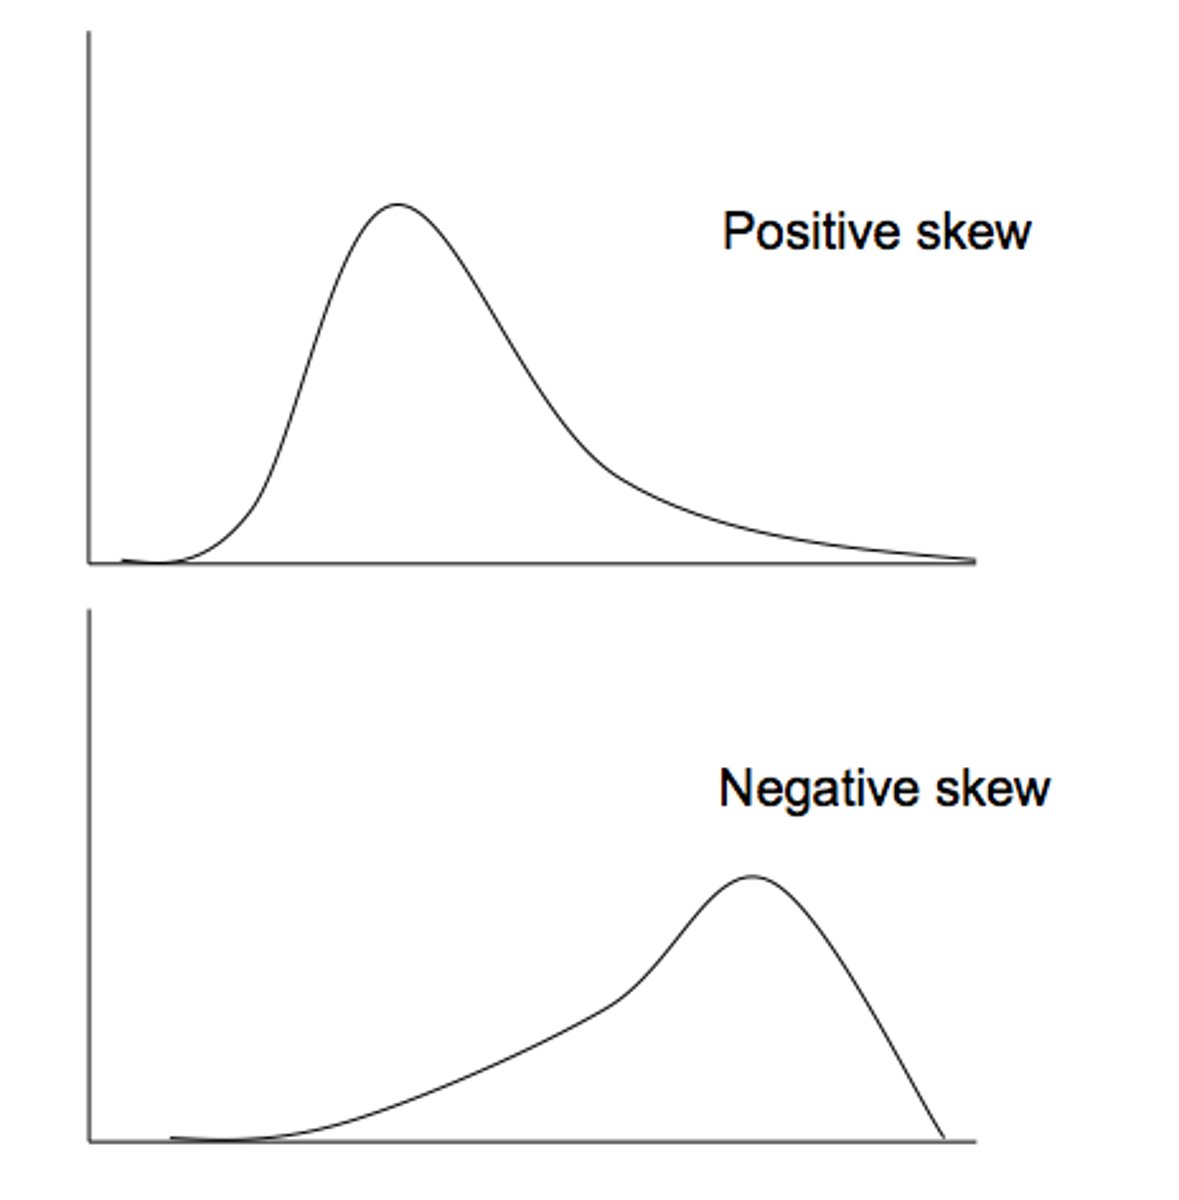
(DEF.) Skew
Refers to the symmetry- how much the tails of the distributions are similarly shaped
Skew can be positive or negative (flip)
A positive skew has scores disproportionately clustered at the lower end of the distribution
A negative skew has scores disproportionately clustered at the upper end of the distribution.
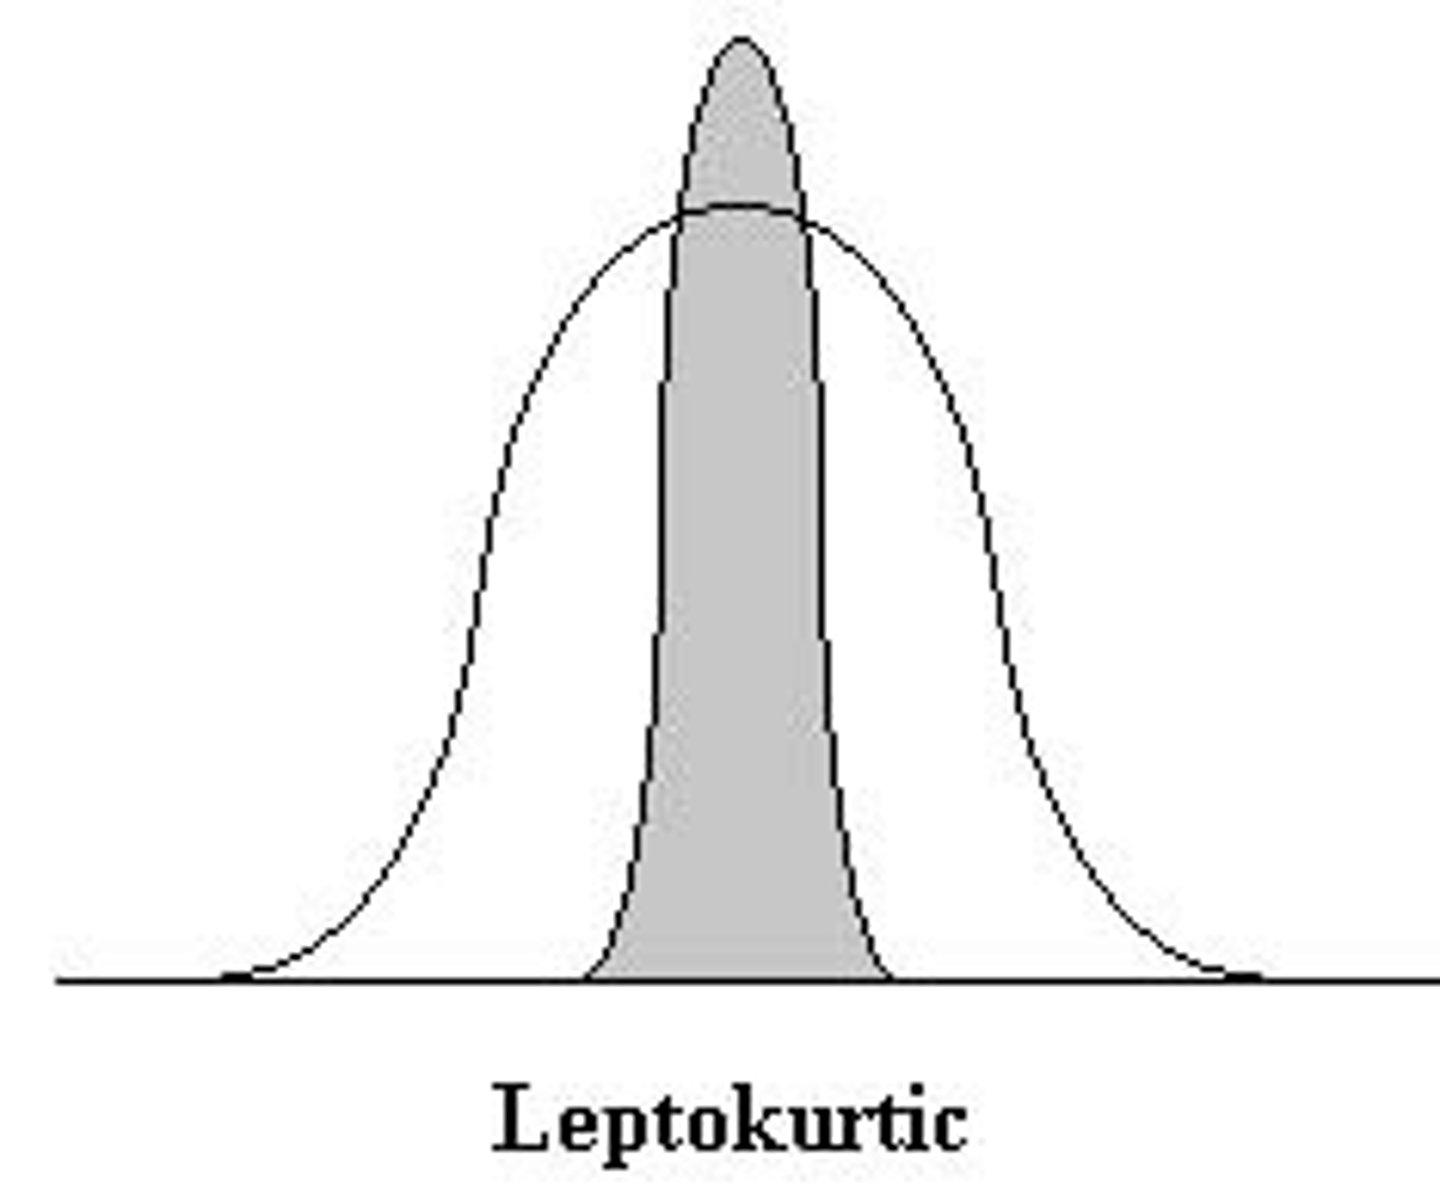
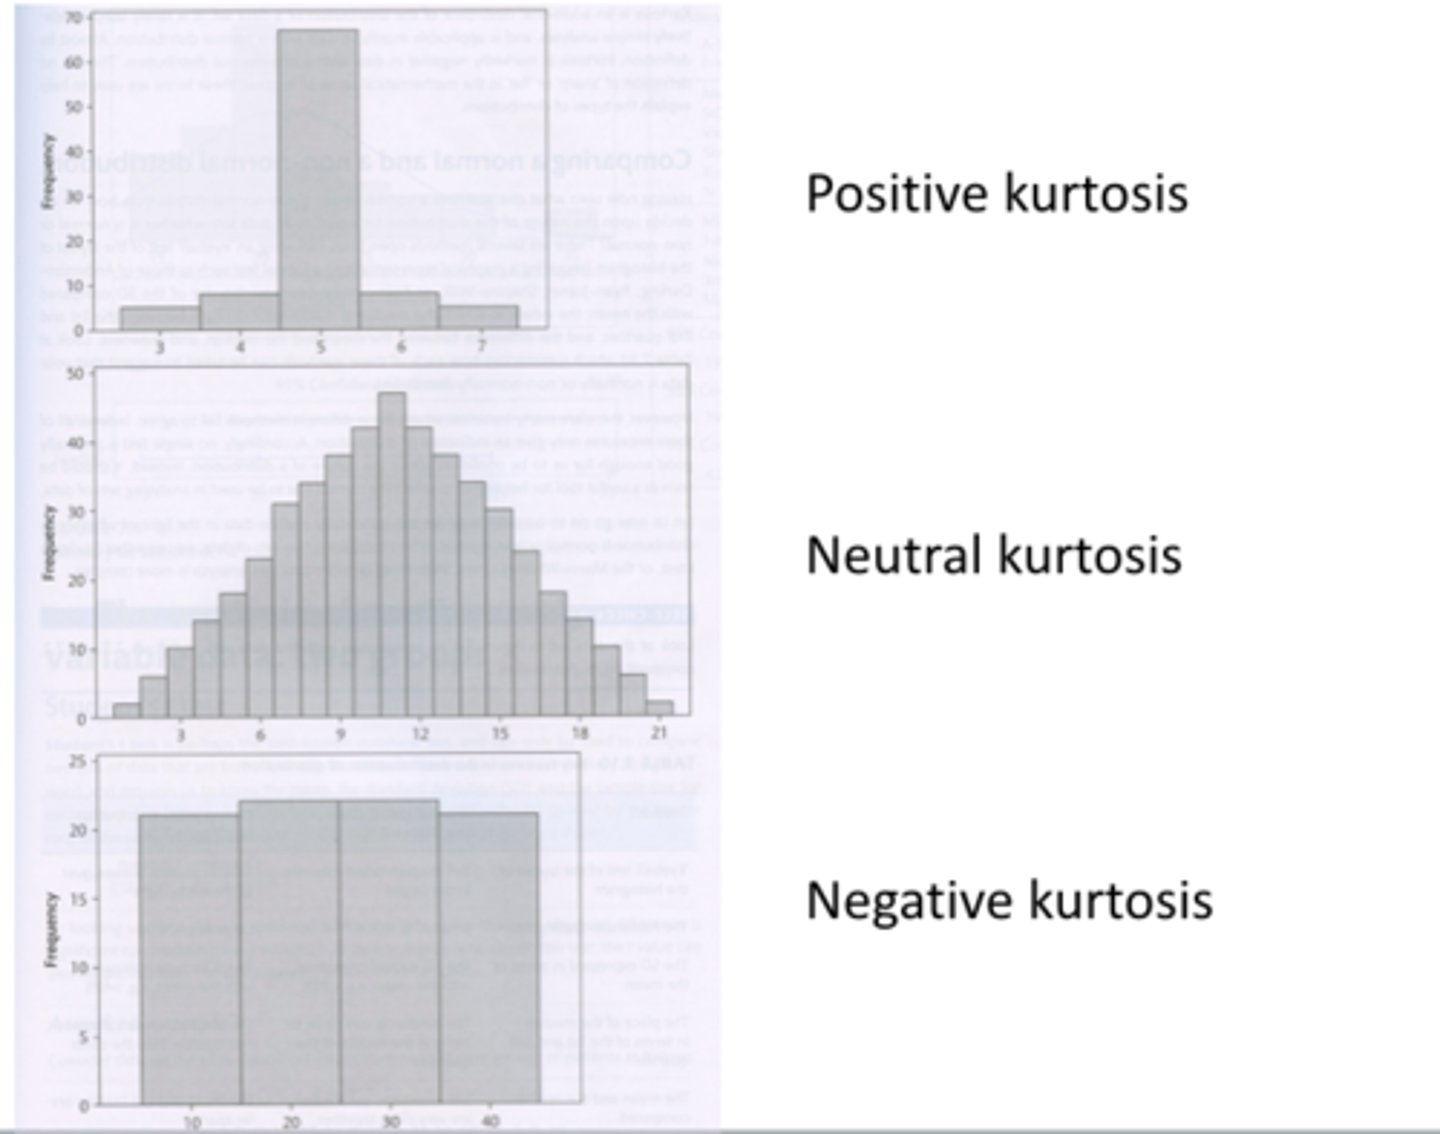
Kurtosis refers to how flat or pointy distributions are
Kurtotic distributions can also be positive or negative
Positive kurtosis has a disproportionately low number of scores in the tails
Therefore, it will look pointy
Positive Kurtosis is called leoptokurtic (Kurt > 0)
Negative kurtosis has a disproportionately high number of scores in the tails
Therefore, it will look flatter
This is called platykurtic(Kurt < 0)
Therefore, if a distribution has a skew and kurtosis both of zero.
What is the distribution
Normal Distribution
(DEF.) Measures of Central Tendency (Tripple Ms - Mean,Median,Mode)
Single values that attempt to represent the middle or center of a dataset (Average)
Median = Middle
Score that divides the frequency distribution in half
(Scores need to be in order)
To calculate the median, order of the scores
Odd number of scores: find the score in the. middle
Even number of scores: find the average of the 2 middle scores
Mode = Most frequently occurring score
could be useful in nominal data
Mean: only measure reflecting each score in the distribution
(Using all the score into account)
Most influenced by extreme scores (outliers)
Median: Only concerns number of scores above/below the data
Good to use when distribution is skewed - uneven
Not very affected by outliers
Mode: only suitable when you want to know the most likely/ most occurring value
Only one that can be used with nominal data
Not very affected by outliers
Ex. Pg 43
You can have the same mean and median but different scores
By measures of central tendency, these are the same classrooms.( Triple M's)
To better describe the differences we need Measures of Variability
Range, IQR, Z-scores, T-Scores Sum of Squares (SS), Deviant Score, Variance(Solution), Standard Deviation
(DEF.) Range
Simplest measure
Range = highest score - lowest score
similar to mean : VERY sensitive to outliers
(DEF.) Interquartile range (IQR) - To calculate
1. Find the median
2. Find the median of the upper and lower portions.
-Lower median = Lower quartile
-Upper median = Upper quartile
3.. IQR = range of data between lower quartile and upper quartile.
To Compute - Upper quartile - Lower Quartile
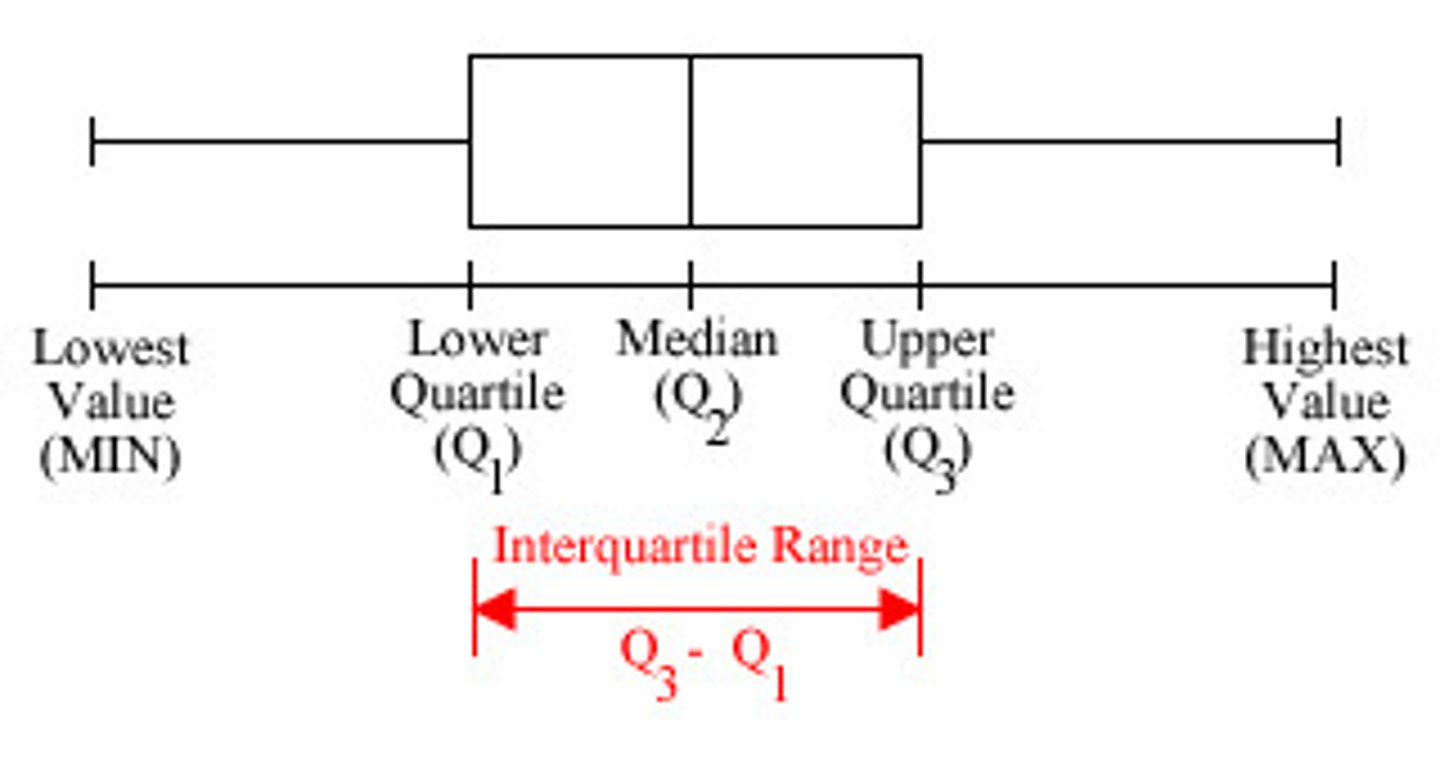
More IQR :
About half of your data will be in that range
Advantage: isn't affected by extreme scores (outliers) at either end of the distribution
Disadvantage: you love about half your data
Variance and Standard Deviation are also measures of variability
For Ex. Look in notes Pg. 49
Z-score tells you:
Whether or not the raw score was above or below the mean
How many Standard deviations (SDs) the raw score was above or below the mean
We can compare SDs to SDs
Back to the original question:
If 7"2 is 2 SDs above the mean
And 450lbs is 1.5 SDs above the mean - then which is more compared to the mean
-7'2 is Further from the mean
How can we assess how good this model is of our data OR How far away from the mean are the data
Each data point (Score) - mean = deviant score
(DEF.) Sum of Squared errors (SS) sum of squares
Square all scores so we get rid of the negative and then add them up
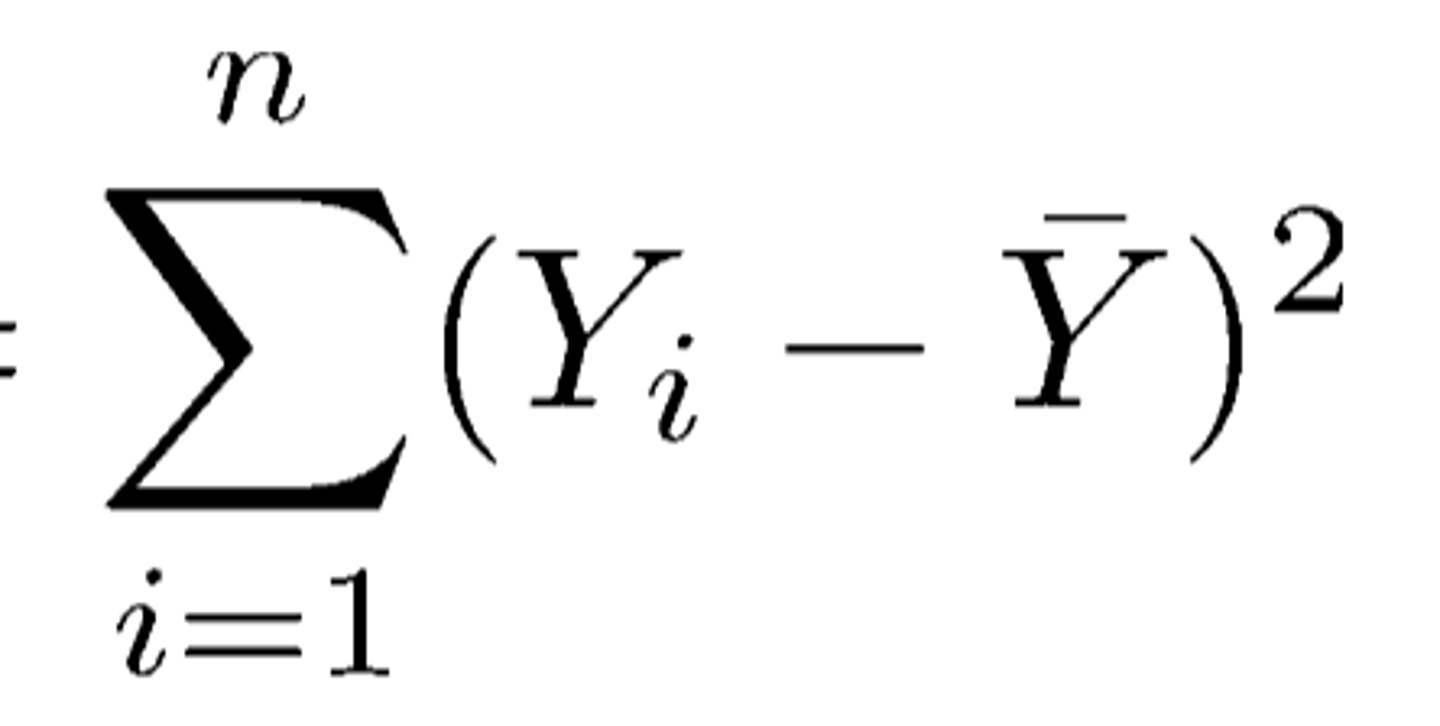
What happens to SS as we add more scores or data points to our data set, e.g. 10 scores instead of 5 scores?
More data points mean a higher SS because we're adding more positive numbers
Solution: Divide by the number of scores
This is called Variance (The Formula is in the Notes)
What are the units of variance?
Solution: Take the square root ( This is called Standard Deviation) - (Formula in Notes)
What happens to standard deviation and variance when the data points (or scores) are further from the mean
Points further from the mean yields bigger results Points closer to the mean yields smaller results
We can have datasets with the same mean but different standard deviations and variance
These values (standard deviation and variance) tell you how well the mean represents the data or how good the mean is a model for our data
By using Standard score we can compare across units
We can look at a frequency distribution
If something is way out on the tail, we know it doesn't occur that often
Ex. Looking at a distribution of heights from the general population, the value 7'2' wouldn't appear too often
Z-Score (Formula in Notes Pg 48(fake) )
where X = raw score, X^_ = average, S = Standard Deviation
Average and SD may be calculated or given -If we put all scores from a dataset into Z-score equation(with constant average and standard deviation)
All Z-score distributions have a mean of 0
All Z-score distributions have a standard deviation of 1
Positive: 1 SD Above the mean
Negative: 1 SD below the mean
One. of the most fundamental distinctions in statistics is the distinction between population and sample
When we research we're interested in how our results will apply to large groups of people ( We are interested in a large group of people)
The problem is we're almost always unable to collect data on all the people in the group we are interested in.
That group - all possible entities we're interested in - is called a Population
(DEF.) Population
The entirety of a group we're are interested in studying
(DEF.) Sample
Subgroup of Subset of a population
Ex. If our population is all Eastern students, we can say a sample or subset could be Student Athletes
Or Comuutues, Dormtypes, First-years, etc.
(DEF.) Random Sample
A sample selected in a way such that
(1) Every member of the population has an equal chance of being selected , and
(2) Selection of one member has no effect on the selection of another
The Example Eastern Example isn't random because not everyone in EU doesn't have a chance to be picked
Since we're (almost) never going to be able to measure an entire population, randomness is super important
If we had our whole population , we wouldn't be doing statistics
Because we wouldn't use statistics to try to figure out what a value is because we'd have it. (Only when we don't have access to the whole population is when we try to infer something via a sample & and population)
A sample should be representative of the population
Ex. If we have a population that is 80% female and we randomly sample 10 people, about 8 should be female.
We denote our sample size to: n
The formula in Notes Pg. 52
(DEF.) Degrees Of Freedom- relates to the number of observations that are free to vary
In the analogy we had 10 players, and only got to choose where 9 of them went, and for 1 player he had no choice.
But if we want to use these 4 scores to calculate the standard deviation, we have to use the mean of the sample
- We hold this one parameter constant: the mean
Ex. The mean of the scores is 10.
- We assume this is telling us something about our population and we keep this constant fixed
The mean equations is written as
- 10 = x1 + x2 + x3 + x4 / 4
Ex. (Look in Notes Pg. 54)
The first 3 values can be whatever, but the last number has to be a certain one or it violates or mean (that is set constant).
We has no freedom to choose the last one, because it needed to be a certain value for the mean to stay constant
If we hold one parameter constant then the degrees of freedom must be one less than the sample size.
We when we use a sample and compute the standard deviation, we use "n-1" in the denominator
Measures of Central Tendency & Measures of Variability
(Example in Notes Pg. 55)
-If the Mean and Median are equal there are no outliers
- If the mean is bigger than the Median, there is a Higher outlier because of the mean sensitivity towards the upper end
- if SDs are equal between Data, the values are evenly distributed
Measures of Central Tendency & Measures of Variability
(Example in Notes Pg. 56)
- Lower outliers bring the mean down, making the mean smaller
- If the mean is 0, there are probably positive and negative values in the dataset
- Higher "S" is more spread
(DEF.) Probability
This relates to how often different events will occur
Ex. Roll 2 on six-sided Dice
Ex. Flipping a fair coin 10 times
Ex. What are chances that you win the lottery
In all the previous examples, The conditions are known
Another way to say it is - We know the model we are working with
But we don't know the data
Where in Probability - Example of flipping a coin. We don't yet know how many heads/tails come up
Whereas in Statistics: we know the data but don't know the conditions yet