Looks like no one added any tags here yet for you.
Single Image Enhancement Purpose
To improve the visual interpretability of a band by increasing the apparent distinction between the features of the scene
Constant stretching
improve visual distinction between features in an image by increasing the range of pixel values which enhances the difference between light and dark areas making details more visible (stretch to bit range such as 0 - 8).
Do if the DN values in a band don’t vary over the entire possible range
Linear Stretching vs Histogram Stretching
Linear: Assign the minimum and maximum value of your bit number to the DN ranges min / max and spread them equally which maintains the original shape of the histogram
Histogram: Redistribute the values based on the images histogram to balance brightness levels (alters histogram shape by redistributing intensities for a more balanced contrast)
Why you’d do histogram stretching > linear stretching
Helps if areas in shadow or brightness lose detail - repress the concentration of pixels in the raw data
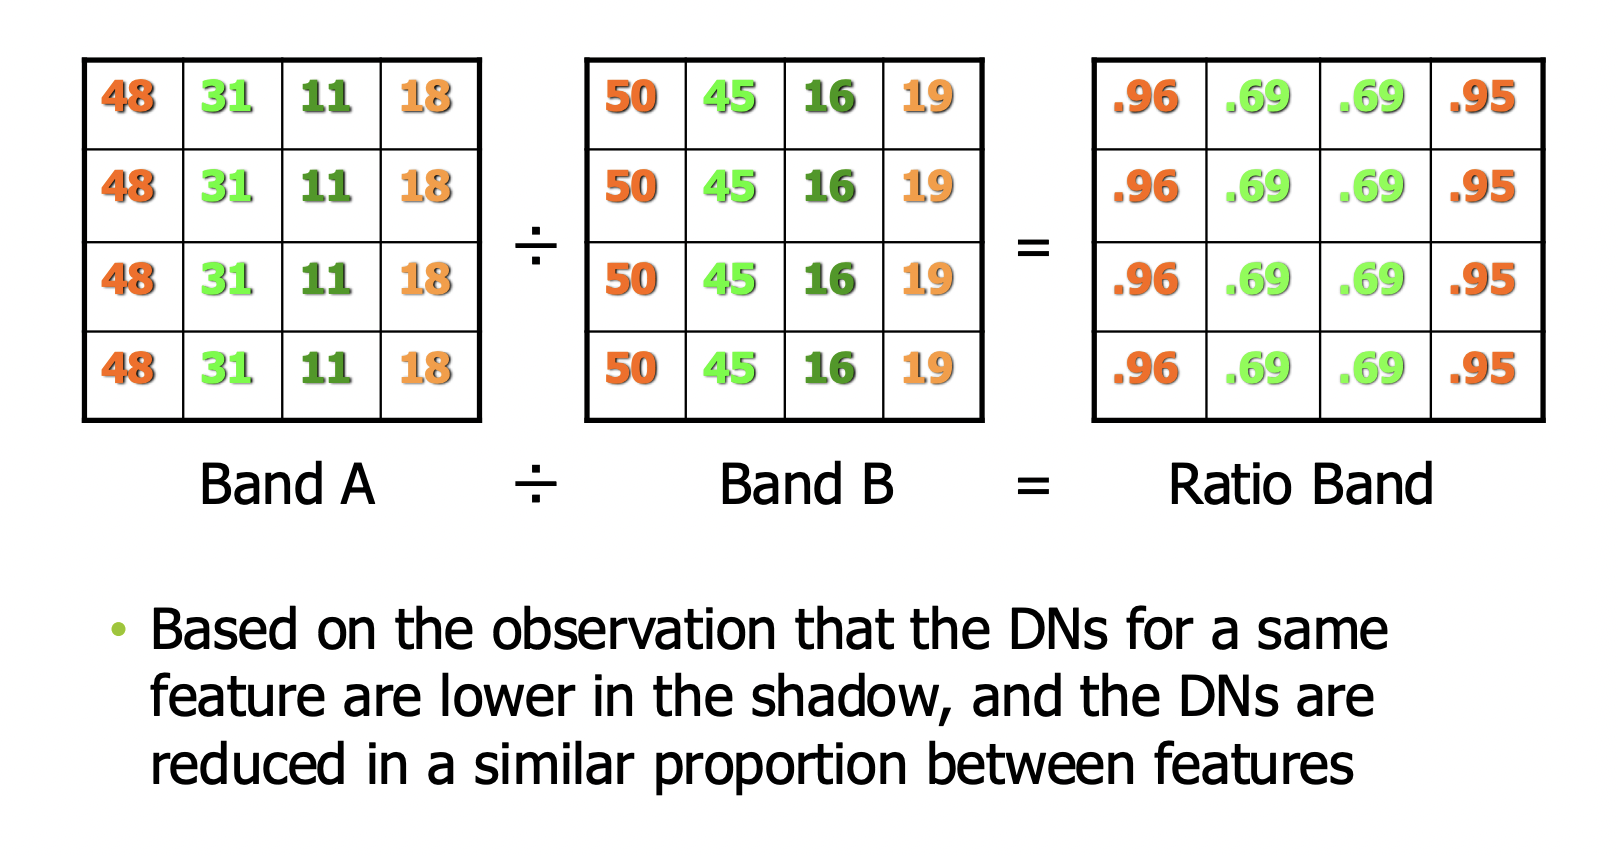
Band-Ratioing
The process behind Indices. Pixel values of one spectral band are divided by the pixel values of a second band (Band A / Band B)
Pros of Band Ratioing (and picture explanation)
Enhances specific features while reducing the effects of illumination differences (shadows and topography)
Helps differentiate land cover types are difficult to identify in one band
NDVI formula and when to use
(NIR - R) / (NIR + R)
Use when calculating vegetation changes over a temporal or spatial extent
normalizes for atmosphere
most general vegetation application
DVI
NIR - R
absolute difference in veg
not normalized
SRI
Simple ratio index
high biomass
not normalized
NIR/R
SAVI
Soil Adjusted Vegetation Index
((NIR - R) / (NIR + R + L)) (L + 1)
Minimize soil noise
L is a correction factor between 0 (high veg cover) and 1 (low veg cover)
Why are indices used in remote sensing (4)
they are simple
they are computed directions w/o assumptions regarding land cover class, soil types, or climate conditions (no prior knowledge , widely applicable)
Provide percise and continuous measures of spectral and temporal variability
Empirically correlated w many environmental variables
Principle Component Analysis
Remove inter-band correlation (two bands that convey similar information) in multispectral (and hyperspectral) data.
Creates a subset of “components” that can substitute bands.
Data is mapped along the two axes which explain the most variance, draw line of best fit, make that new axis, and repeat until most of the variability is explained by the components