HSCI 230 midterm 1
1/79
There's no tags or description
Looks like no tags are added yet.
Name | Mastery | Learn | Test | Matching | Spaced |
|---|
No study sessions yet.
80 Terms
what is epidemiology?
The study of what befalls a population
“A population science… concerned with the pattern, frequency, trends, and causes of disease.” – Raj Bhopal
“The study of the distribution and determinants of disease frequency in human populations and the application of this study to control health problems.” – Aschengrau & Seage
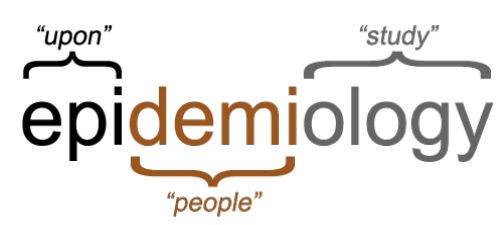
what does the word “epidemiology” come from?
Epi (on/upon) + demos (people) + logos (study of)
what is population health?
outcomes of the health of a population
what is public health?
public health approaches that we use to improve the health of a population
what must we do in order to design and develop public health interventions?
We must first have a robust understanding of the patterns of population health
epidemiologists vs. medical doctors
Epidemiologists are not medical doctors
Medical doctors are dealing with people who already have a disease
"Why did this patient get this disease at this time?" [and how can I treat it?]
Public health epidemiologists look for risk factors of diseases within populations and try to find ways to prevent or help it, as well as trying to figure out reasons for why different groups have different rates of that disease
"Why does this group have higher rates of this disease [than that group] at this time? [and how can I reduce rates in group A?]
what are the main elements of epi studies?
Research questions
Exposure/intervention
Outcome
Population
Rationale
Why does this matter to public health?
Methods
Sampling
Follow-up
Measurement
Additional variables/alternate explanations
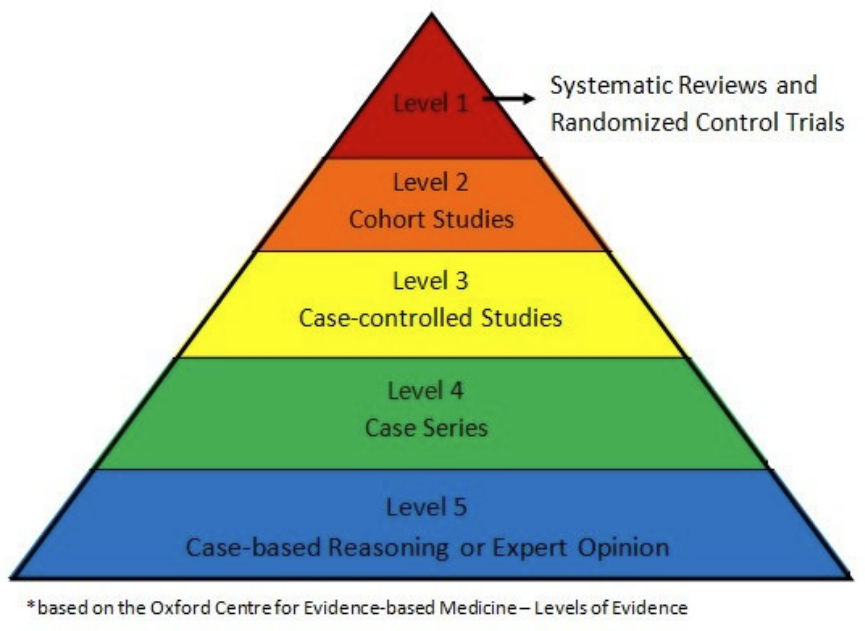
hierarchy of evidence
the higher up the level, the more evidence there is; 1 has the strongest evidence and 5 has the weakest
What are the core components of descriptive epidemiological research questions?
outcome, population characteristics, research question
outcome
Diagnosis, morbidity, death, complications, quality of life
population characteristics
People --> based on outcome-relevant personal characteristics, e.g., age, occupation, social identities/locations, etc.
Place --> based on geography (e.g., near an industrial plant, in a valley) or jurisdiction (province of BC, country of Canada)
Time --> could be days, weeks, months, or years (depending on outcome)
research question
"How has the frequency of outcome Y among population Z changed between years A and B?"; "How does the frequency of outcome Y differ between country C and country D?"
what are the core components of analytical epidemiological research questions?
Population --> typically based on geography, age, and other characteristics
Exposure --> determinant, intervention, treatment, 'risk factor'
Outcome --> diagnosis, morbidity, death, complications, quality of life
Research question --> "What is the relationship between exposure X and outcome Y among population Z?" (use this as a template for case study assignment)
Ex. Does treatment with dexamethasone reduce the risk of death among hospitalized patients with COVID-19 disease?
SDoH
social determinants of health
the interconnected non-medical factors that affect our well-being
include the conditions in which we are:
born, grow, work, live, and age
also include roader economic political and social context
e.g., income, education, and housing
genes
the underlying DNA included in all cells with in our body
some genes will determine presence of a disease/condition
genes and health outcomes
for a vast majority of conditions, you are not guaranteed to get a certain health outcome because you have family history (but might make you more at risk)
epigenetics
the way a person’s behaviours and the environment can cause changes that affect the way the genes work
it turns genes “on” and “off” and thus is related to gene expression
DNA methylation
addition or removal of a methyl group to DNA
typically, methylation turns genes “off” and demethylation turns genes “on” impacting the amount of a certain protein that is made
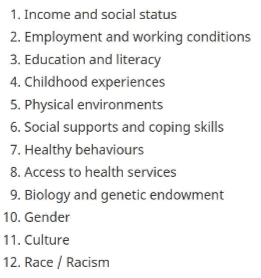
SDoH examples
ideology
any wide-ranging system of beliefs, ways of thought, and categories that provide the foundation of programs of political and social action
theory
coherent and testable set of inter-related ideas that enables scientists to describe, explain, and predict features of a commonly shared biophysical reality in which cause-and-effect exists
Dr. Galton’s proposed explanation for pre-mature mortality
assumption 1: the “case definition” for race is clearly defined and consistent
assumption 2: between-group genetic variations are consistent
underlying assumption: eugenics
evidence: weak
Dr. Link’s proposed explanation for pre-mature mortality
socio-economic status leads to pre-mature mortality
underlying assumption: everyone derives equal benefits from SES
evidence: incomplete
Dr. Brook’s proposed explanation for pre-mature mortality
Minority stress theory; coping response due to stressors leads to pre-mature mortality (e.g., discrimination, harassment, hypervigilance)
underlying assumption: minority stress theory
evidence: limited to individual
ecosocial theory
an epidemiologic theory that embraces population-level thinking and rejects the underlying assumptions of biomedical individualism without discarding biology
multilevel epidemiological framework that seeks to integrate social and biological reasoning and a historical and ecological perspective to gain new insights into determinants of population distributions of disease and social inequalities in health
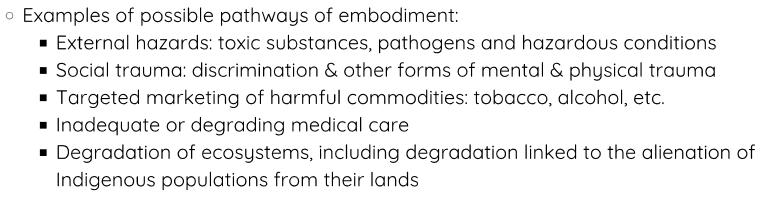
pathways of embodiment
shaped by evolutionary history, our ecological context, and individual histories
the social and biophysical processes involved in organisms embodying their societal and ecological context, thereby producing population distributions of health
shaped by evolutionary history, our ecological context and individual histories
pathways of embodiment ex.
prevalence
existing number of people who have certain outcome
Does not matter how long they've had the outcome, just counting those who have it
point prevalence
prevalence at a specific point in time
period prevalence
prevalence over a period of time (includes existing cases and any incident cases
incidence
new people who got the health outcome over a period of time
i.e., Do not count those who already have the health outcome/got the health outcome before a period of time
in a class of 100 students, 19 students started the term with Condition X. At the end of the term, an additional 25 students developed Condition X. What is the prevalence of condition X at the beginning of the term? at the end of the term?
0.19 or 19%
0.44 or 44%
at the beginning of the term, no students had Condition X. At the end of the term, 47 out of 100 developed Condition X. What is the incidence rate?
.47 or 470 cases per 1000
at the beginning of the term (100 students total), 15 students already had Condition X. At the end of the term, 19 more developed Condition X. What is the incidence rate?
.2235 or 223.5 cases per 1000
In a group of 200 students, 15 students were living with Condition X prior to 2024. In 2024, 6 additional students were living with Condition X
What is the prevalence of Condition X at the end of 2024?
What type of prevalence is this?
How many people were at risk of Condition X at the beginning of 2024?
What is the incidence rate of Condition X over 2024
(15+6)/200 = 0.105 or 10.5%
Point prevalence
200 - 15 = 185 people
6/(200-15) = 0.0324 or 32.4 cases per 1000
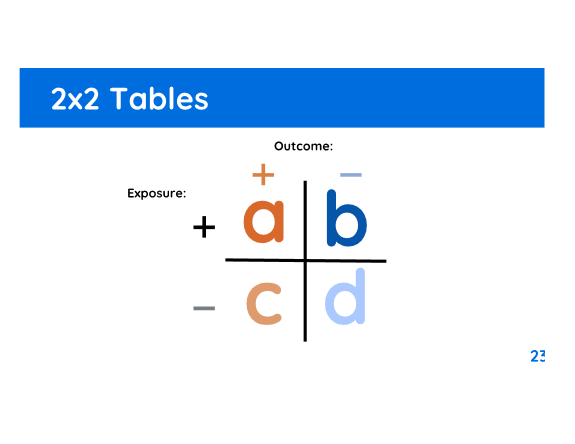
a, b, c, and d
a: had exposure and had outcome
b: had exposure and did not have outcome
c: did not have exposure and had outcome
d: did not have exposure and did not have outcome
relative measures
compare the risk of an outcome between two groups - typically an exposed group and an unexposed group
Comparison through division (e.g., relative)
Not dependent on prevalence
e.g., risk ration/relative risk/cumulative incidence proportion, odds ratio, hazard ratio
relative measure below 1
negative association, protective effect
decreased risk, decreased odds, decreased rate
relative measure of 1
indicates no effect (dividing something by itself is 1)
relative measure above 1
positive association, harmful effect
increased risk, increased odds, increased rate
absolute measures
describe the actual difference in risk or rate of an outcome between two groups
Comparison through subtraction
Dependent on prevalence
e.g., Risk difference/ absolute risk reduction, attributable risk
PAF
Populational Attributable Fraction (PAF)
how much disease could be prevented among the total population if we removed the exposure
incidence formula (exposed)
a/(a+b)
*included in rr
incidence formula (unexposed)
c/(c+d)
𝑇𝑜𝑡𝑎𝑙 𝑛𝑢𝑚𝑏𝑒𝑟 𝑜𝑓 𝑒𝑣𝑒𝑛𝑡𝑠 / 𝑇𝑜𝑡𝑎𝑙 𝑛𝑢𝑚𝑏𝑒𝑟 𝑜𝑓 𝑠𝑢𝑏𝑗𝑒𝑐𝑡𝑠 𝑎𝑡 𝑟𝑖𝑠𝑘 𝑎𝑡 𝑡0
*included in rr
relative risk formula
IPexposed / IPunexposed
a/(a+b) / c/(c+d)
*included
attributable risk formula
IPexposed - IPunexposed
a/(a+b) - c/(c+d)
*included
incidence total formula
IPexposed + IPunexposed
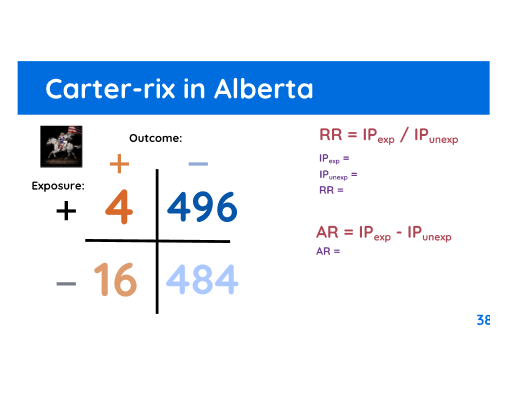
IPexp = 4/500 = 0.008
IPunexp = 16/500 = 0.032
RR = 0.008/0.032 = 0.25 , protective effect because it is less than 1
AR = 0.008 - 0.032 = -0.024 , -24 cases per 1000 people
IPtotal = 4 + 16 = 20
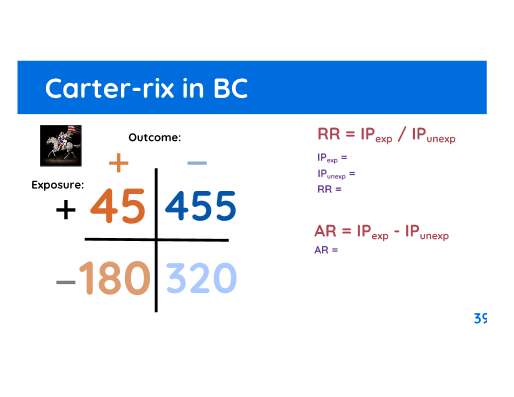
IPexp = 45/(45+455) = 0.09
IPunexp = 180/(180+320) = 0.36
RR = 0.09/0.36 = 0.25 , protective effect because it is less than 1
AR = 0.09 - 0.36 = -0.27 , -270 cases per 1000 people
IPtotal = 180 + 45 = 225
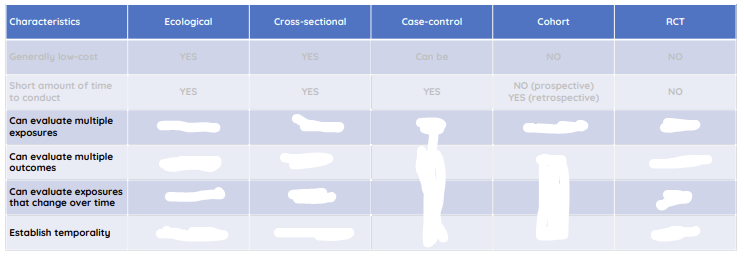
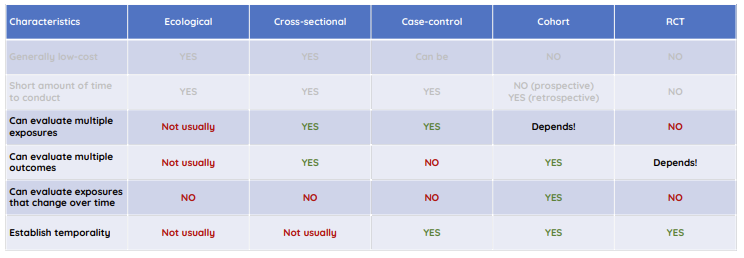
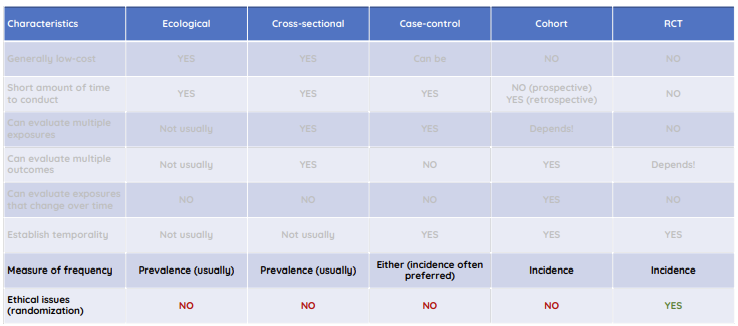
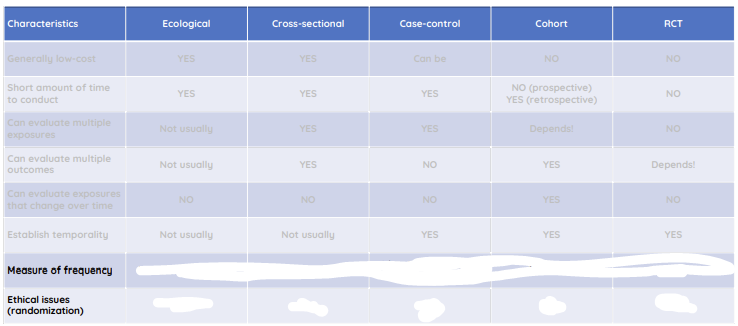
rank study designs from least to most level of cost, time, complexity, and ability to control bias
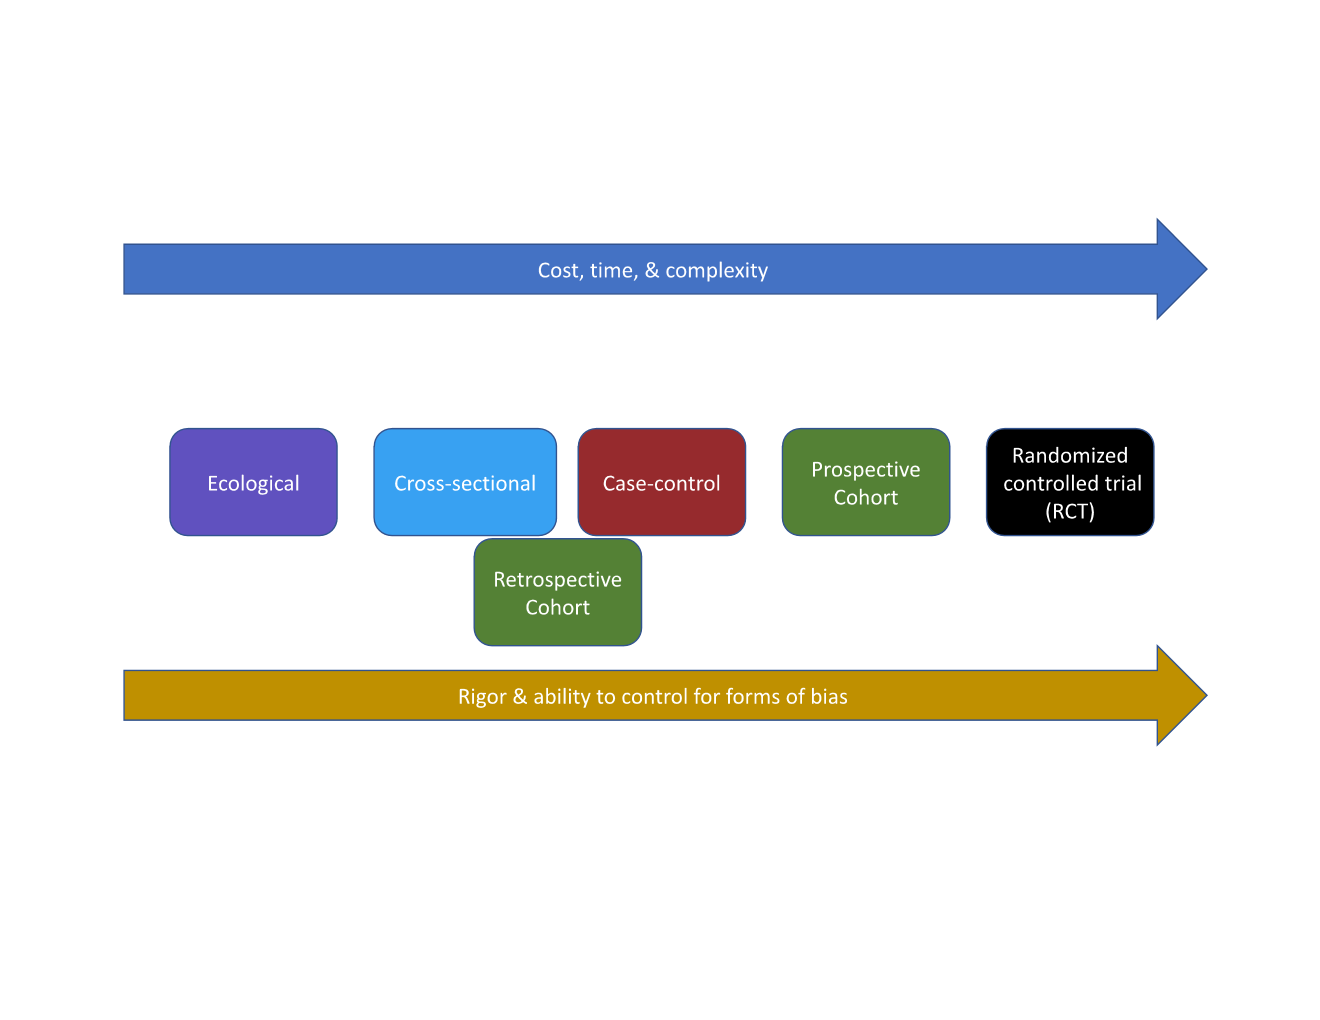
ecological study
explores correlations between aggregate (group level) exposure and outcome
unit of analysis: group (e.g., countries, provinces, neighbourhoods, schools, clinics)
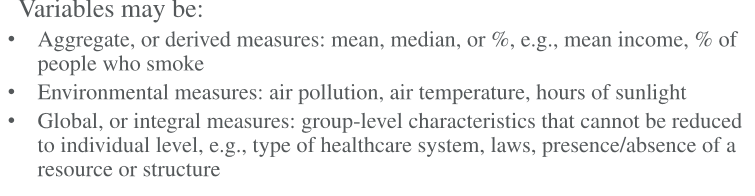
ecological study variables
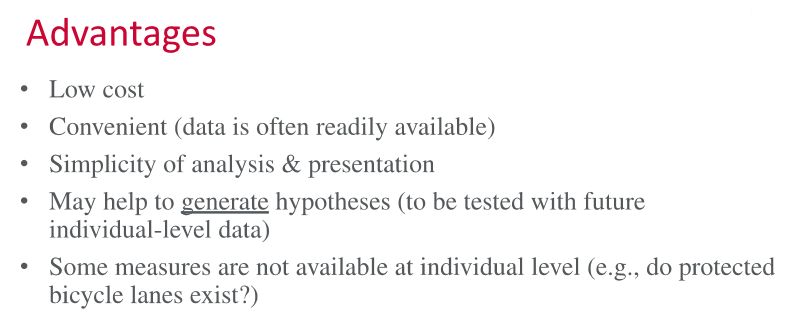
ecological study advantages
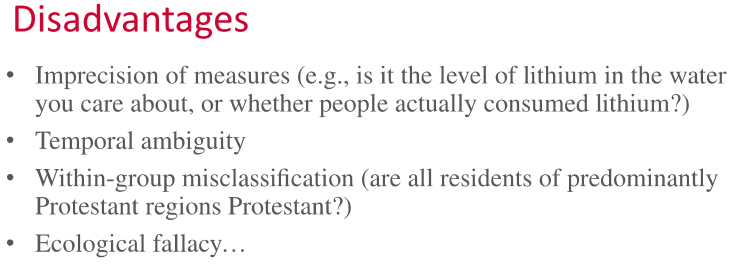
ecological study disadvantages
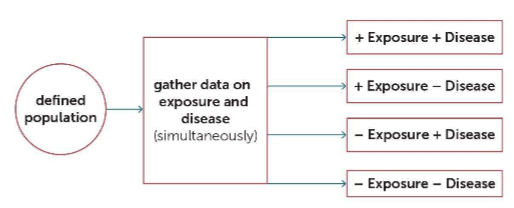
cross-sectional study
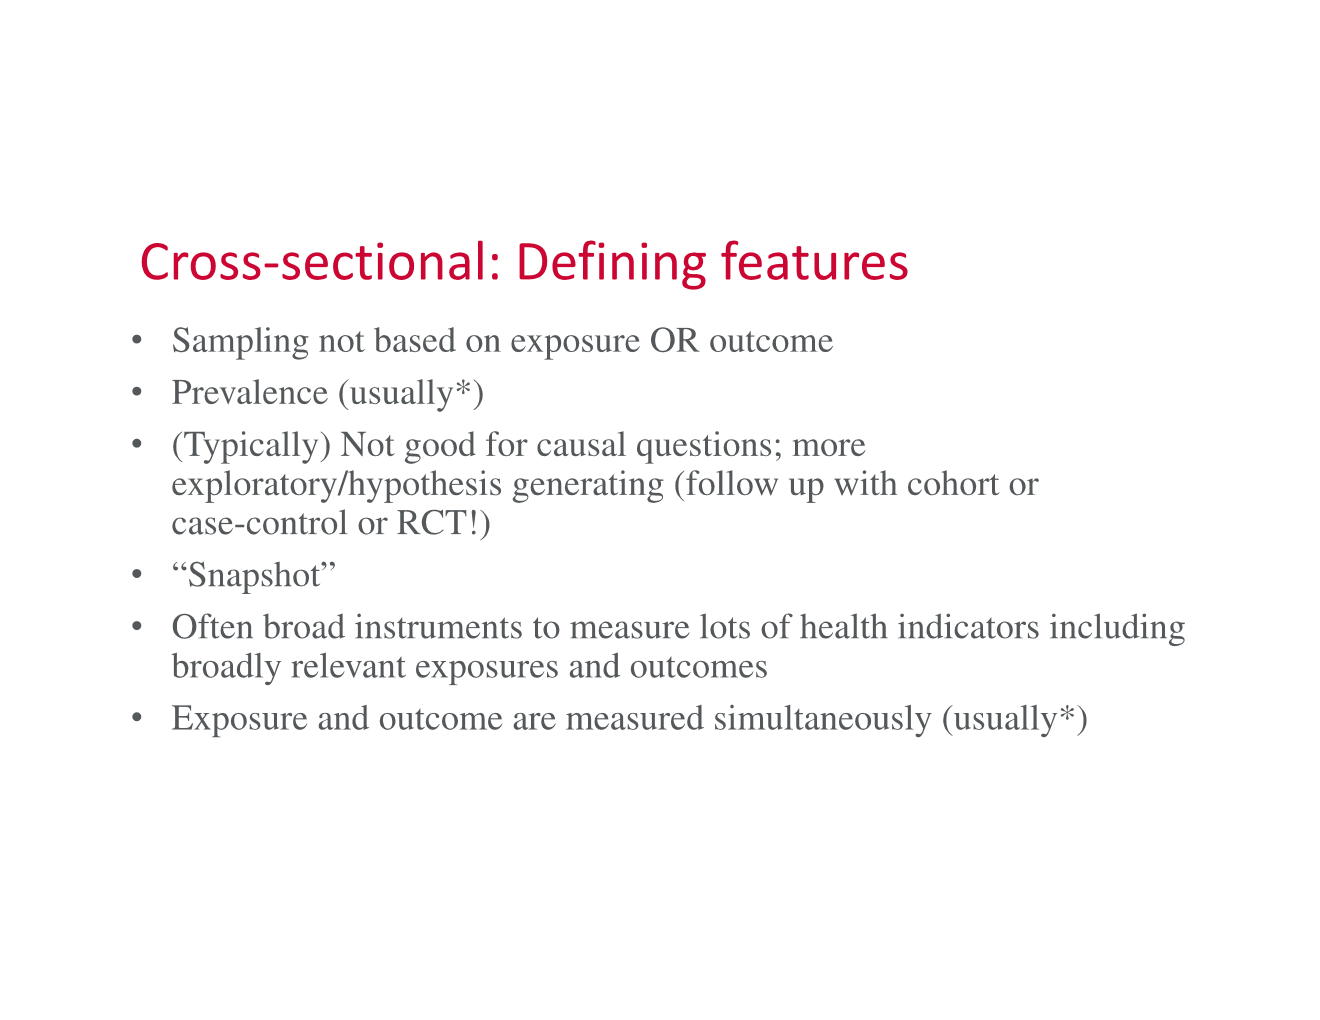
cross-sectional study design
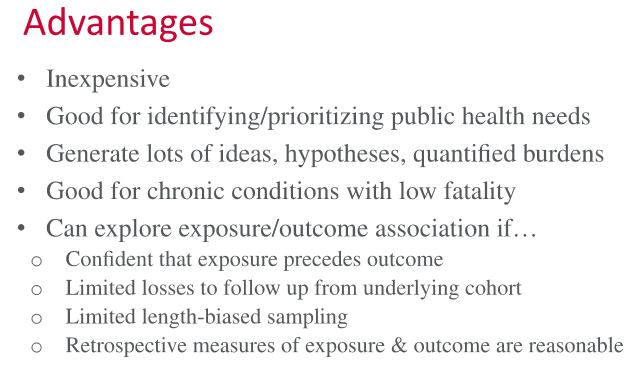
cross-sectional study advantages
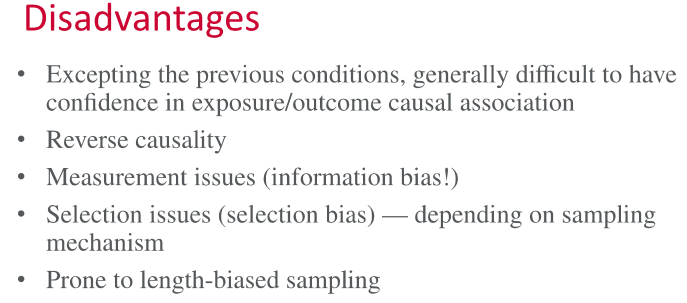
cross-sectional study disadvantages
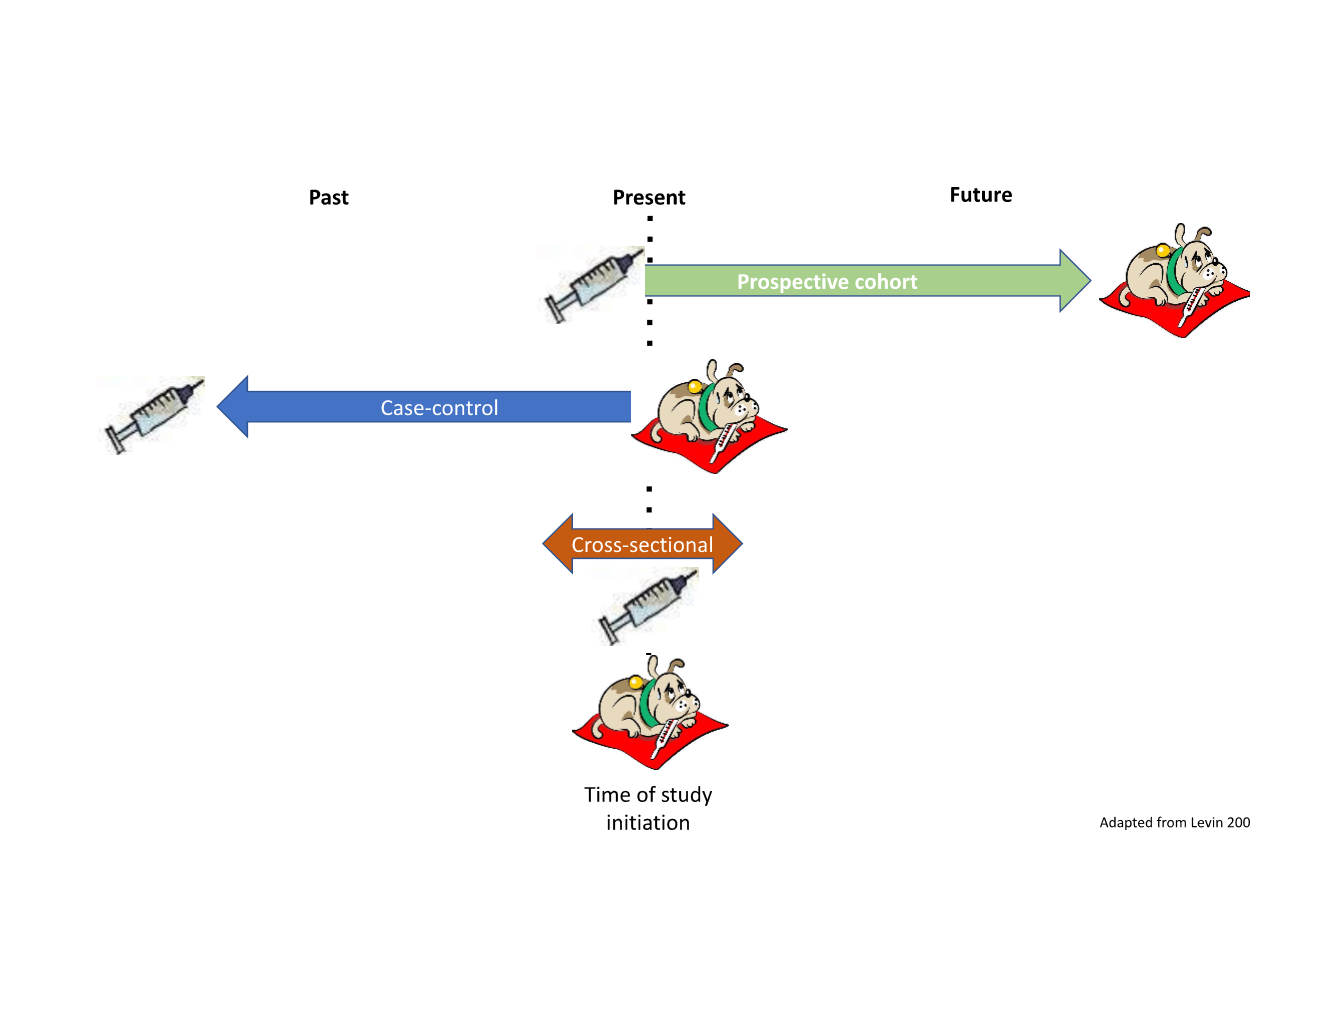
exposure vs. outcome for case-control, cross-sectional, and prospective cohort studies
case control study
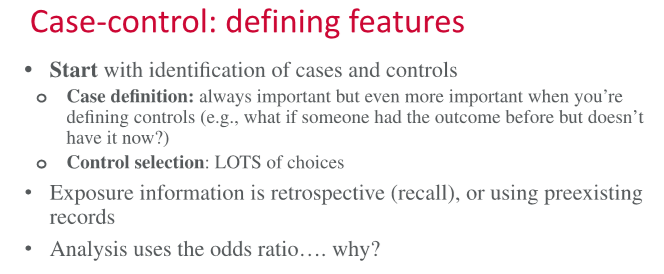
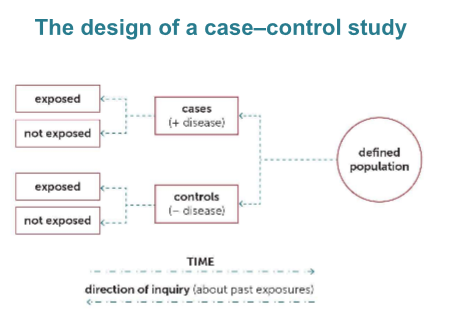
case-control study design
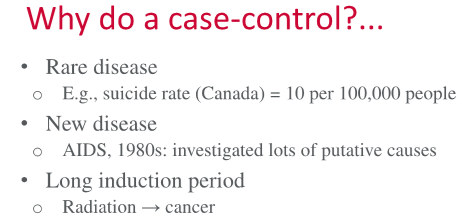
when/why would we do a case-control study?
examples of ways to sample controls:
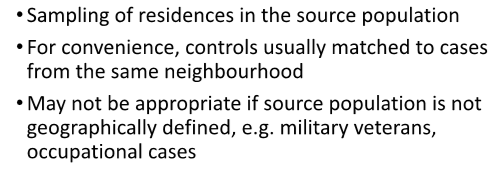
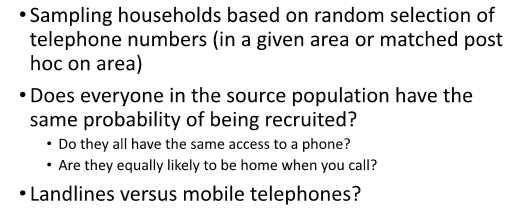
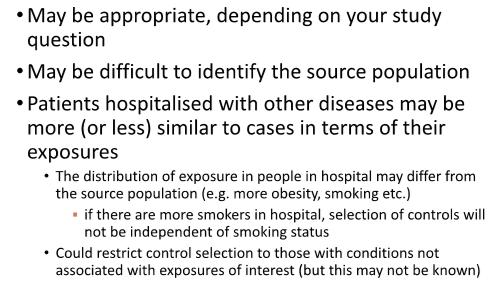
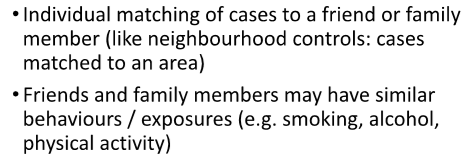
neighbourhood controls, random-digit dialing, hospital/clinic-based controls, friend/family controls
neighbourhood controls
random-digit dialling
hospital-based (or clinic-based) controls
friend or family controls
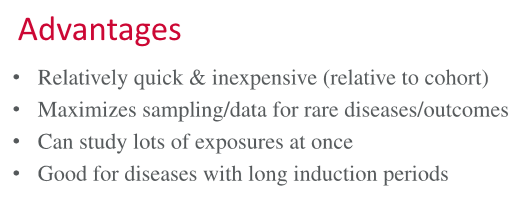
case-control study advantages
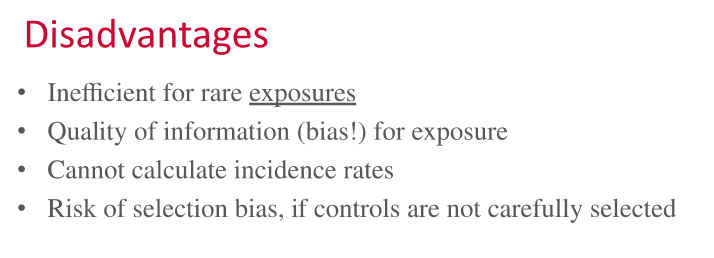
case-control study disadvantages
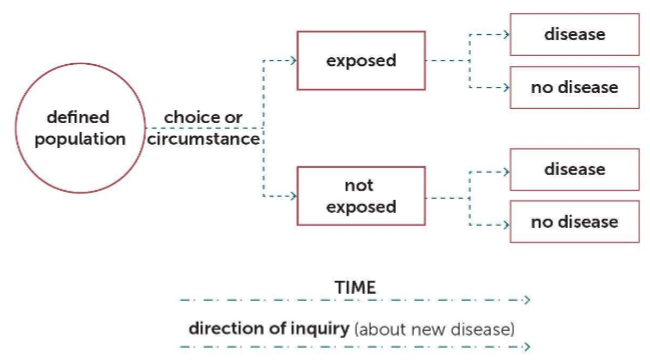
cohort study
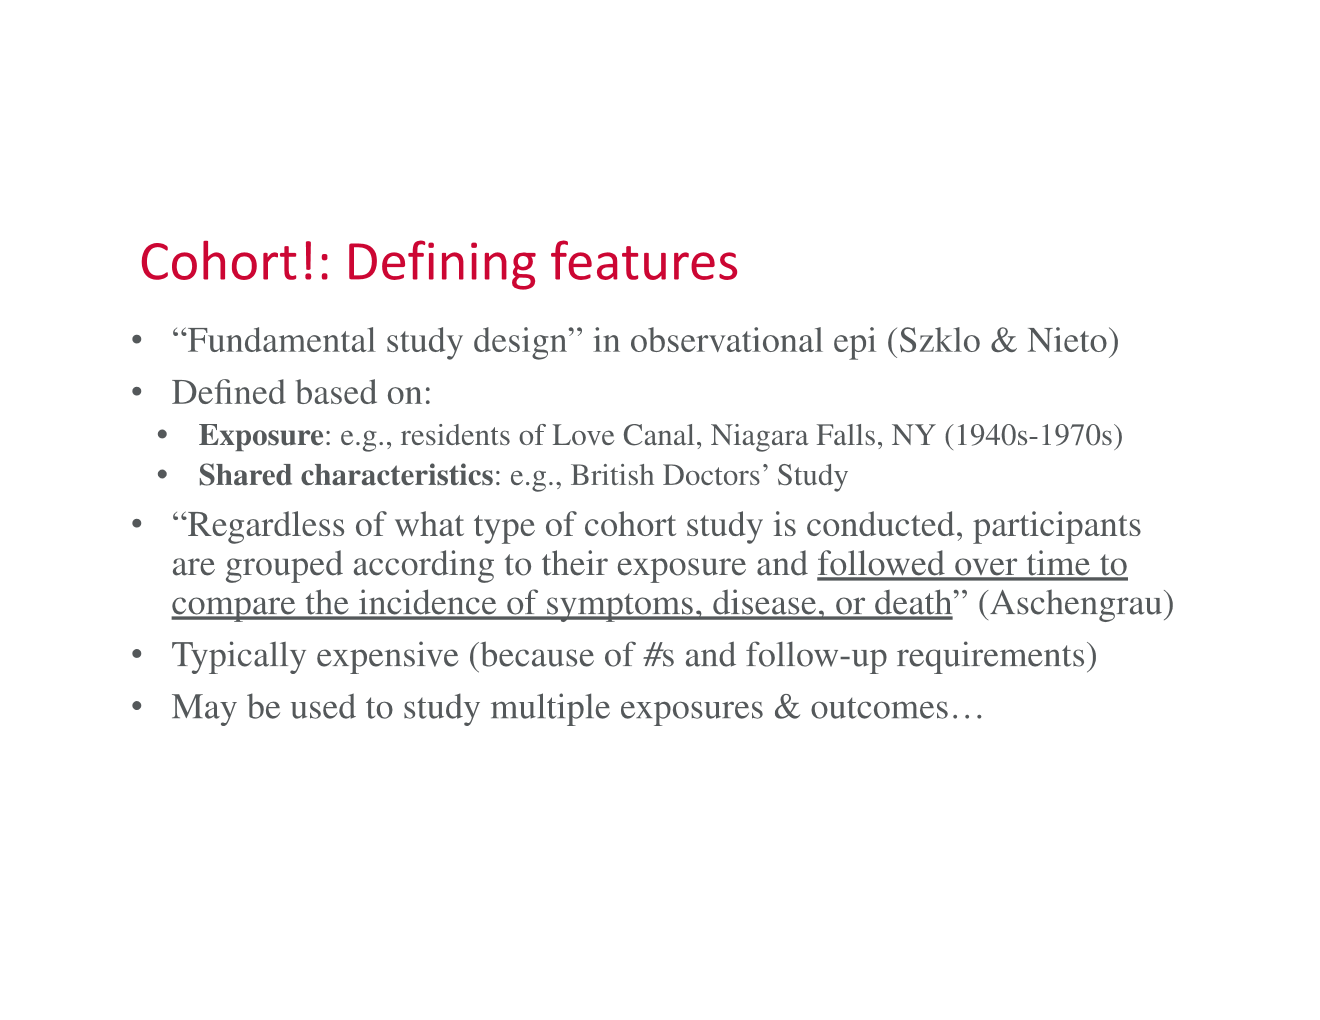
cohort study design
prospective vs. retrospective
prospective: study starts at the exposure
retrospective: study starts after the outcome
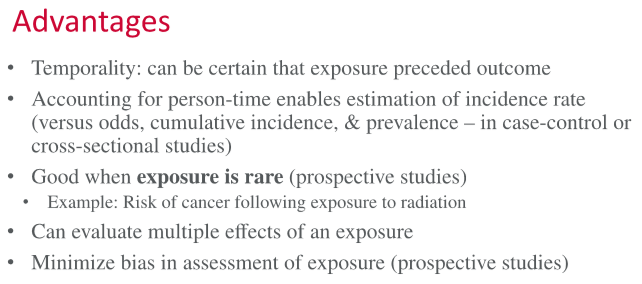
cohort study advantages
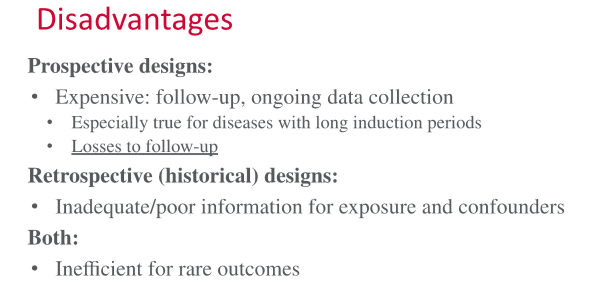
cohort study disadvantages
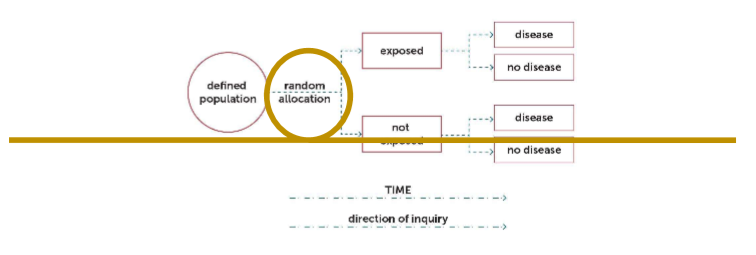
randomized control trial
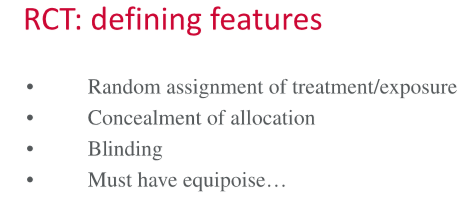
randomized control trial design
randomized control trial advantages
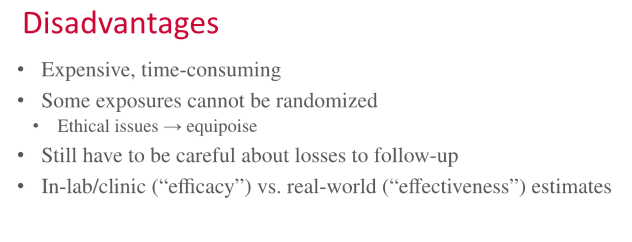
randomized control trial disadvantages