AP Bio Experimental Design & Statistics
1/21
There's no tags or description
Looks like no tags are added yet.
Name | Mastery | Learn | Test | Matching | Spaced |
|---|
No study sessions yet.
22 Terms
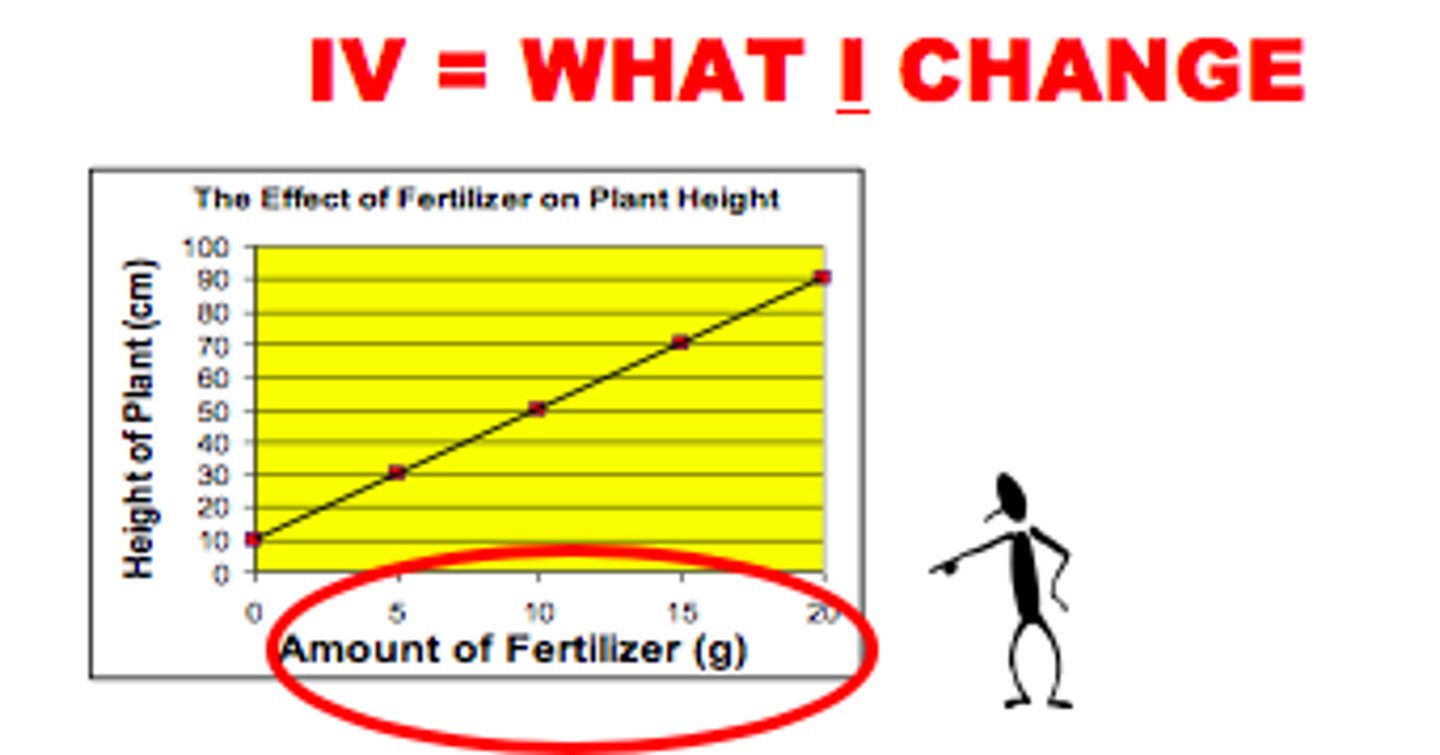
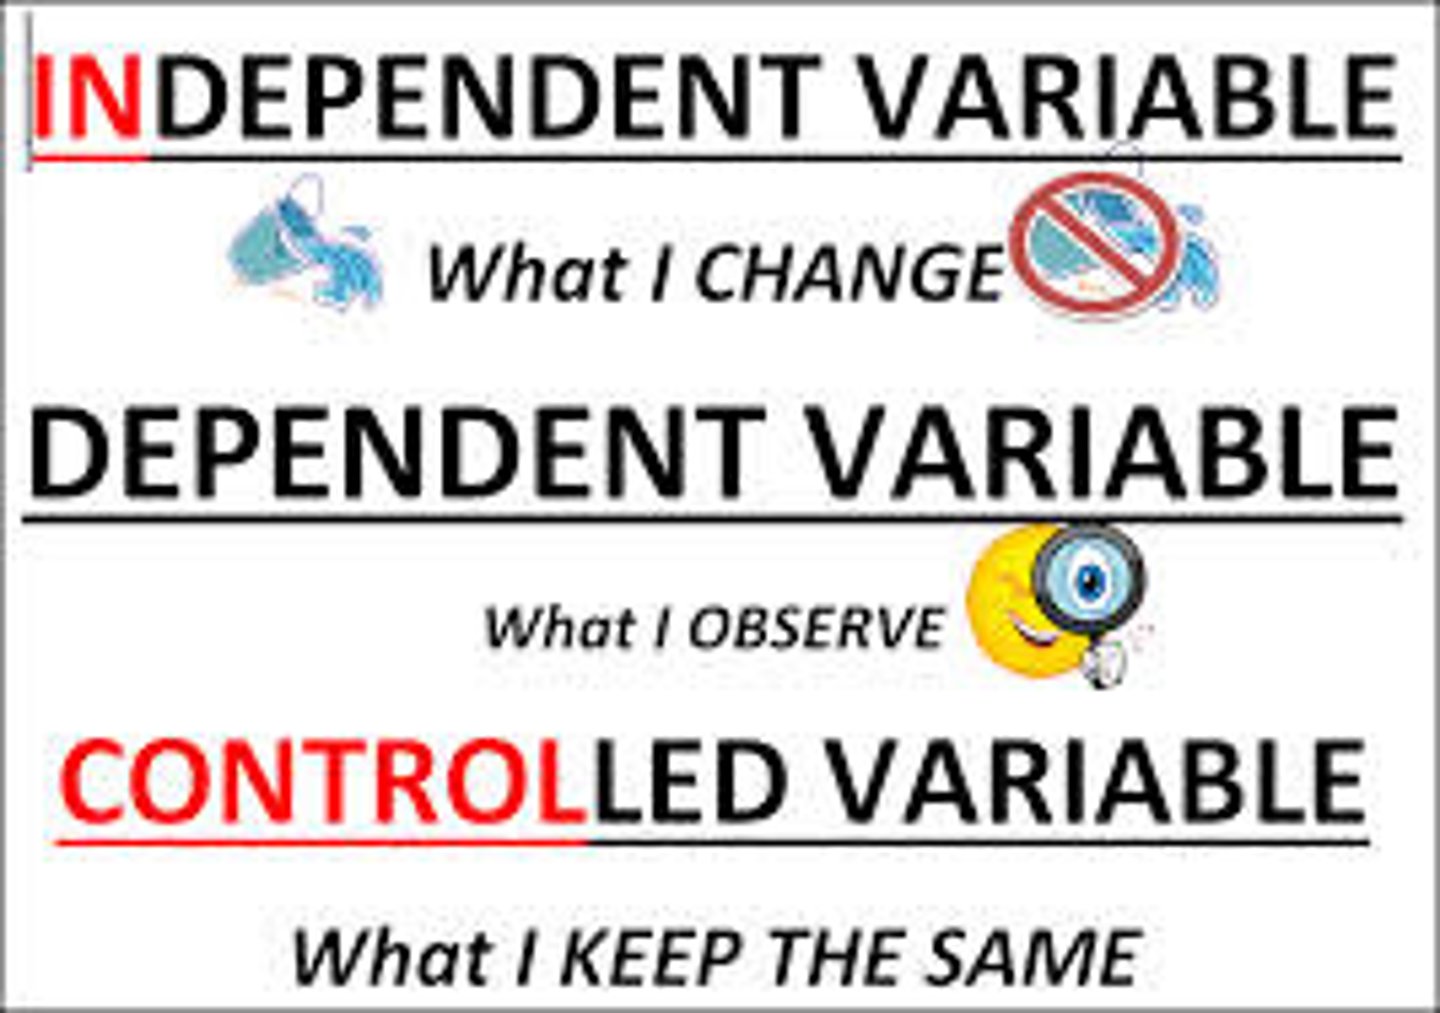
Independent variable (IV)
The experimental factor that is manipulated; the variable whose effect is being studied. Can only have 1 IV in experiment. Graphed on the x-axis.
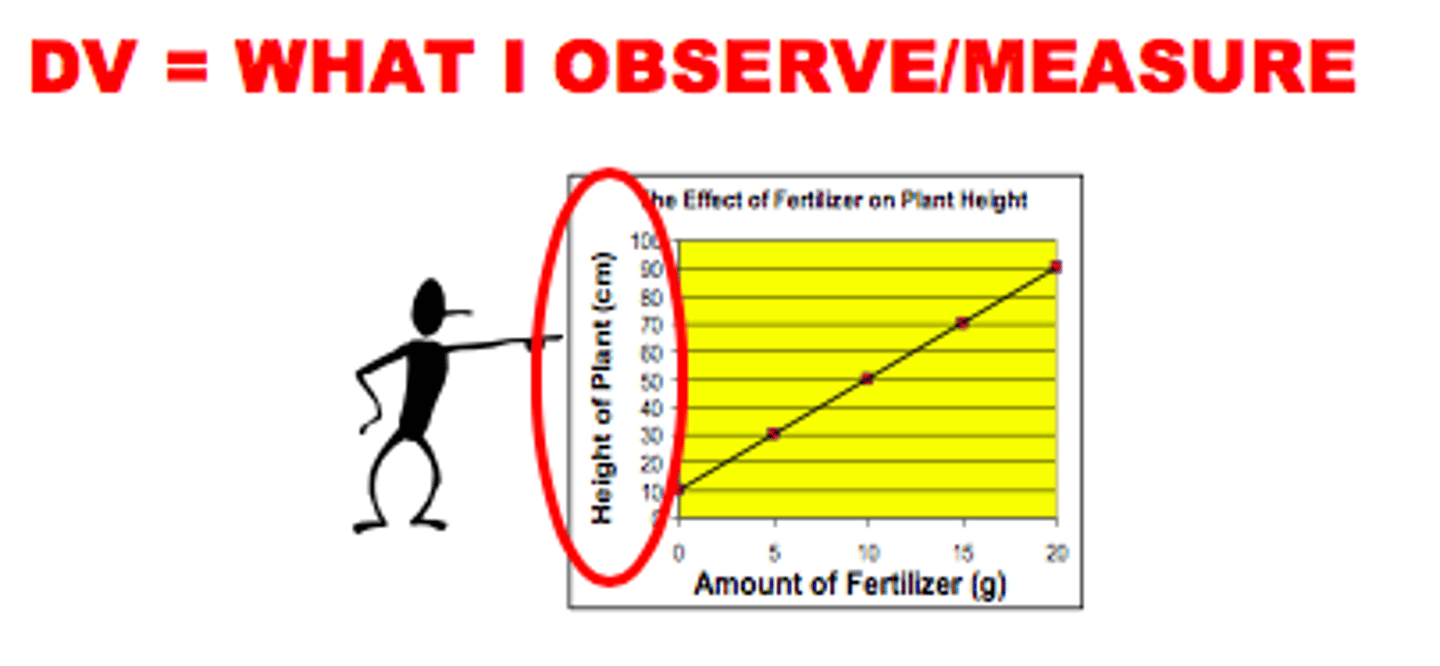
Dependent Variable (DV)
The variable that responds to manipulations of the independent variable. It is the data that is measure or recorded. Can have more than 1 DV. Graphed on y-axis.
standardized or controlled variables
factors that are held constant in an experiment so that changes in the dependent variable can be attributed to the independent variable.
levels of treatment
values set for the independent variable for the experimental group; how the researcher varies the independent variable
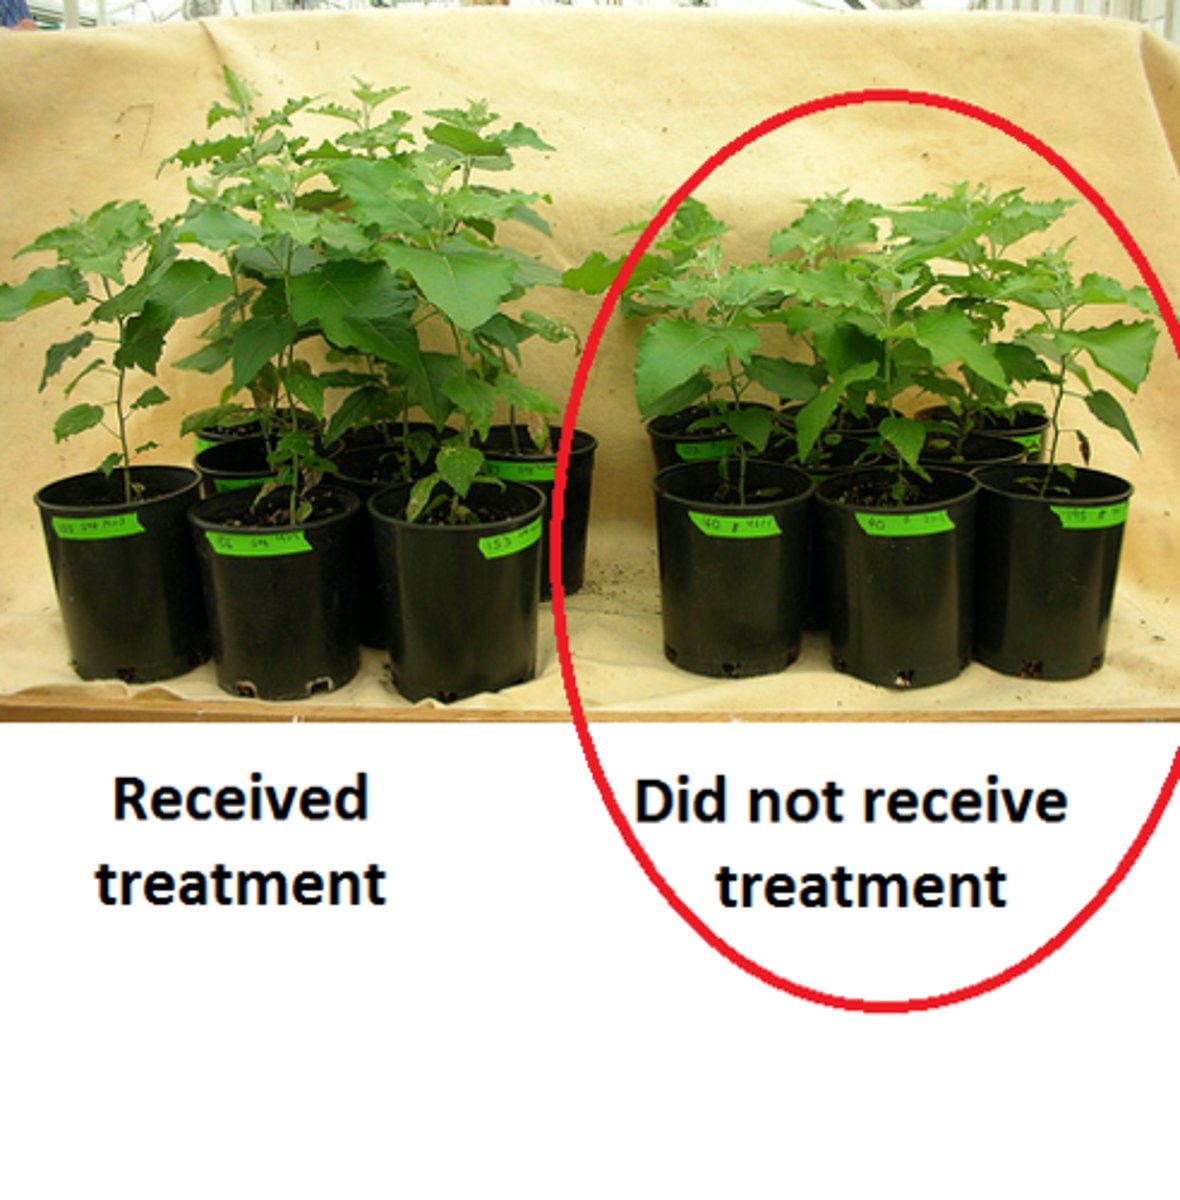
experimental group
In an experiment, the group that is exposed to the treatment, that is, to one version of the independent variable.
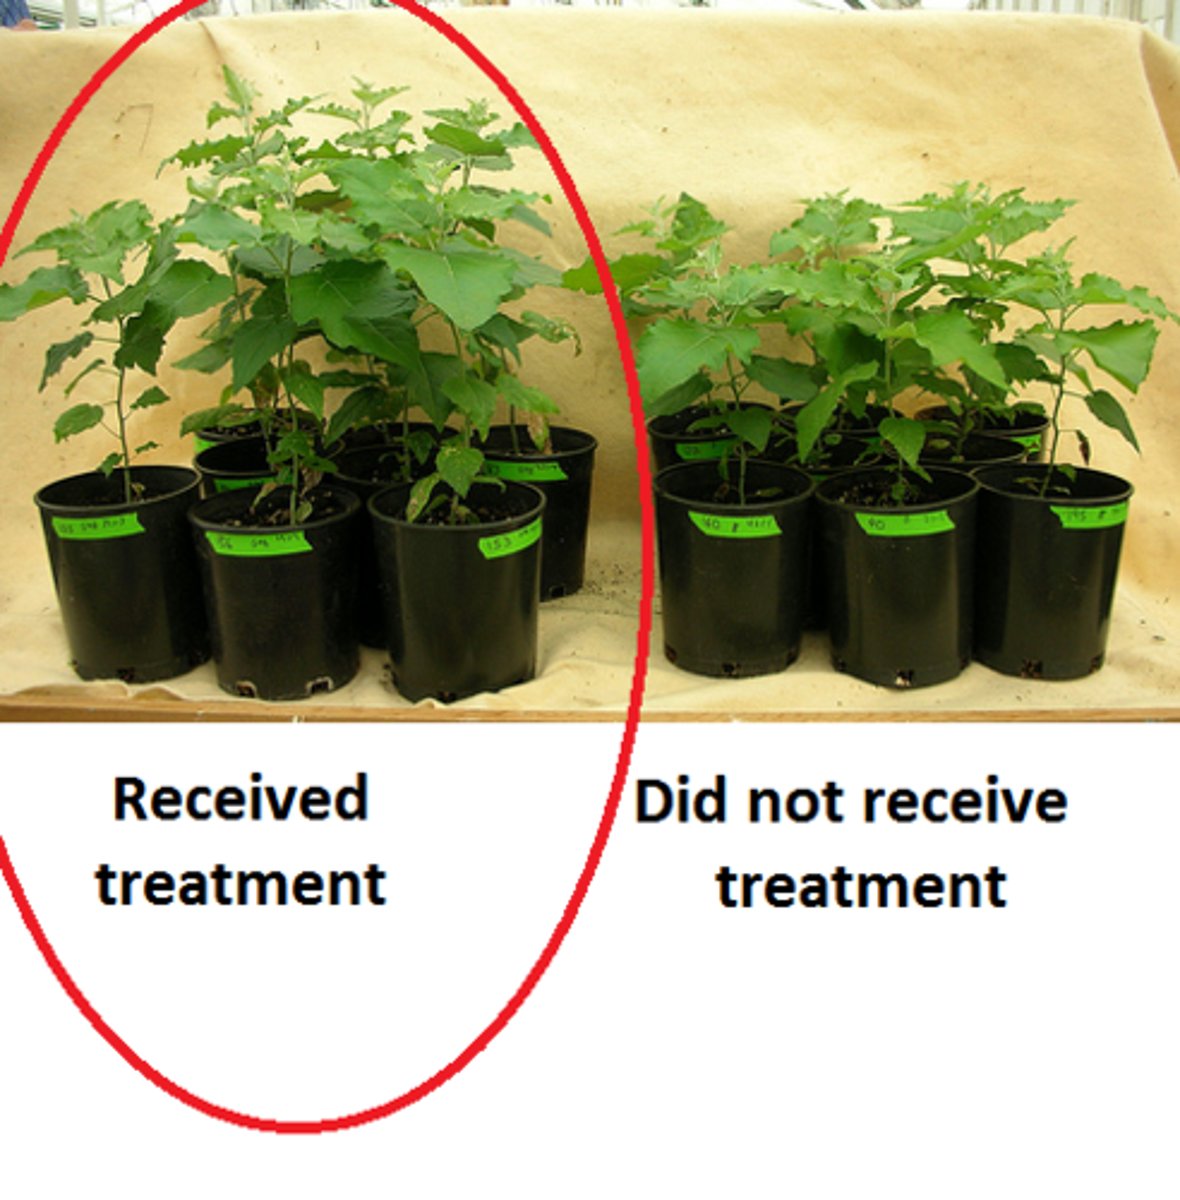
control group
In an experiment, the group that does not receive the independent variable. Contrasts with the experimental group and serves as a comparison for evaluating the effect of the treatment.
negative control
Control group where conditions produce a negative outcome. Negative control groups help identify outside influences which may be present that were not accounted for when the procedure was created.
positive control
Group expected to have a positive result, allowing the researcher to show that the experimental set up was capable of producing results.
Statistics
The study of the collection, organization, analysis, interpretation and presentation of data

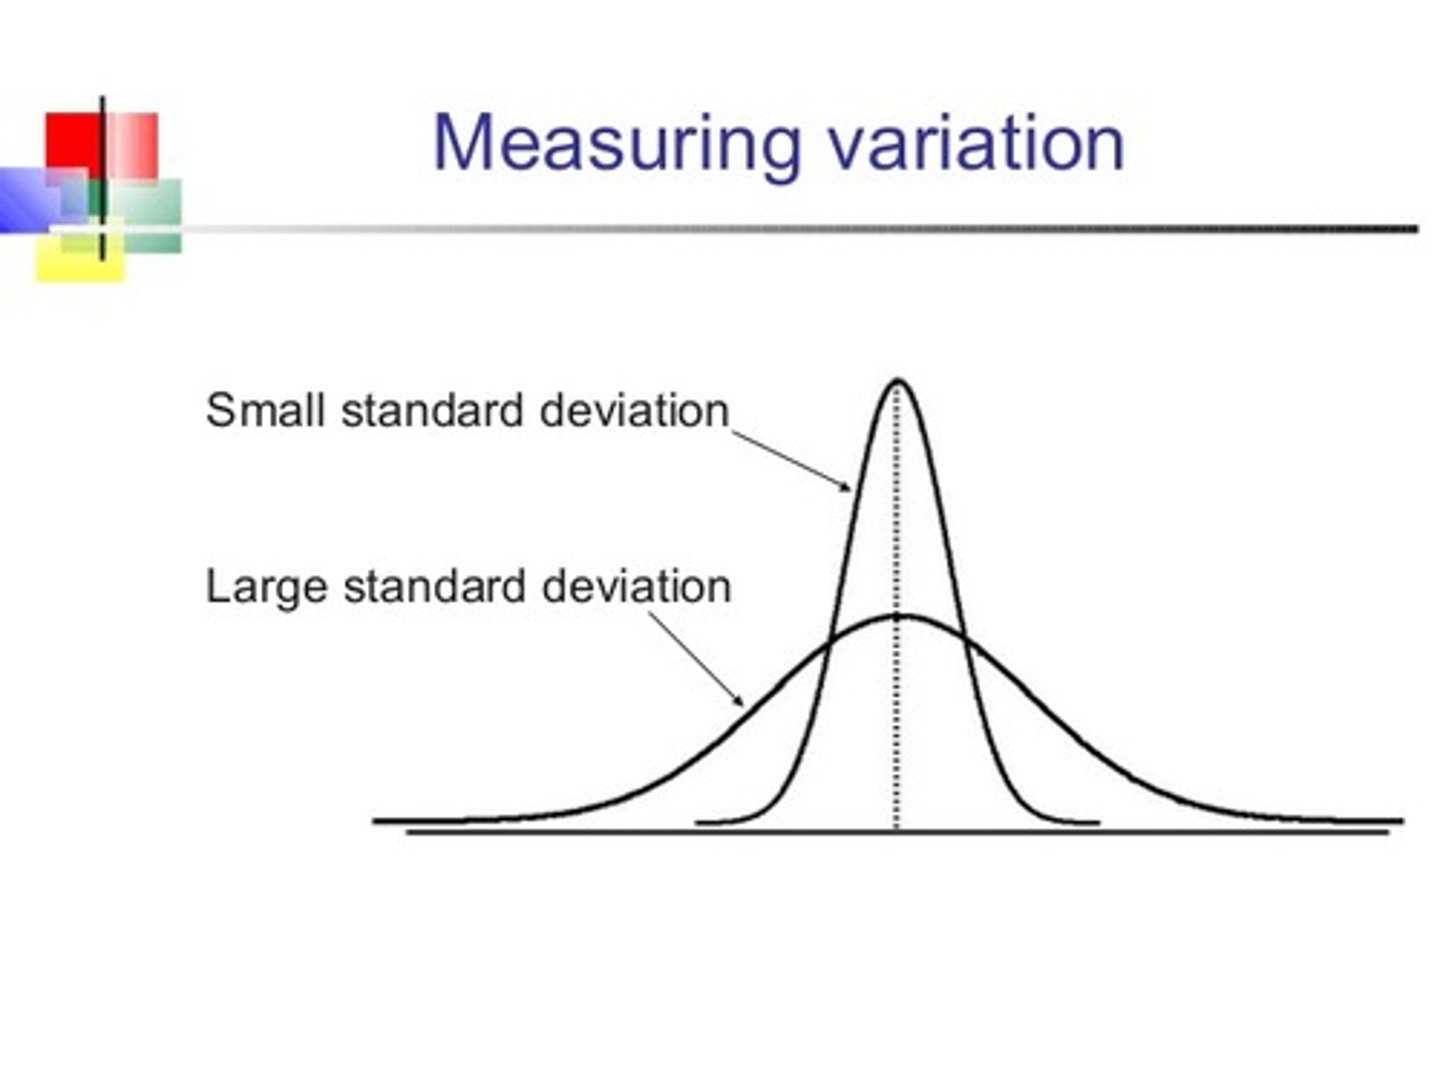
Standard Deviation
a measure of variability that describes an average distance of every score from the mean
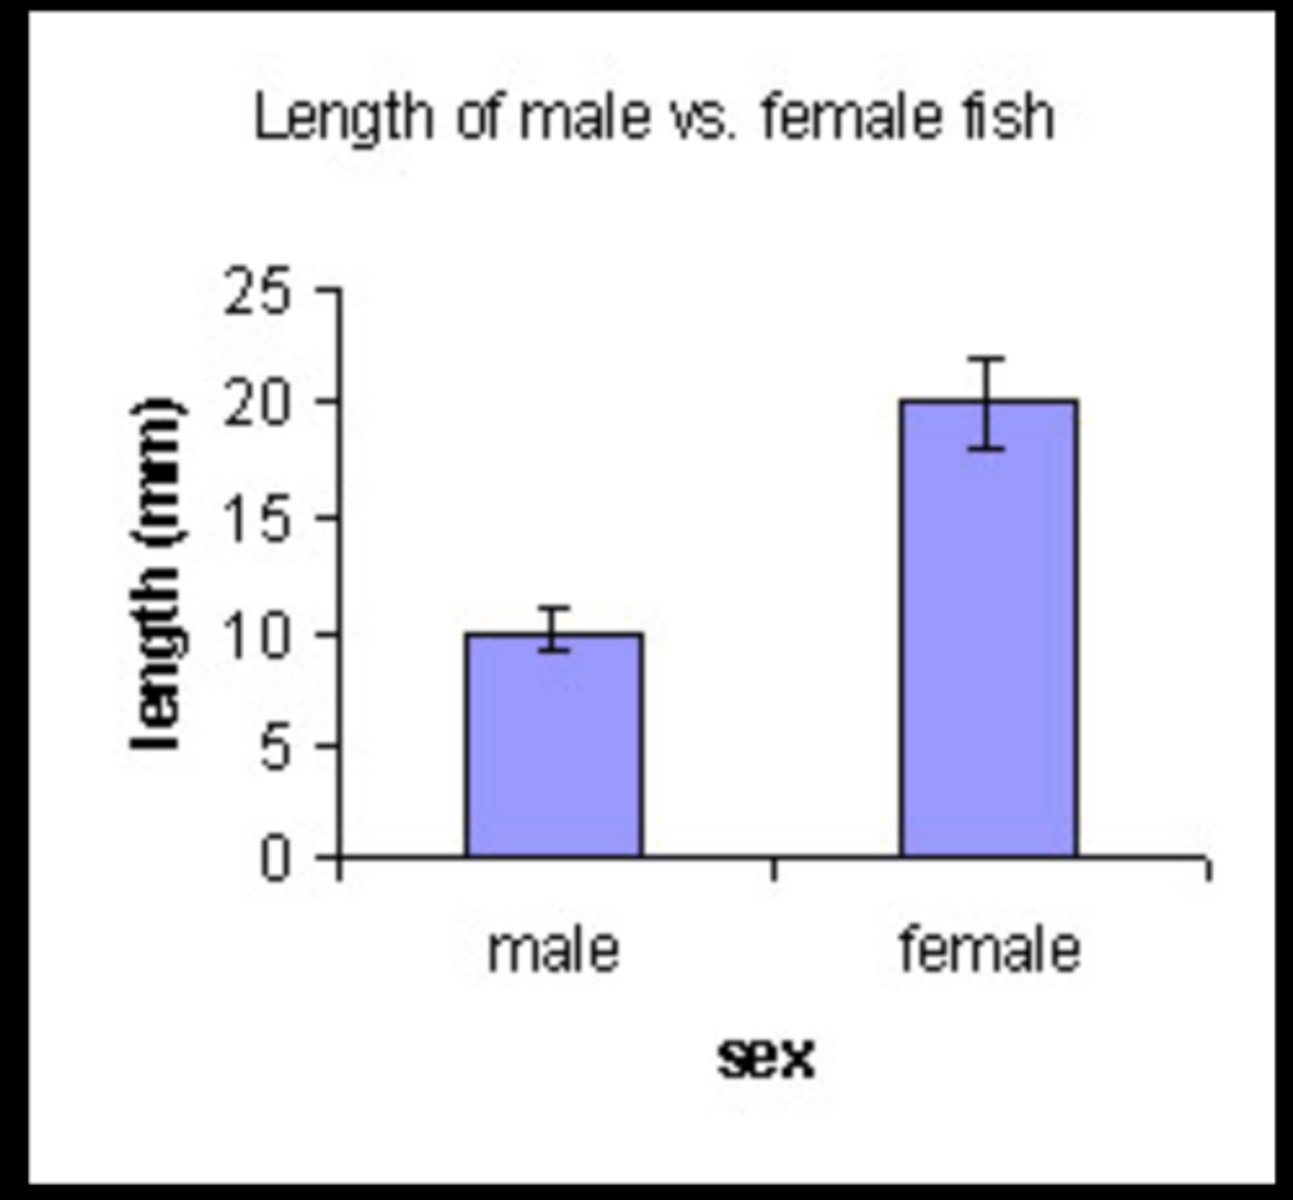
Error bars
Graphical representation of the variability of data and are used on graphs to indicated the error, or uncertainty in a reported measurement.
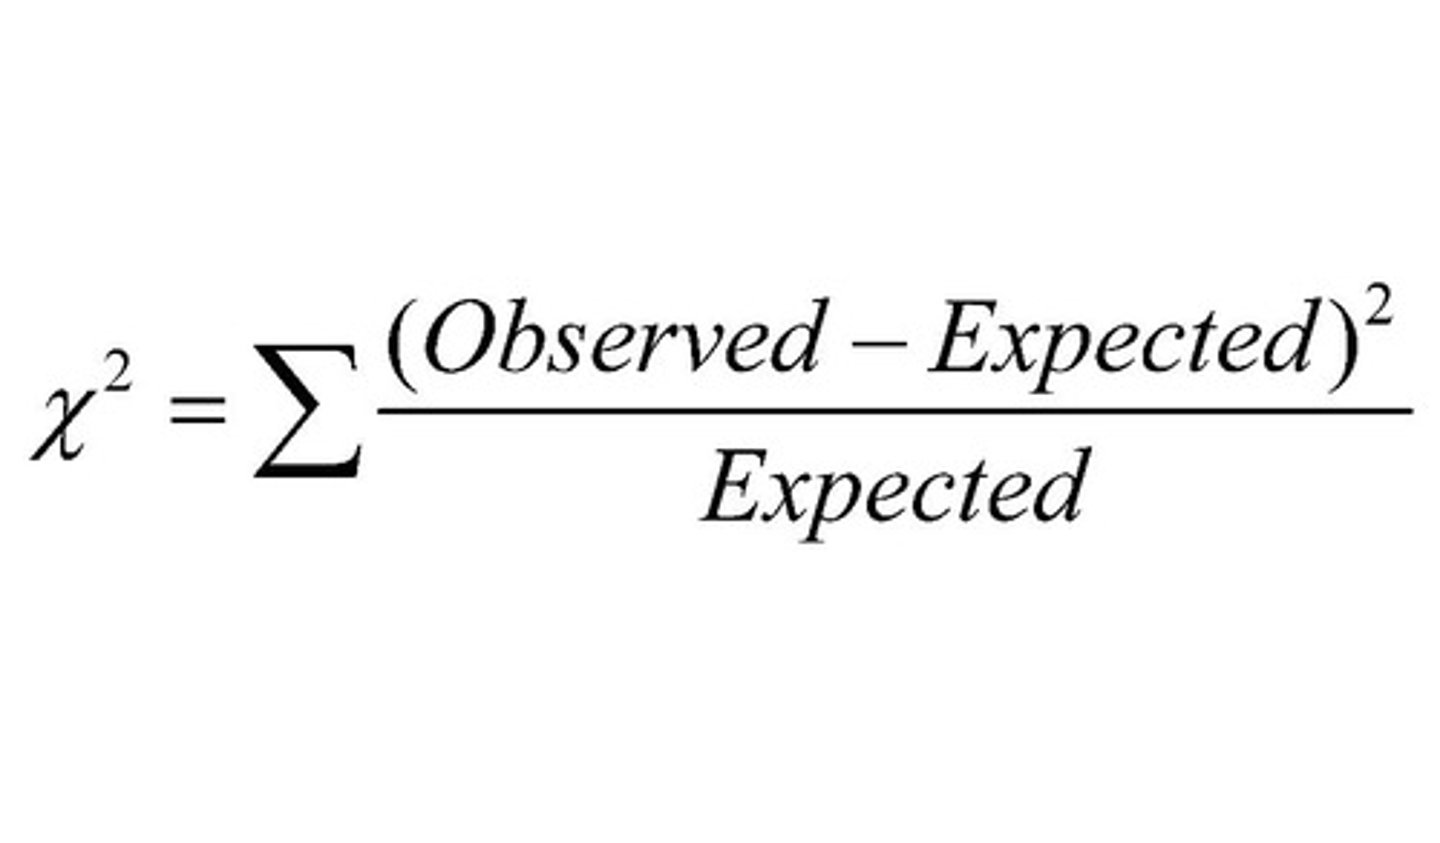
Chi-square test
A statistical method used to calculate whether there is a significant difference between observed and expected results.
null hypothesis
the hypothesis that there is no difference between specified groups (or data sets), any observed difference being due to sampling or experimental error. The independent variable has no effect on the dependent variable.

alternative hypothesis
The hypothesis that states there is a difference between specified groups (or data sets)
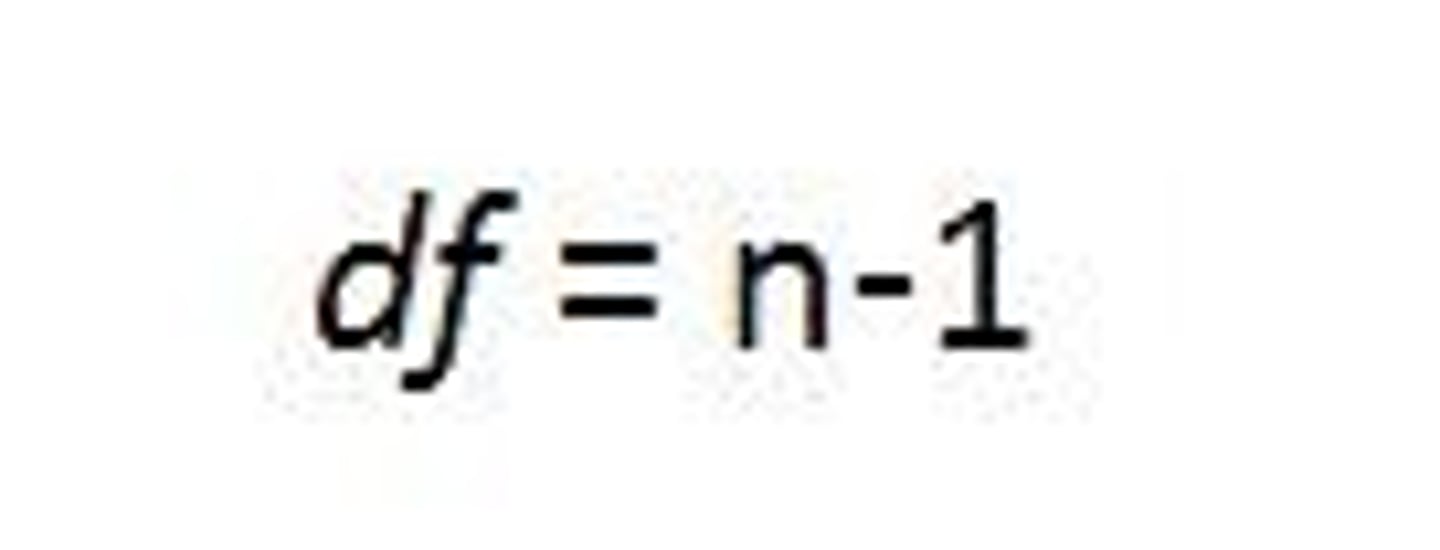
degrees of freedom
number of scores that can vary in the calculation of a statistic. Are equal to the number of distinct possible outcomes minus one
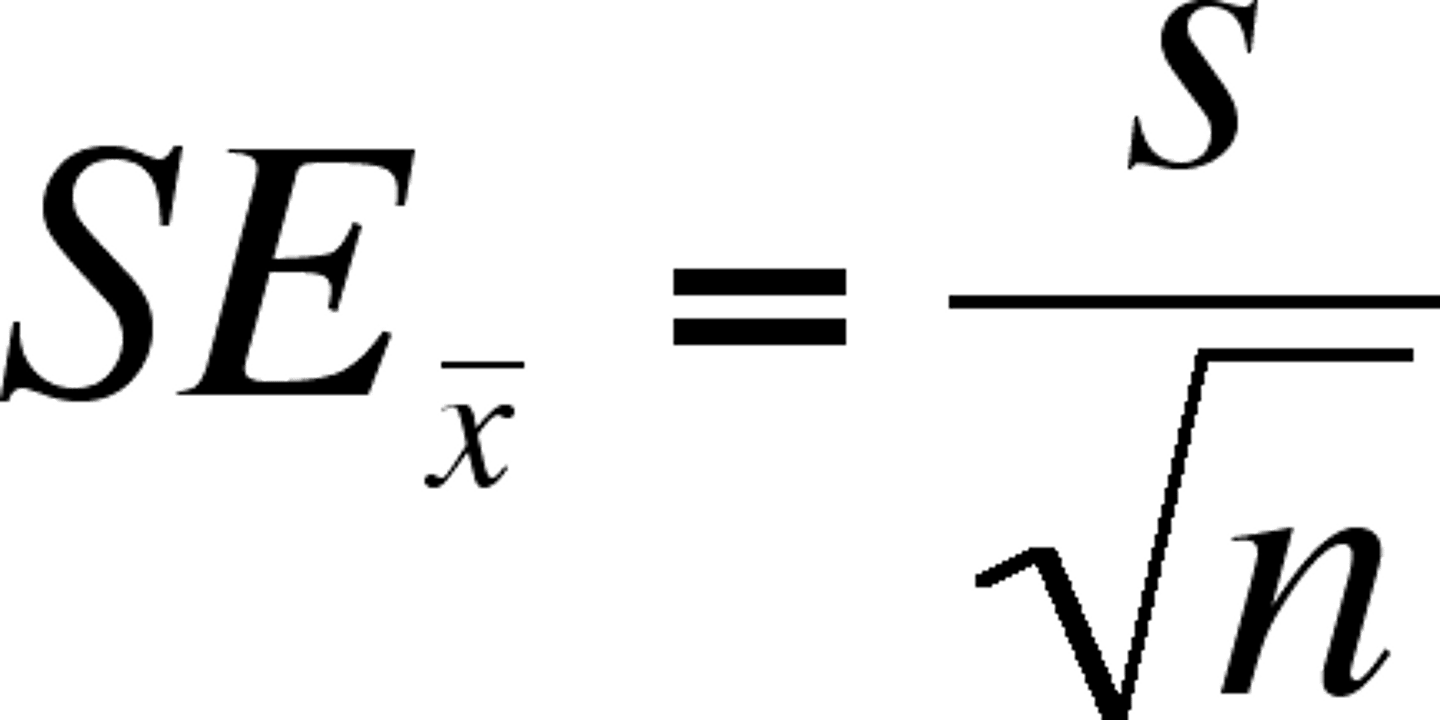
Standard Error of the mean (SEM)
the standard deviation of the sampling distribution of sample means
95% confidence interval
the range within which the true population mean lies, with 95% certainty; Mean +/- 2SEM

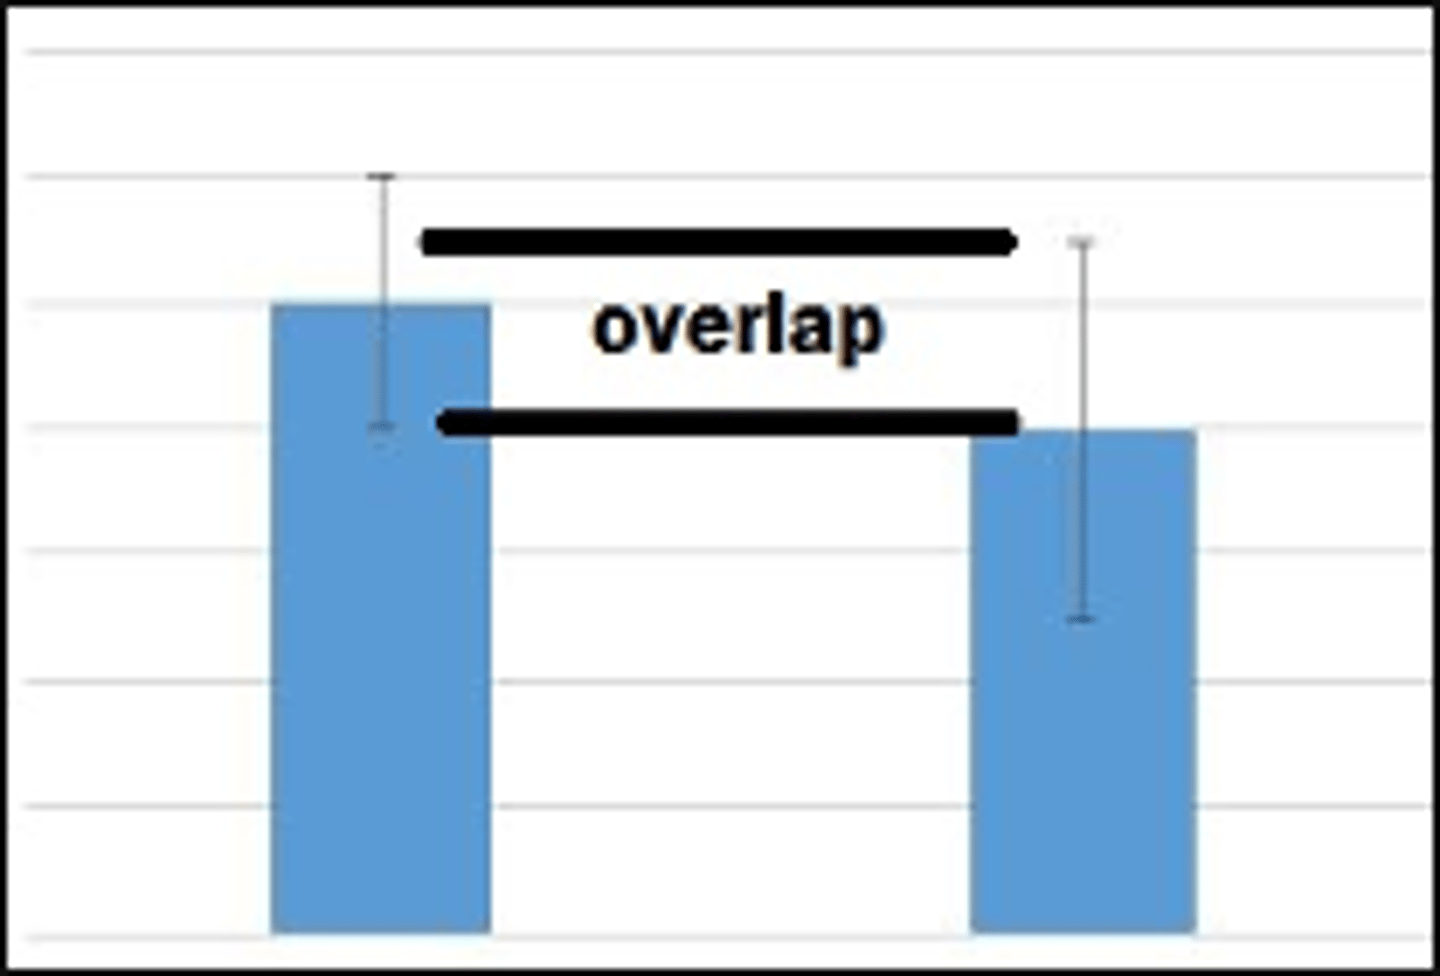
Error bars overlap
the difference is not statistically significant between the two groups. Fail to reject null hypothesis
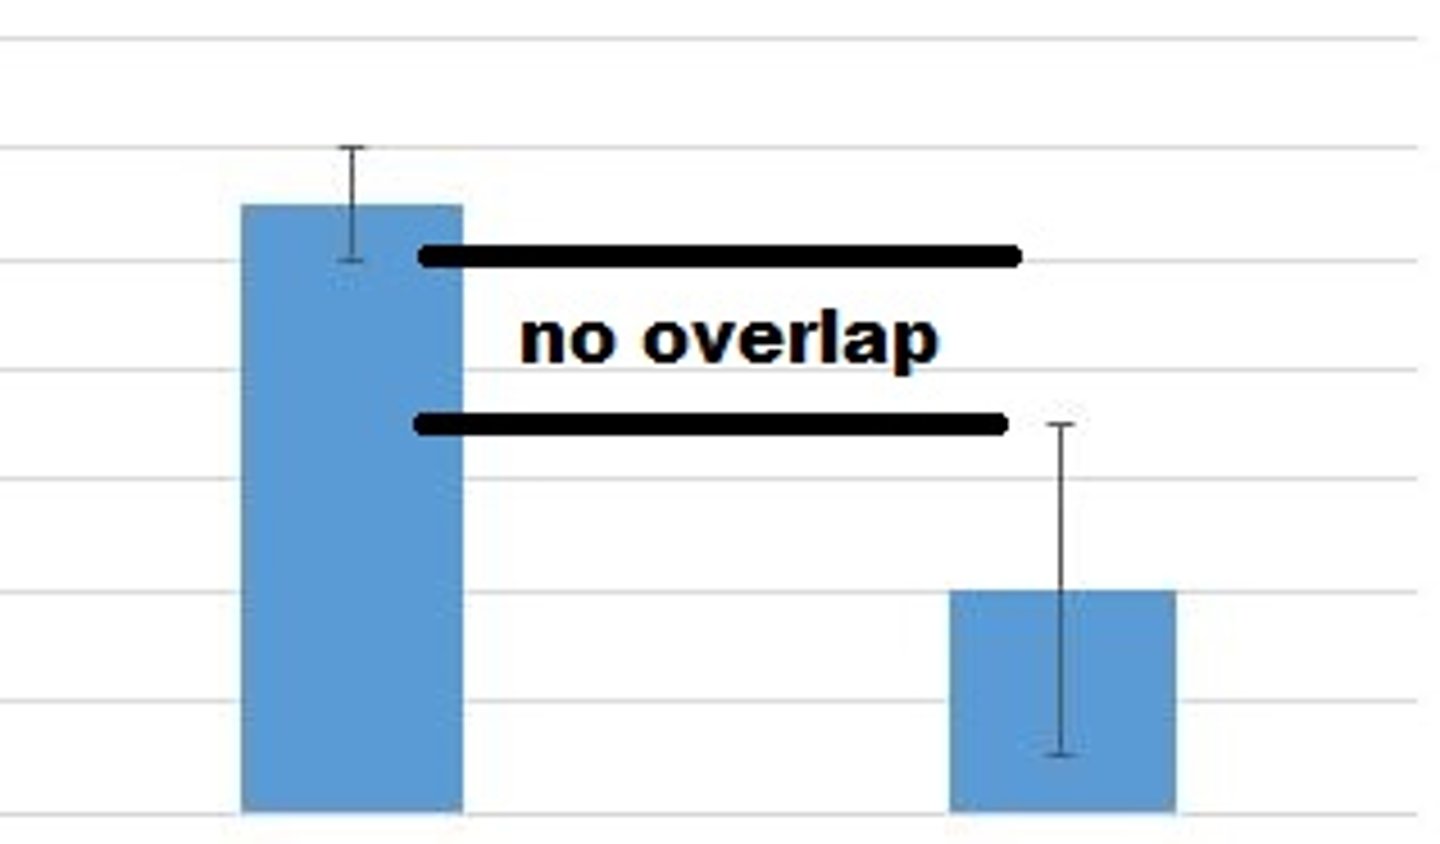
Error bars do NOT overlap
there is a statistically significant difference between the two groups. Reject the null hypothesis.
sample size
The number of subjects used in an experiment or study. Generally, the larger the better.

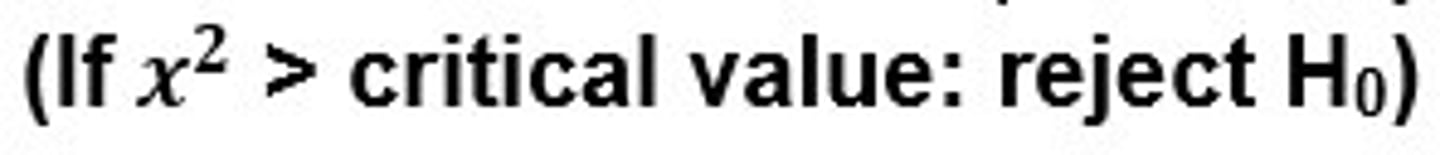
reject the null hypothesis
Chi-square value is greater than the critical value. There is a significant difference between the observed and expected results of the groups.
fail to reject the null hypothesis
Chi-square value is less than the critical value. There is not a significant difference between the observed and expected results of the groups.
