NPTE research and Evidence based Practice
1/64
Earn XP
Description and Tags
Notes from Therapy ED
Name | Mastery | Learn | Test | Matching | Spaced | Call with Kai |
|---|
No analytics yet
Send a link to your students to track their progress
65 Terms
indepdent variable
Variable that stands alone and isn’t changed by any other variables
EX: age and time
Dependent variable
variable that is being studied and measured; changes when the indepenedent variable is manipulated
EX: height at different ages
Categorical variables
variables categorized by traits that do not have inherent numerical variables. such as Nominal scale and ordinal scale
Nominal scale
classifies variable or scores into two or more mutually exclusive categories based on a common set of characteristics.
EX: sex, race or ethnicity
Ordinal scale
classifies and ranks variables or scores in terms of the degree to which they possess a common characteristics
EX: manual muscles grades as normal, good, fair, poor, trace, or zero
Continuous variables
characteristic with inherent numerical value. include Interval and ratio scales
Interval scale
classifies and ranks variables or scores based on the predetermined equal intervals; with no set zero
EX: temperature, IQ test
Ratio Scale
classifies and ranks variables or scores based on equal intervals and a true zero point
EX: ROM, Scales for weight, force production using a dynamometer
Cross-sectional research
data are collected on an individual or groups of individuals at a single point in time. Re
Retrospective Research
Individuals or groups of individuals are enrolled in the study at a particular timepoint or following the occurrence of a target event and historical data are collected. the study proceeds backwards in time. Data are typically collected from subject interview or review of records
Prospective Research
individuals or groups of individuals are enrolled in the study at a particular timepoint and followed forward in time to determine if a particular outcome occurs
Descriptive Research
collecting data about conditions, attitudes, or characteristics of subjects or groups of subjects
Examples of descriptive research
case studies, developmental, longitudinal, normative, qualitative research
case studies or clinical reports
indepth investigation of an individual, group or institution
develpmental research
studies of behaviors that differentiate individuals ar different levels of age, growth and maturation
normative research
investigates standards of behavior, standard values for given characteristics of a sample
EX: gait characteristics
Qualitative research
seeks to understand concepts opinions, or experiences related to social phenomena and complex human behavior.
Correlational Research
attemps to determine the presence and magnitude of relationships or associations between two or more variables.
IF a correlation is closer to +1 what does that indicate
The variables are positively correlated
IF a correlation is closer to -1 what does that indicate
Variables are inversely related
IF the correlation is 0 than that means
the variables are not related
Experimental Research
Attempts to define a cause and effect relationship through group comparisons.
Describe a true experimental design
includes random assignment into experimental group or control group. all other experiences are held similar
Describe a cohort design
quasi experimental design, subjects are identified and followed over time for changes/outcomes following exposure to an intervention; lacks randomization, may or may not have a control group
Describe a within subject design AKA repeated measures
subjects serve as their own controls; randomly assigned to treatment or no treatment blocks
Hypothesis
tentative and testable explanation of the relationship between variables
Null Hypothesis
states that no relationship exists between variables. any relationship found is the result of chance or sampling error
When is the null hypothesis rejected
When a significant difference was observed between groups or treatments
What does a sample represent
The larger group from which they were selected
Describe random selection
all individuals in a population have an equal chance of being chosen for a study
Describe a systematic selection
Individuals are selected from a population list by taking individuals at a specified interval EX: every tenth name
What is an Effect Size
the magnitude of the differences between sample means, allows a statistical test to find a difference when one really does exist
Describe Generalizability
degree to which a study’s findings based on a sample apply to an entire population
What is validity
the degree to which a test, instrument or procedure accurately measures what it is supposed to or intended to measure
Face validity
Poorest form of validity; the assumption of validity based on the appearance of an instrument as a reasonable measure of a variable
internal validity
degree to which the observed differences on the dependent variable are the direct result of manipulation of the independent variable and not some other variable.
external validity
the degree to which the results are generalizable to individuals (general population) or environmental settings outside of the experimental study
Content Validity
degree to which an instrument measures an intended content area. determined by expert judgement. requires both item validity and sampling validity
concurrent validity
the degree to which the score on one test are related to the scores on another criterion test with both tests being given at relatively similar times. Involves comparison to the gold standard.
Predicitve validity
degree to which a test is able to predict future performance
contruct validity
the degree to which a test measures an intended hypothetical abstract concept (non-observable)
Describe Reliability
degree to which an instrument measures a phenomenon accurately, dependable, time after time and without variation
INTERrate reliability
The degree to which two or more indepenet rate can obtain the same rating for a five variable
INTRArater reliability
The degree to which one rater can obtain the same rating for a given variable on multiple measurements trials
Describe sensitivity
Tests ability to correctly identify the proportion of individuals who truly have a disease or condition (TRUE POSITIVE). Help to rule out a condition when the test is negative and the condition is not present
Describe Specificity
Test’s ability to correctly identify the proportion of individuals who do NOT have a disease or condition (TRUE NEGATIVE) Help to rule a condition in when the test is positive and the condition is present
equation for +LHR
Sn / (1-Sp)
Equation for -LHR
(1-Sn) / Sp
describe how to utilize a +LHR
a +LHR close to or greater than 10 indicates that a disease is present while a +LHR closer to 1 means a test does not change the odds
describe how to utilize a -LHR
A -LHR <0.1 indicates that disease is absent while a score closer to 1 means the test has little effect.
define Mean and what it is used for
average; appropriate for interval or ratio data
Define mode and what it is used for
midpoint; 50% of scores are above and below; appropriate for ordinal data
define Mode and what it is used for
most frequently occuring score; appropriate for nominal data
Describe Standard Deviation (SD) and what it is used for
a determination of variability (Difference) of scores from the mean.
Subtract each score from the mean, square each difference, add up all the squares and divide by the number of scores. appropriate with interval or ratio data
Describe a normal distribution
symmetrical bell shaped curve; most scores are near the mean within one standard deviation
Standard error
expected chance variation among thee means, result of sampling error
Type I error
the null hypothesis is rejected by the researcher when it is true
Type II error
the null hypothesis is not rejected by the researcher when it is false.
How do you decrease the occurrence of Type I and Type II error
By increasing the statistical power through increasing sample size, increasing the effect size, increasing the alpha level and decreasing observed variance
Describe the strength of relations with positive and negative correlations
Positive correlations (0 to +1) indicates positive correlation so as X increases so does Y. While a negative correlation ( 0 to -1) indicates an inverse relationship. so as X increases Y decreases.
Good reliability >0.75
Moderate reliability =0.50-0.75
Poor reliability <0.50
If examing for relationships (correlations)

If examining for difference between groups
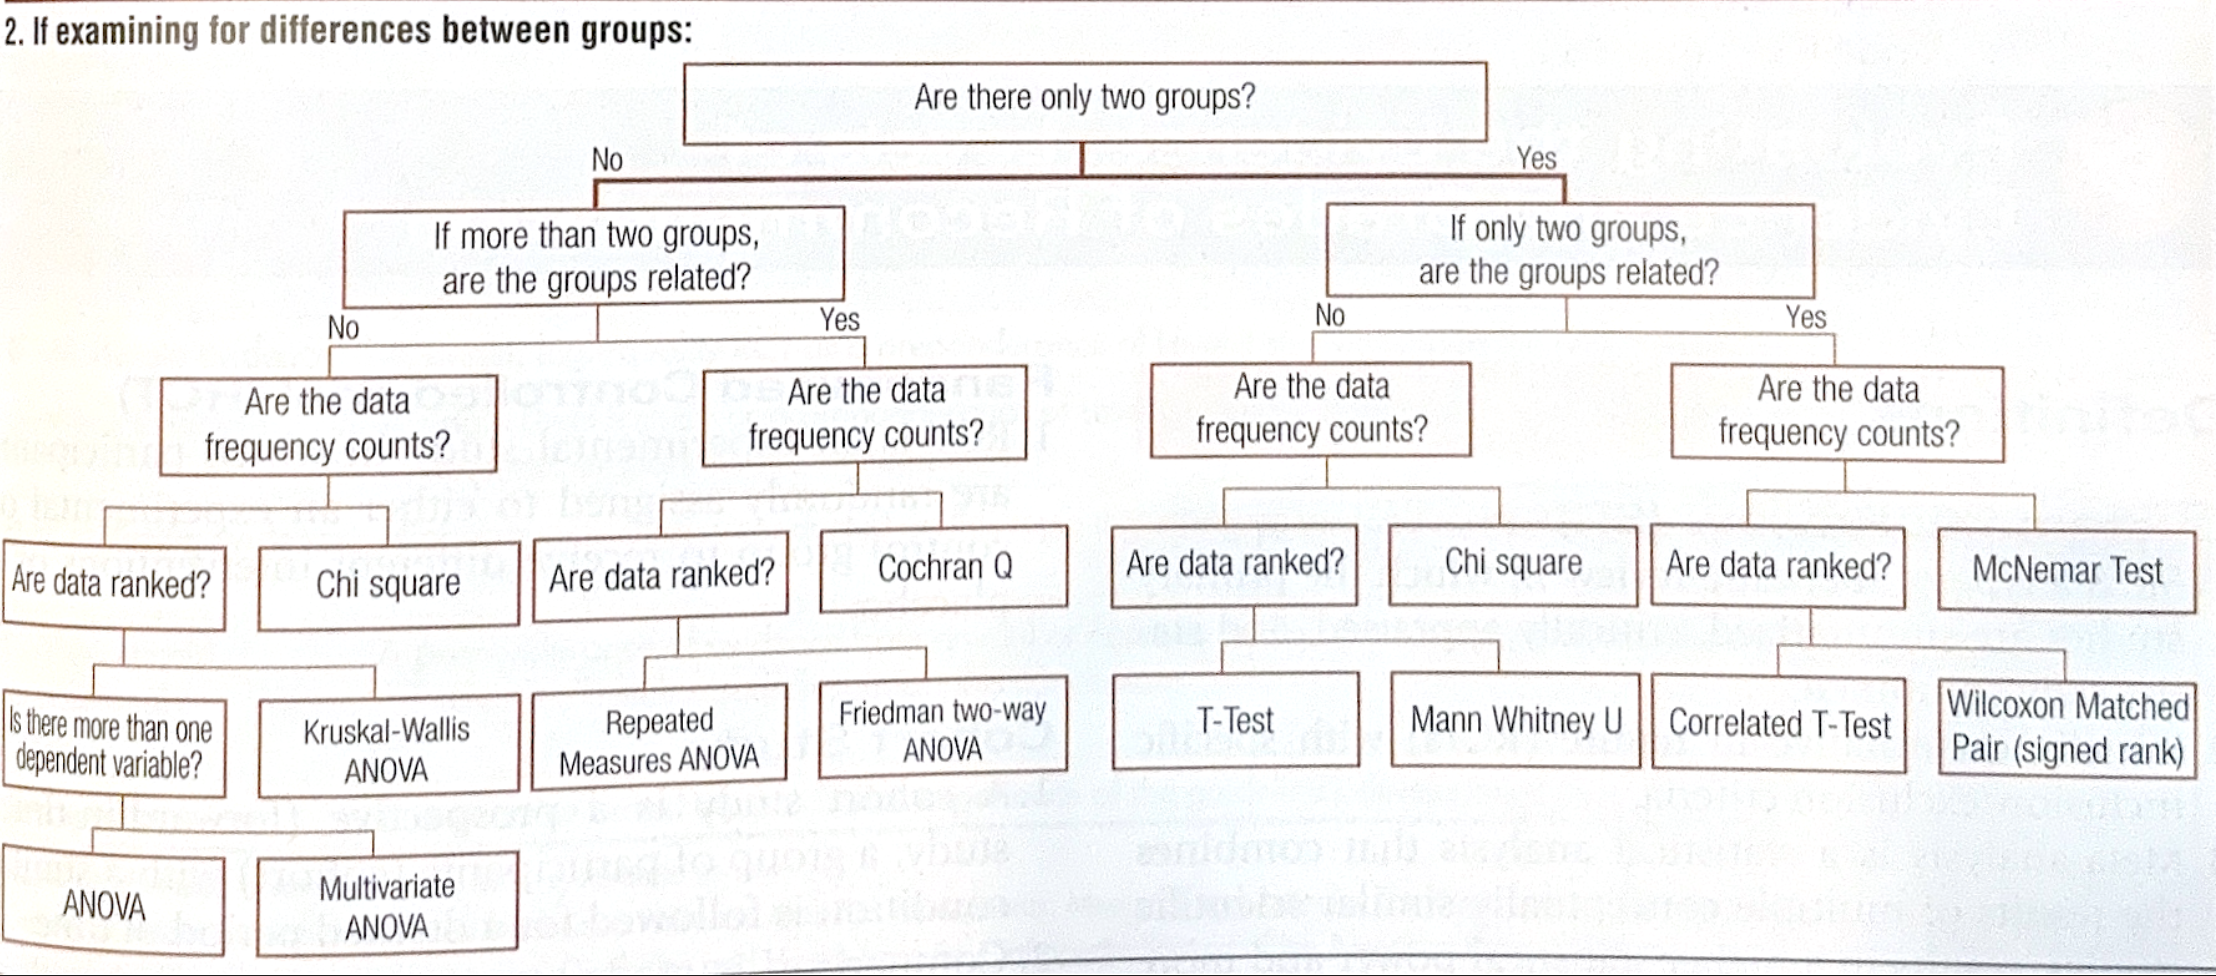
describe a T test
test of significance used to compare two independent groups created by random assigment and identifiy a difference at a selected probability level
Describe ANOVA
parametric test used to compare three or more independent reatment groups or conditions at a selected probability level
Describe a Chi Square test
A nonparametric test (ordinal or nominal data) used to compare data in the form of frequency counts occuring in two or more mutually exclusive categories