Theme 3 - Revision - Year 13
1/229
Earn XP
Description and Tags
Will eventually include everything for Theme 3.
Name | Mastery | Learn | Test | Matching | Spaced | Call with Kai |
|---|
No analytics yet
Send a link to your students to track their progress
230 Terms
3.1.1: What are 2 reason why firms decide to stay small?
One reason is because the market demand for their product or service is limited. This is because the firm is operating in a niche market.
Another reason is because of the fact that the business faces low overheads due to staying small. The business is likely to make more profit staying small as they have low costs, compared to if they were to start expanding the business and growing.
3.1.1: What are three reasons why a firm may choose to grow?
The firm may want to expand into global markets, this is not possibe without growth
The firm may want to increase its market share, this is highly unlikely without growth
The firm may want to reduce the amount of competition in the market by hostile takeover. This would require the firm to have a considerable amount of capital, which is also not possible without growth or investment.
3.1.1: Why might the owner and manager of a business want different things?
A manager may focus on more short term goals and targets such as survival or at least breaking even each month. However the owner may be more focused on long term objectives such as a certain amount of market share gained by the end of 5 years.
3.1.1: What is the difference between the public and the private sector?
The public sector is the sector owned by the state (the government) where as the private sector is owned by private companies and firms.
3.1.1: What is the difference between profit and not-for-profit businesses? Give examples.
Profitable businesses are business that aim to make profit and expand their business with the aim to make more profit. Not-for-profit businesses however, are businesses that have the aim of not making profit but instead have the aim to make some sort of change in society. These businesses do not usually take any of the proceeds that they earn from the business. An example of a profitable business is Apple. An example of a non-profit is a charity.
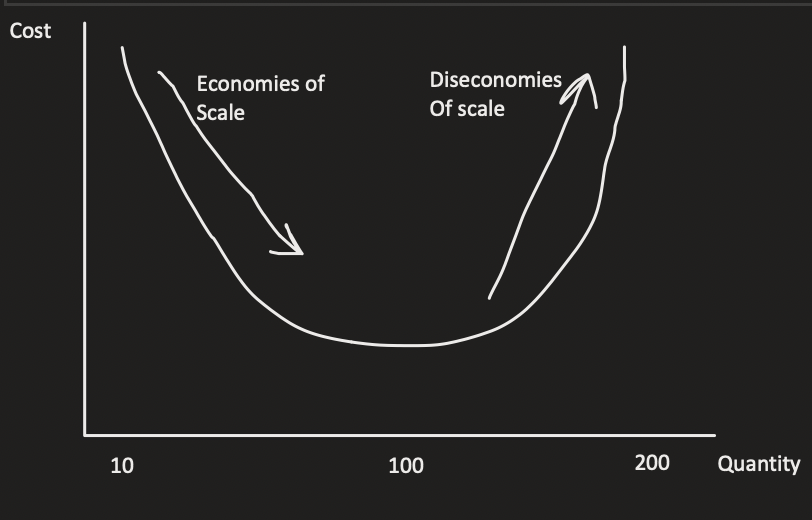
3.1.2: Some businesses choose to stay small to avoid diseconomies of scale, where the costs that the business faces rises as the business grows. Describe economies of scale and diseconomies of scale on this diagram.
When the business increases output from 0-100 quantity of goods being made, the cost that the business faces decreases because the cost is being spread between more products and so the price that each good is being sold at falls, and so leading to more people buying the goods. The cost from 100-200 increases the cost that the business faces because the cost per unit is increasing.
3.1.2: What is the Principle-Agent Problem? Give an example.
This problem is an asymmetry of information problem. The owner of a firm and management have different objectives. The owners of a firm often cannot directly observe the day to day decisions of management and so dont have the right information.
An example is a houseowner (principle) may hire an agent to sell their house, the owner may want the best price for the house, and although the agent may want this as well because they have a higher commission from the sale of the house, the agent may also want to have a high amount of sales and sell the house quickly. And so to do this, the agent may reduce the price that the house sells for so that they can sell more houses. The prinicple and the agent have different aims.
3.1.2: How can the Principle-Agent problem be overcome?
Align the aims of the two stakeholders (the principle and the agent)
Employees share ownership schemes - such as employees having shares in the business, meaning that they will want the same long term goals of high profit and market share so they get higher dividends.
Long Term stock commitment
E.G. Apples introduced a policy 2013 which required senior execs at Apple to hold three times their annual base salary in stocks for a minimum of 5 years so that both the senior execs and Apple’s CEO have the same objectives.
3.1.2: What are the motivations for business growth?
The profit motive - businesses grow to provide better returns for shareholders
The cost motive - This is when a business grows to achieve economies of scale. This reduces the average cost of production. Economies of scale increases the productuive capacity of the business
Market power motive - Firms may wish to increase their market dominance which will give them pricing power in the market. This power can be used as a barrier of entry into the market for new firms in the long run.
Risk motive - Diversification across products and markets helps to reduce investor risk.
Managerial motives - managers who’s objectives differ might accelerate business expansion ahead of short run profit maximisation.
3.1.2: What is Organic (internal) business growth?
This is growth within the business that is caused through the success of new products or expansion into new markets or opening more branches.
3.1.2: What is Inorganic (external) business growth?
This is growth outside of the business that is caused through either mergers or hostile takeovers.
3.1.2: Give some reasons for mergers and takeovers.
Rapid technological changes
The need for economies of scale to remain cost and price competitive in world markets
Access to more distribution networks
Bypassing non-tariff barriers such as import quotas. Being a domestic firm in a different country allows for import quotas to be reduced and so allows unlimited amounts of the good to be imported.
3.1.2: What iss a ‘Supply Chain’?
This includes the:
Primary sector (usually manual labour work such as faming or fishing)
This then leads to the Secondary Sector which consists of making the resources that were gained in the primary sector into an actual product
This then leads to the Tertiary Sector, which involves the product being sold through retailers and shops.
3.1.2: What is ‘Backward Vertical Integration’?
This is the process of acquiring a business operating earlier in the supply chain. For example, a retailer who purchases a wholesaler. This is when a tertiary firm buys a secondary firm.
3.1.2: What is ‘Forward Vertical Integration’?
This is the process of acquiring a business further up in the supply chain. For example, a brewery buys a pub. This is when secondary buys tertiary.
3.1.2: What is ‘horizontal integration’?
This is when companies from the same industry combine. The firms are at the same stage of the production process. For example, when a pub buys a pub. This is when tertiary buys tertiary or when secondary buys secondary.
3.1.2: What is ‘Vertical Integration’?
This is when a firm acquires a business in the same industry but at a different stage of the supply chain. The firm controls different stages of the supply chain.
3.1.2: What are the advantages of Horizontal Integration?
One advantage is that the firm can take advantage of internal economies of scale as the business has atleast doubled, meaning there will be more economies of scale.
There will be costs savings from the rationalization of the businesses. This often involves sizeable job losses
There will be a reduction in competition by removing rivals from the market. This increases both market share and long run pricing power.
3.1.2: What is a disadvantage of ‘Horizontal Integration’?
Such a merger may lead to the attention of the competition authorities being attracted, due to them having concerns that such a merger may lead to a substantial lessening of competition in the market, and thus a reduction in consumer welfare.
3.1.2: What are the advantages of ‘Vertical Integration’?
The firm will have control over supply chains. This helps to reduce the unit costs of production, such as transport costs,and improve the quality of inputs into the production process.
There will be improved access to key raw materials, that may be at the expense of business rivals having reduced access to the raw materials. This gives the business a competitive advantage over rivals.
There may be better control over retail distribution channels and add new channels to the firms sales platforms.
3.1.2: What are the disadvantages of ‘Vertical Integration’?
The firm will have more monopoly power due to controlling different stages of the supply chain, meaning that consumers may see a rise in prices
May lead to possible diseconomies of scale, where the firm becomes too big to the point where it is less efficient.
3.1.2: What are some of the reasons why mergers and takeovers fail?
Integration systems - companies might have very different technology systems that are too expensive or impossive to bring together into one cohesive system
Bad timing - mergers and takeovers that take place towards the end of a sustained boom are likely to fail.
Many mergers fail to enhance shareholder value because of clashes of corporate cultures, priorities and key personalities.
3.1.2: What are some of the key constrainst on business growth?
Regulation - growing businesses with significant market share may attract the attention of the competition authorities and may restrict a business from making a big purchase of another business. For example. Microsoft was initially restricted from purchasing game developer Activision Blizzard.
Competition - In contestable markets, there is always the threat of entry from rival firms, and technological changes have reduced entry barriers, meaning more firms may enter and may contest a bigger firm
Finance - many small/medium sized businesses run up against finance constraints including access to loans and risks of raising equity in capital markets.
3.1.3: What is a de-merger?
This is when a firm decides to split into separate firms
3.1.3: What are some of the key motivations for a de-merger?
Focusing on core business aims to streamline costs and improve profit margins
Reduce the risk of diseconomies of scale and diseconomies of scope by reducing the range of functions in a business, and achieve lower management costs
Raise money from asset sales and return to shareholders
A defensive tactic to avoid attention of the competition authorities who might be investigating possible monopoly power in an industry or market
3.1.3: Give some recent examples of de-mergers.
PepsiCo demerged their food and drinks business by creating Yum Brands (which owns KFC, Pizza Hut and Taco Bell). Yum Brands then split again in 2015 into Yum China and Yum Brands (rest of world)
3.1.3: What are some evaluation points for de-mergers?
For the business, there will be more long term higher returns
For the employees, there is some expected job losses, however, they are likely to be opportunities for managers of newly demerged businesses
For consumers, de-mergers are likely to have a downward pressure on prices as there is more competition in the market so more choice for consumers.
3.2.1: What are all the business objectives?
Profit maximisation
Sales maximisation
Revenue Maximisation
Business growth/market power
Business survival in a recession
Not for profit social enterprises
Satisficing
3.2.1 + 3.3.4: What is ‘Profit Maximisation’?
This occurs when a firm finds a price output where mariginal revenue = marginal cost.
If Marginal Revenue is greater than marginal cost (MR>MC), then selling an extra unit will add to the total profit
If Marginal Revenue is lower then Marginal Cost (MR<MC), then selling an extra unit will lower total profit.
Total profits are maximised when the marginal profit is zero.
3.2.1: What is Marginal Revenue?
This is the change in total revenue from selling one more extra unit.
3.2.1: What is Marginal Cost?
This is the change in total costs incurred by the firm from producing one extra unit.
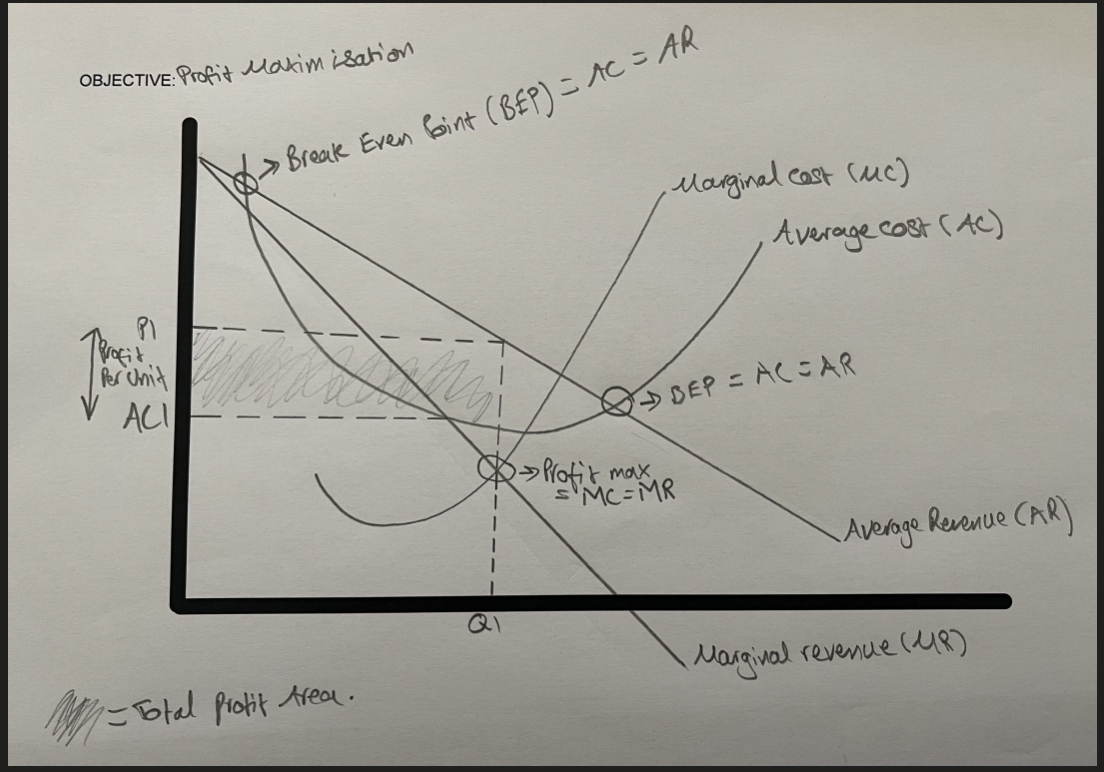
3.2.1: What does this diagram represent?
Profit maximisation.
Marginal Revnue = Marginal Cost
3.2.1: Give an example of a motivation for Profit Maximisation.
One motivation is to increase market power. A firm which does this will have higher supernormal profits, which then gives them the ability tp predatory price in the future, as they will have retained enough profit to be able to sustain themselves at a lower price.
3.2.1: What is Revenue Maximisation?
This is when a firm achieves an output where Marginal Revenue = 0.
The coefficient of PED when revnue is maximised is 1 (unitary elasticity).
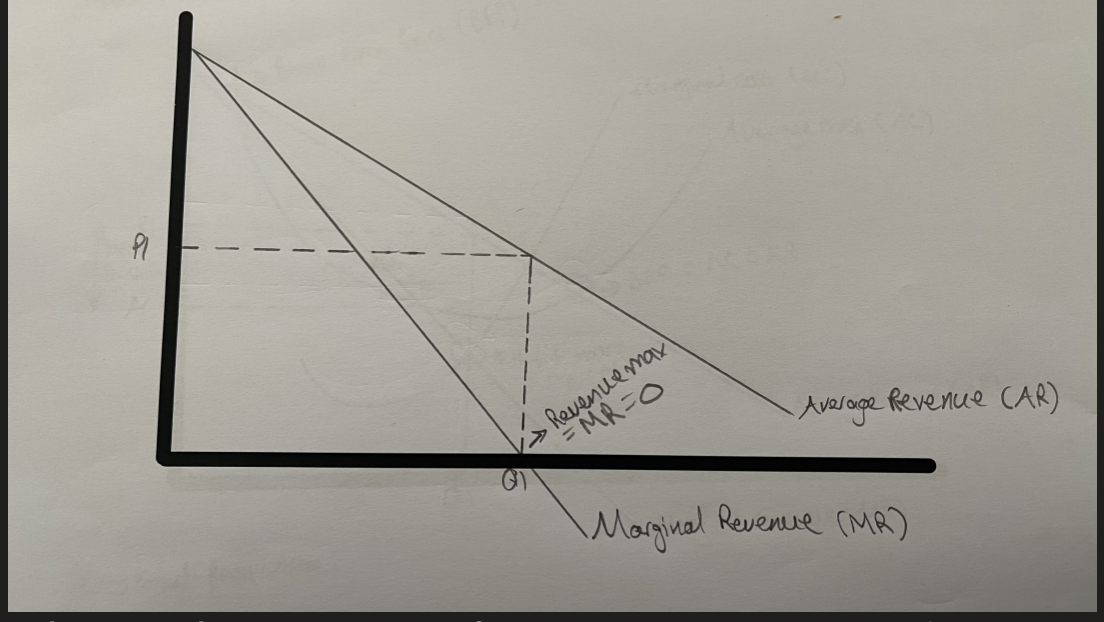
3.2.1: What does this diagram represent?
Revenue Maximisation
Marginal Revenue = 0.
3.2.1: What are the motivations for Revenue Maximisation?
Market penetration and expansion - in the early stages of a business, or when entering a new market, focusing on revenye can help the company gain market share, build brand recognition, and establish a customer base.
Attracting investors - Businesses with strong revenue growth can be more attractive to investors and lenders.
Business survival - cutting prices to increase revenue and improve cash-flow can be an importaant way of surviving an economic downturn.
3.2.1: What is Sales Maximisation?
This is when a firm achieves an output of Average Revenue = Average Costs (AR=AC).
Thos focuses on generating the highest possible level of sales within a given period.
3.2.1: Give reasons as to why a firm may want to Sales Maximise.
One reason is because, this type of maximisation may be part of a wider objective to grow market share or to build a brand.
Another reason why is because of the fact that as sales increase, a business may be able to take advantage of economies of scale, which leads to lower average costs
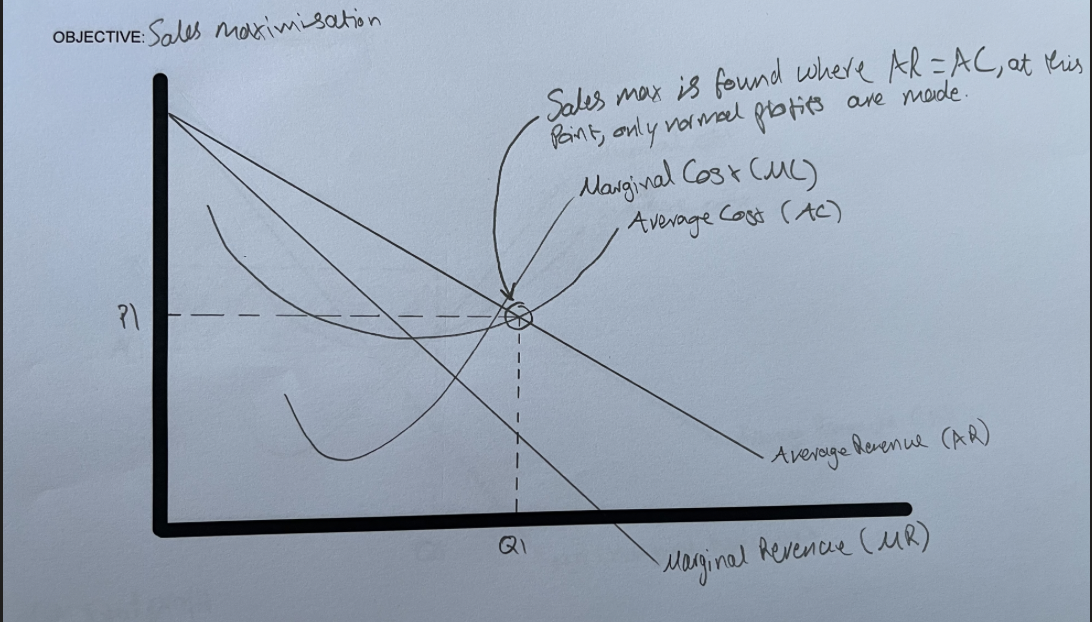
3.2.1: What does this diagram represent?
Sales maximisation
Average Revenue = Average Cost
3.2.1: What is profit satisficing?
This involves the owners of a business (shareholders) setting a minimum acceptable levels of achievement of revenue and operating profits to managers.
The business is making enough profit to keep shareholders happy, or it is sufficient for investors to maintain confidence in the management they have appointed.
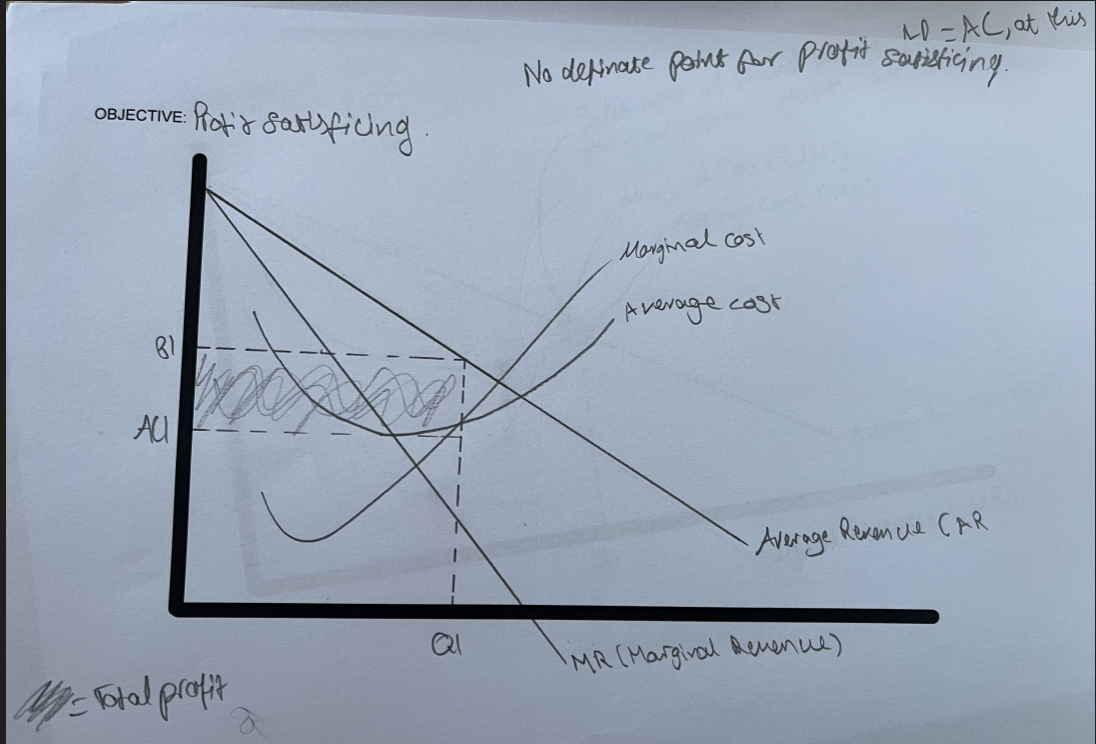
3.2.1: What does this diagram represent?
Profit satisficing.
There is no definite point for profit satisficing.
3.3.1: What is a price taking business?
This is a business that has no power to decide what price to sell their goods at. They must sell at market price. These businesses are found in markets with perfect competition.
3.3.1: What is the formula for Marginal Revenue?
Change in total revenue/change in total quantity sold
3.3.1: What is teh formala for Average Revenue (also known as price per unit)?
total revenue/total quantity sold
3.3.1: What is the formula for total Revenue?
Price per unit x output.
3.3.1: Define Revenue.
This is the income generated from teh sale of goods and services in a market. This is the money that is coming into the firm, and is also known as turnover.
3.3.1: What is sacrificed when maximizing revenue?
Some profit.
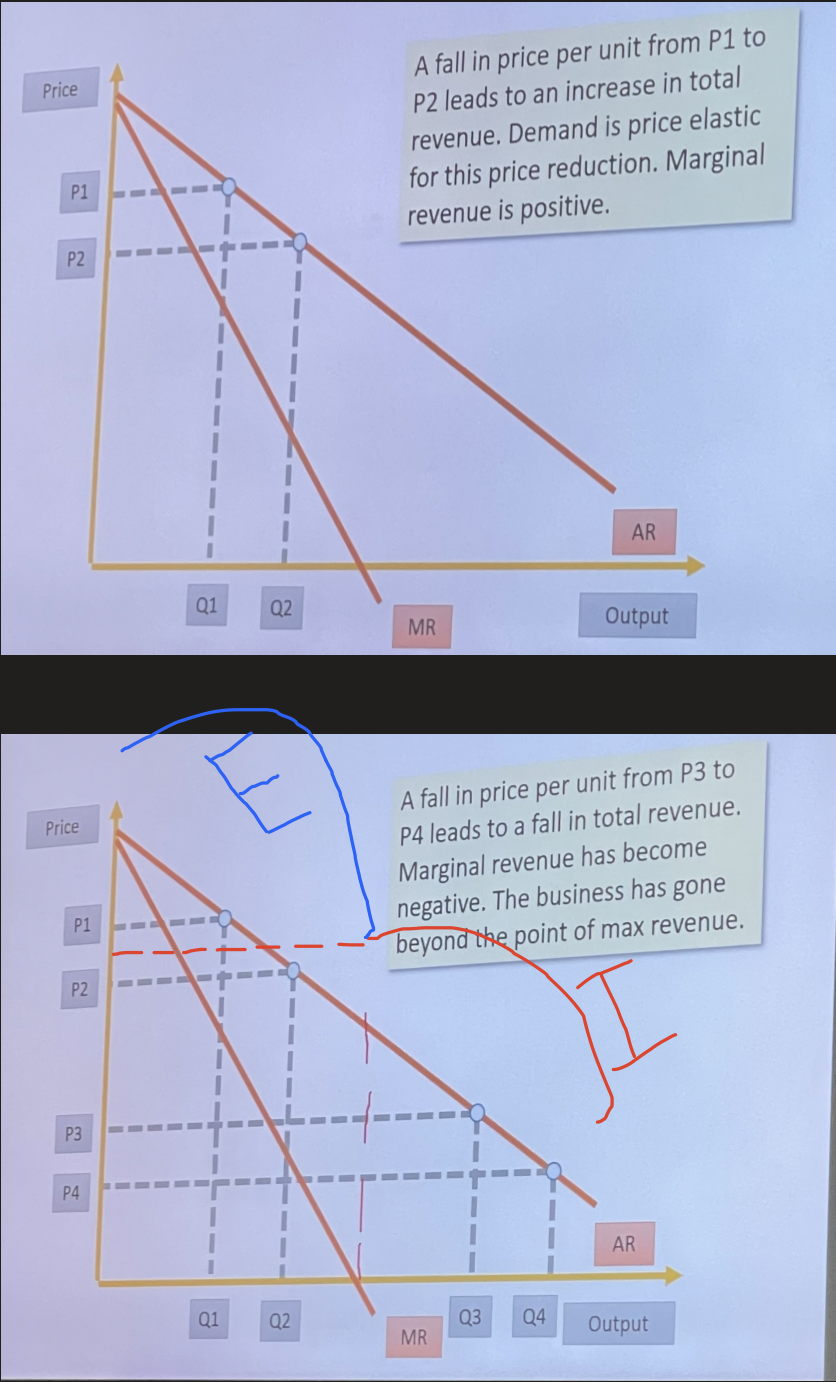
3.3.1: Explain the fall in revenye from P3 to P4.
The reason for the fall in revenue is because the business has now passed the point of revenue maximisation (where MR=0). Each good that is produced and sols after the revenue maximisation point will have a reduced amount of marginal revenue, meaning that goods that are produced at Q3 and Q4 will have a negative marginal revenue, which therefore causes total revenue to fall.
On the Average Revenue curve, before the revenue maximisation point, the price elasticity of demand is elastic, meaning that as the price falls, there will be an increase in demand, and so revenue. However, on the Average Revenue curve, after the revenue maximisation point, price elasticity of demand is inelastic, meaning that even though there is a reduction in price, there is not likely to be any noteable increase in demand, and so revenue.
3.3.1: Explain the Revenue Curve in perfectly competitive markets.
In perfectly competitive markets, TR (Total Revenue) is a diagonal straight line passing through the origin. In perfecly competitive markets, every firm charges the same price, meaning the marginal revenue will always be the same.
3.3.1: What impact does PED have on revenue?
At higher prices, a reduction in rpice will have an elastic response as lower prices cause total revenue to rise.
However, demand is inelastic towards the bottom of the demand curve meaning that a fall in price cases total revenue to fall.
3.3.2: What is the formula for Total Costs?
Total fixed costs + Total variable costs
3.3.2: What is the formula for Total Variable costs?
Variable costs x Quantity
3.3.2: What is the formula for Average Total Costs?
Total costs/quantity
3.3.2: What is the formula for Average Fixed Costs?
Total fixed costs/quantity
3.3.2: What is the formula for Average Variable Costs?
Total variable costs/quantity
3.3.2: What is the formula for Marginal costs?
Change in total costs/change in quantity
3.3.2: What are fixed costs?
These are costs that do not vary with the level of production or sales. These costs remian constant regardless of whether the business produces a high or low quantity of goods or services.
These costs are are typically associated with the basic operations of the business, and they do not change in the short run.
3.3.2: Give some examples of fixed costs.
Renting a building
Insurance
Software
Workers with fixed salaries
Costs for a marketing campaign
3.3.2: What are variable costs?
These are costs that change directly with the level of production or sales. In the short run, these costs will rise when production expands.
3.3.2: Give examples of variable costs.
Packaging costs
Component parts
Basic raw materials
Part-time wage costs
3.3.2: Why is marginal costs important?
Businesses aiming to make profits need to have an indication of the marginal cost of supplying an extra unit of output. They can make higher profits, provided that the marginal cost is less than the marginal revenue.
If marginal cost of increasing output is low, then a firm might benefit from expanding their production because it will lead to a fall in the average cost of supply.
3.3.2: What is the difference between production and productivity?
Production is a measure of the value of the output of goods and services.
Productivity, on the other hand, measures the efficiency of factors of production in a given time period.
An increase in production does not automatically mean increase in productivity.
3.3.2: What is the Law of Deminishing Returns?
The law states that as more units of a variable input are added to a fixed input, after a certain point, the marginal product of the variable input will begin to decreases.
In other words, the additional output produced by each additional unit of the variable input will start to decrease, assuming ceteris paribus.
3.3.2: Give an example of the law of Deminishing Returns.
An example is if there is a kitchen (fixed input) with a limited amount of space, workers (variable input) will need to work in the kitchen. Initially, when the first few workers are being added to the kitchen, the additional product increases with each worker added. However, there will reach a point where there are too many workers in the kitchen, which will cramp the space in the kitchen, and workers will become less productive. As this happens, the additional product of each new worker added to the kitchen decreases.
3.3.2: How does Diminishing Returns affect costs?
The concept of diminishing returns is closely linked to marginal cost of supply.
As diminishing returns sets in, the marginal cost of supply will increase. This is because, in order to produce more output, the producer needs to add more of the variable input (e.g. labour), which becomes less and less productive as more of it is added.
3.3.2: Explain the relationship between Average Costs and Marginal Costs.
If Marginal Cost is less than Average Costs (MC<AC), then it pulls down the average cost. This implies that the last unit produced adds less to the total cost than the average cost per unit, which lowers the average.
If the Marginal Cost is greater than the Average Cost (MC>AC), it pushes the average cost up. This implies that the last unit produced adds more to the total cost than the average cost per unit which increases the average.
If the Marginal Cost is equal to the Average Cost (MC=AC), the average cost remains constant.
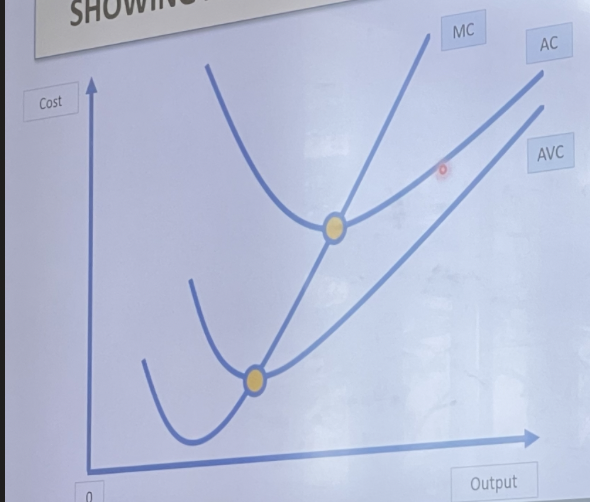
3.3.2: What does this diagram represent?
Average Variable Cost
Average Variable Cost falls and then rises. As with marginal cost, this links into the law of diminishing returns.
Once marginal cost is above the average cost, then Average Variable Cost will rise
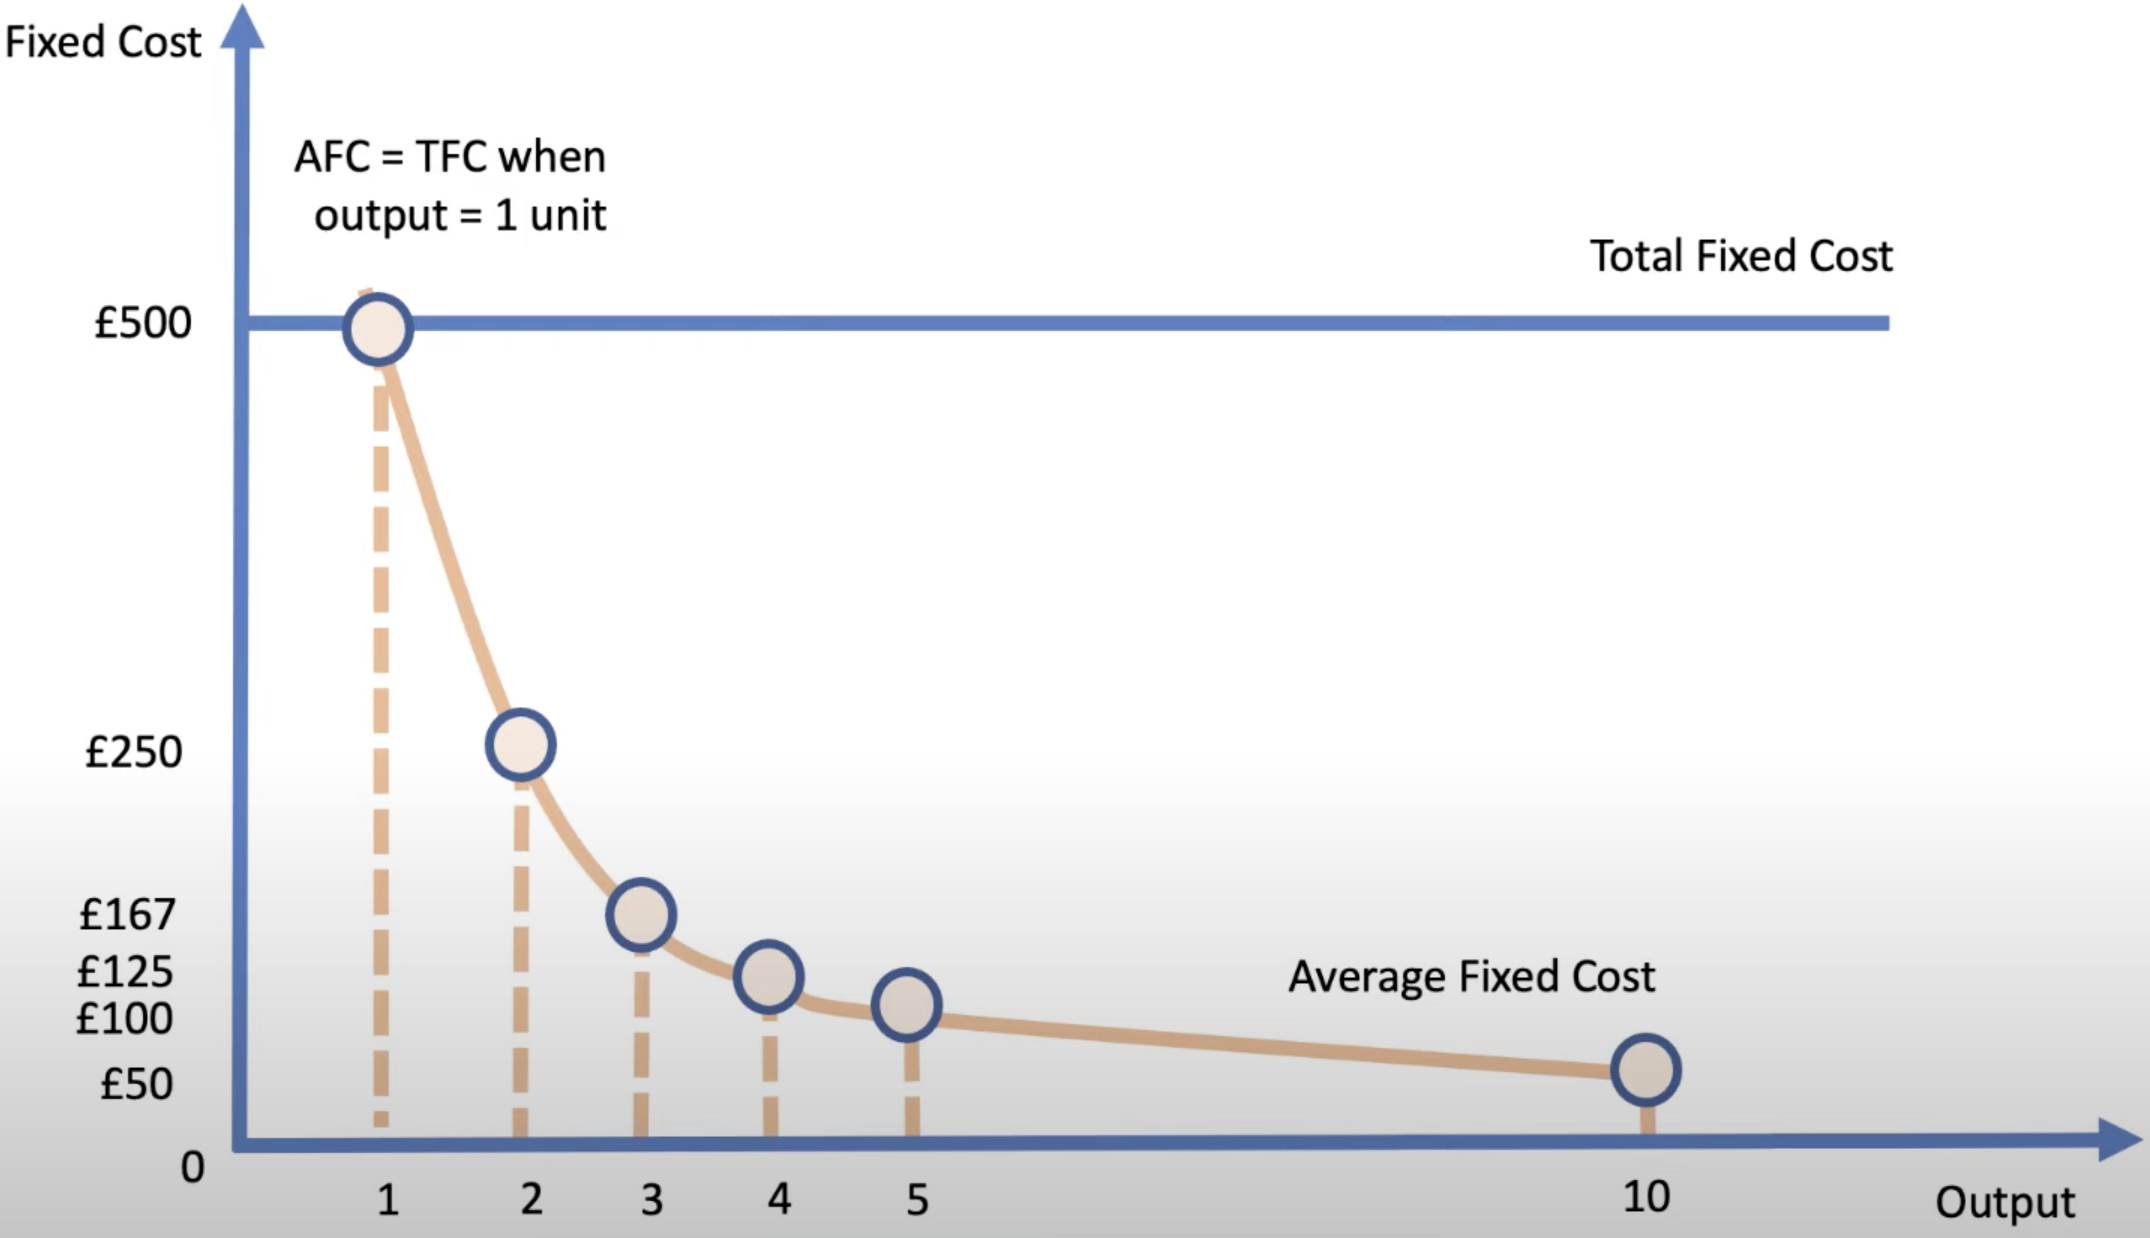
3.3.2: What does this diagram represent?
Average fixed cost
As short run production increases, total fixed cost remains the same, therefore meaning that average fixed cost must fall.
3.3.2: Why are average fixed costs important to businesses, especially start ups?
It is important because if they can ramp up sales and output fairly quickly, then they can bring down their average fixed costs and hopefully lower their average total costs to make them more cost and price competitive, as it will lower their cost per unit, therefore allowing them to charge a reduced price.
3.3.2: Describe the process of how short run cost surves are derived from the assumption of diminishing marginal productivity/ returns.
Initially - Marginal Product should be calculated
Average Variable Cost should then be calculated.
Total cost should then be calculated next
Marginal cost should then be derived by calculating the change in total cost when producing one more unit of output.
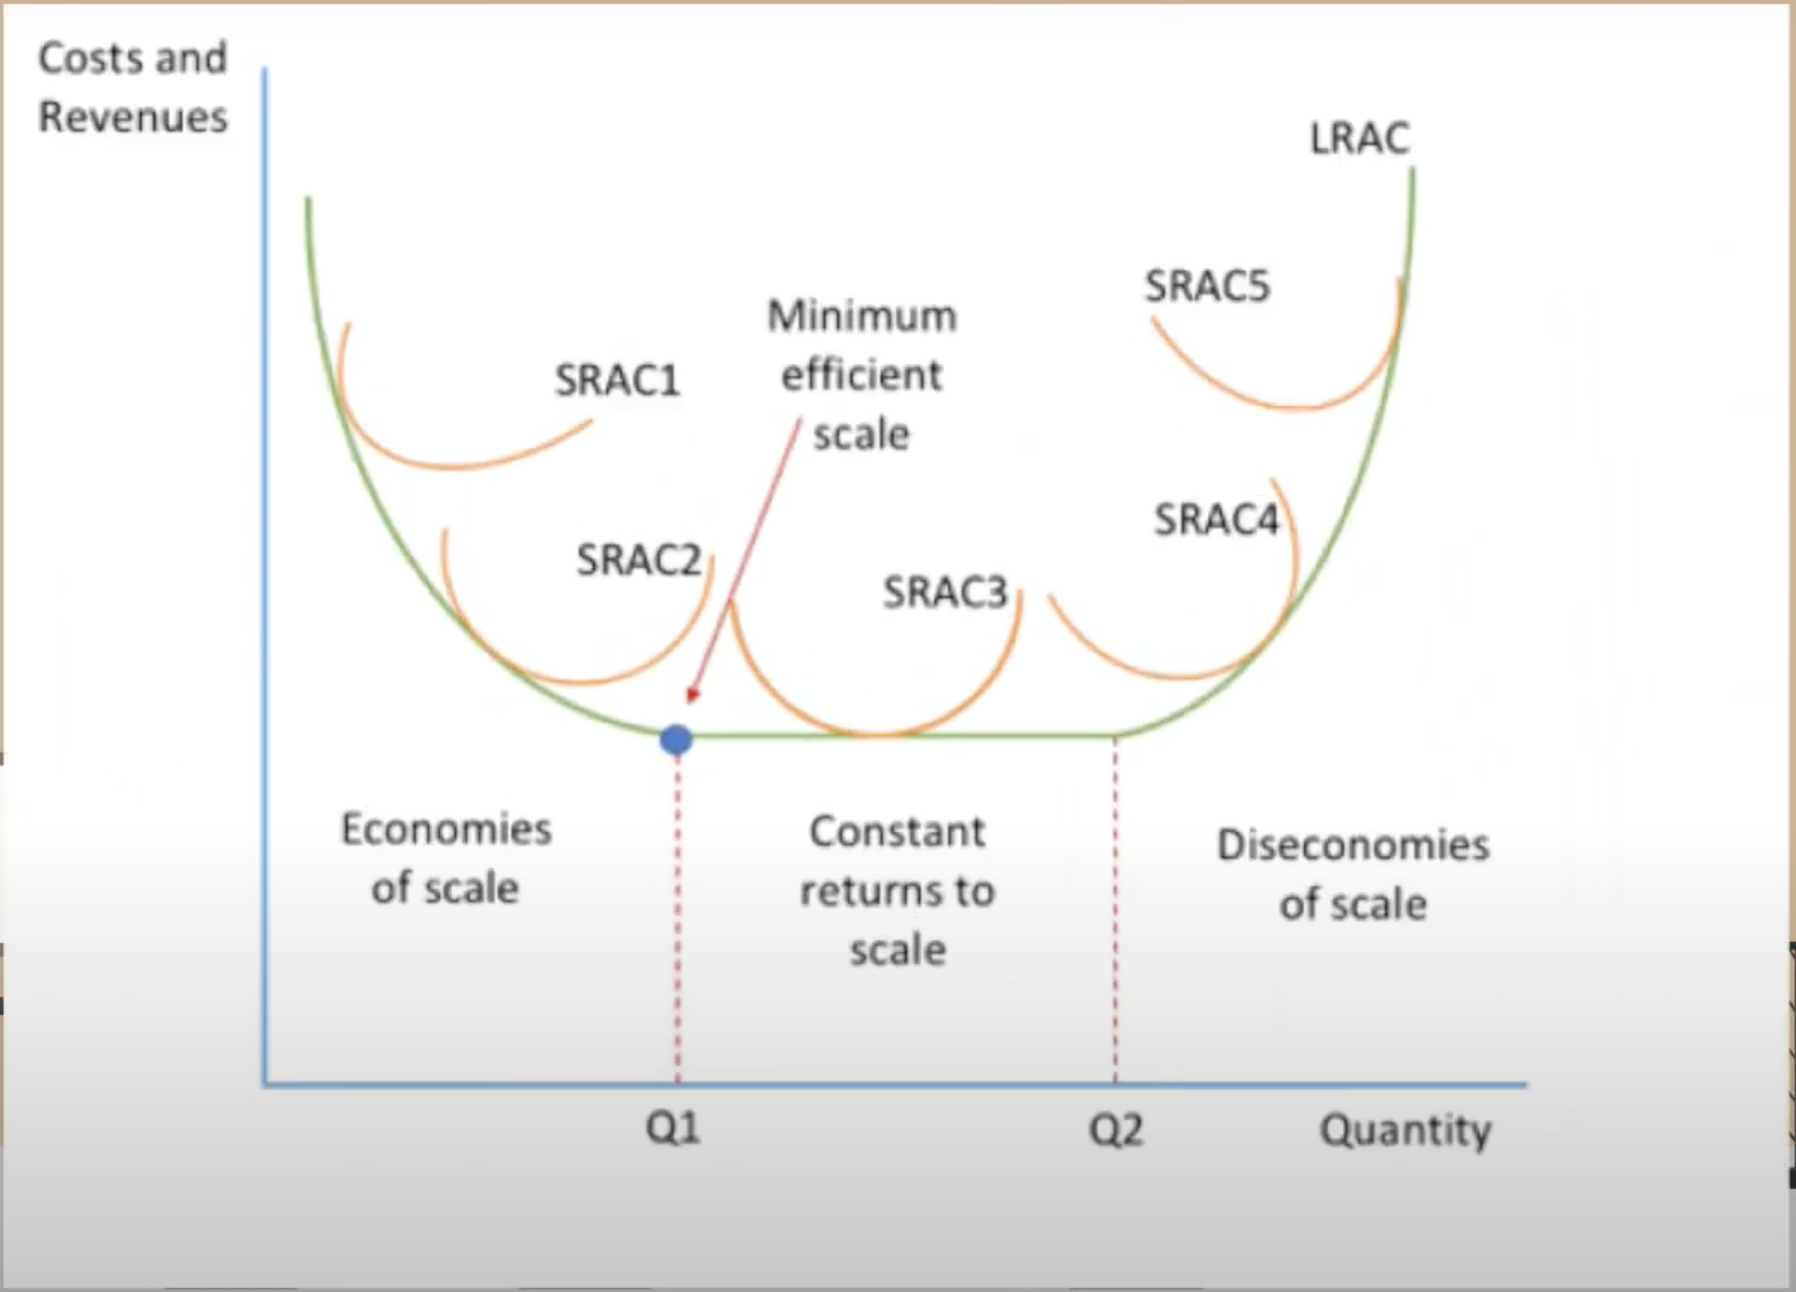
3.3.2: What is the relationship between the Short Run and the Long Run cost curves?
Short Run Average Cost curves (SRAC) are U-shaped because of the law of deminishing returns, whereas Long Run Average Cost (LRAC) is U-shaped because of economies and diseconomies of scale. The LRAC curve is an ‘envelope’ of all associated SRAC curves because the LRAC is either equal to or below the SRAC curve (as seen in the diagram). The firm may initially be set up to produce a certain amount a day, however, as demand for their goods rise, they will need to increase output by employing more variable inputs (e.g.), but there are still fixed inputs (such as factory space) therefore causing the diminishing returns law. In the Short Run, this will cause SRAC to rise, however, in the Long Run, all factors become variable meaning that the SRAC curve can be shifted. The new SRAC curve will be lower since the firm is now enjoying economies of scale. This will continue until the firm begins to experience ‘constant returns to scale’ and eventually diseconomies of scale.
3.3.3: What are economies of scale?
These are the cost advantages reaped by firms when production becomes efficient.
3.3.3: What is an internal economies of scale?
These are economies of scale that arise from within the firm itself, as it expands its own operations in the long run. They result from a firms own actions and decisions
3.3.3: What are external economies of scale?
These are economies of scale that arise from factors outside the firm, often related to the industry or the business environment in which the firm operates. These economies of scale are sharedby multiple firms within an industry or geographic region.
3.3.3: What are the 5 types of internal economies of scale?
Specialised equipment
Managerial Economies of scale
Financial economies of scale
Purchasing economies of scale
Risk-bearing economies of scale.
3.3.3: Explain ‘Specialised Equipment’ as an example of an internal economies of scale.
This is automation, where less workers are needed due to the increasing use of robots in the production process. This will lead to output being more efficient as the machines and robots will make less mistakes and the machines will also increase the speed of production. There will also be less costs as robots don’t have wages.
3.3.3: Explain ‘Managerial Economies of Scale’ as an example of internal economies of scale.
This is a form of division of labour where the firm employs specialists to supervise specialised production systems. This improves communication and raises productivity which improves the efficiency of the production process.
3.3.3: Explain ‘Financial Economies of Scale’ as an example of internal economies of scale.
Financial markets usually rate larger, more established firms to be more credit worthy, and give them access to loans with favourable rates of borrowing. However, smaller firms often pay higher interest rates on overdrafts and loans due to being deemed more risky. Businesses listed on the stock market can normally raise new financial capital more cheaply through the sale of equities to the capital market.
3.3.3: Explain ‘Purchasing economies of scale’ as an example of internal economies of scale.
This refers to bulk buying. A large firm can purchase factor inputs in bulk at lower prices if it has monopsony power (this is when there is a powerful buyer in the market). As a big business, the firm is also likely to negotiate with suppliers for lower prices. However, the smaller the firm is, the less likely that they are able to do this.
3.3.3: Explain ‘Risk-Bearing economies of scale’ as an example of internal economies of scale.
This occurs when larger businesses are better equipped to manage certain types of risk more efficiently than smaller ones. This advantage arises from their size and from product diversification and market diversification to make their business more resilient.
3.3.3: What are the reasons for external economies of scale?
Infrasturcture - this may be things such as good broadband, transportation networks and utilities and specialised services
Knowledge and labour pool - in certain regions, there might be a concentration of skilled workers and a strong knowledge sharing environment. Firms in these regions can tap into a well trained labour force and easily access industry specific knowledge. E.g. Silicon Valley, known for high tech companies, research institutions etc. The close proximities of these entities allows for collaboration, knowledge sharing and access to a highly skilled labour force.
Supplier networks may be good in a region meaning lower transportation costs.
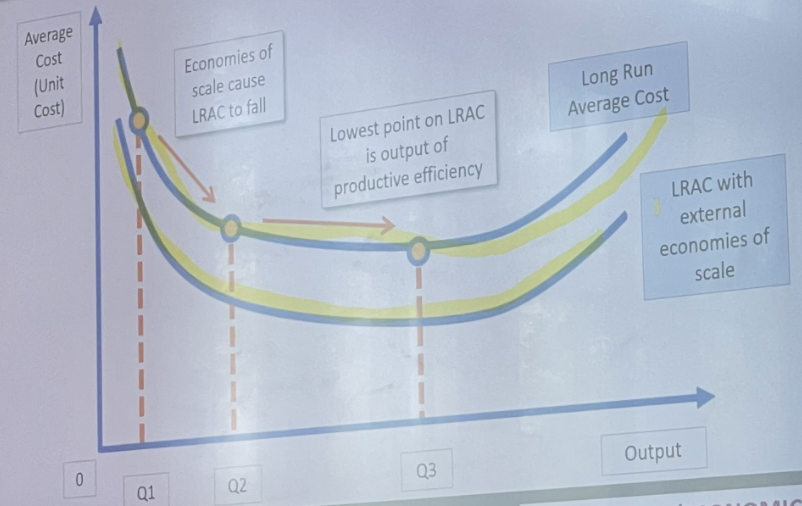
3.3.3: Explain the LRAC curve in the context of economies of scale
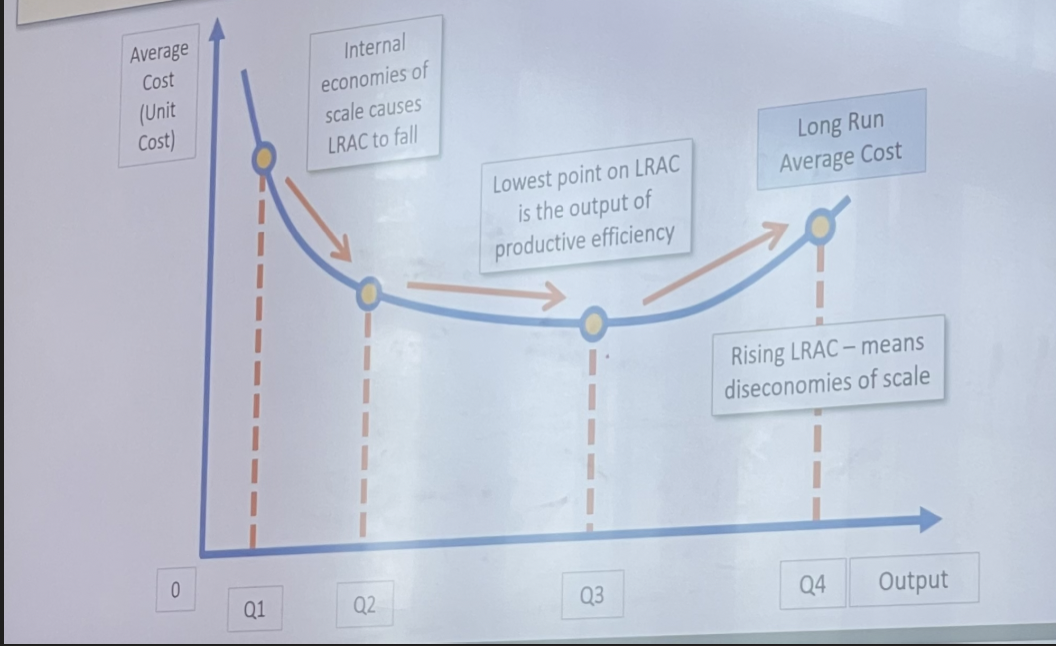
The LRAC curve is drawn on the assumtpion of their being an infinite number of machinery that a business can use. If the LRAC is falling whilst output is increasing, then the firm is experiencing economies of scale. If LRAC starts to rise, the firm is experiencing diseconomies of scale. When the LRAC is constant, the firm is experinecing constant returns to scale.
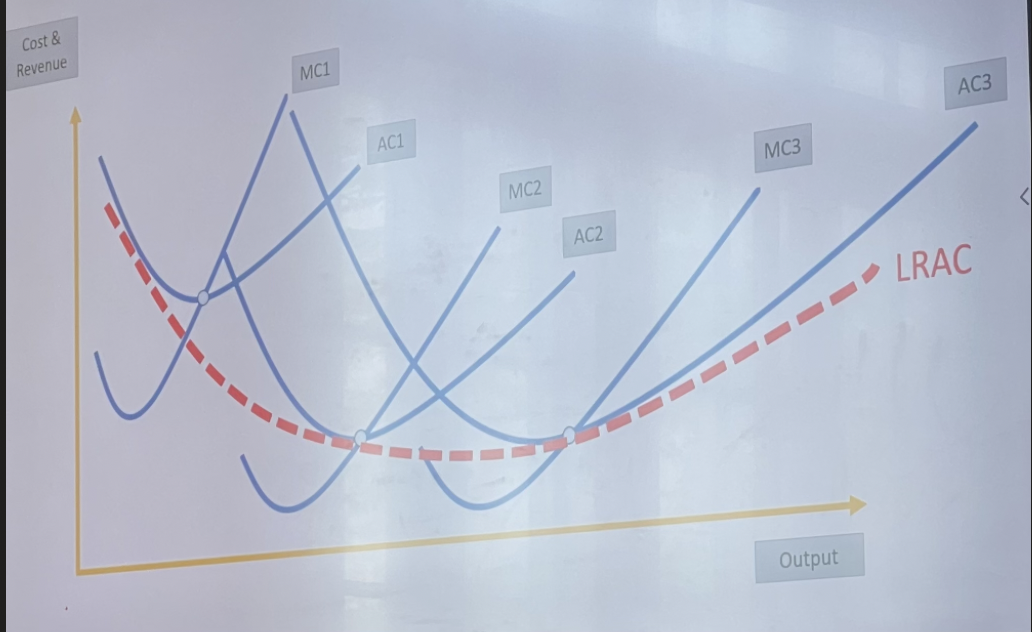
3.3.3: Explain the ‘envelope curve’ (LRAC curve).
This curve (red curve) is the LRAC curve. This is because this is where all of the SRAC curves line up.
3.3.4: What are ‘normal’ profits?
This is the amount of profit that is needed to keep operating in the industry, but is not so high that iy would attract any new firms into the industry. This profit simply keeps the business operating in the long run.
3.3.4: What are total ‘explicit’ costs?
These are the actual operating expenses for a business such as wages and rent and materials
3.3.4: What are total ‘implicit’ costs?
These include the opportunity cost of using the owner’s or investors’ resources in the business. This includes the return they could have gotten from the next best alternative. These costs are assumed to be included in a firm’s calculation of AC.
3.3.4: What conditions are required for normal profits to be achieved?
Averagge Costs (AC) needs to meet Average Revenue (AR)
AC-AR
3.3.4: What happens when a firm is earning less than normal profits, or consistently earns just normal profits?
if a firm is earning below normal profit, it may be a signal that the industry is not profitable enough to justify continued capital investment, which can lead to some firms leaving the industry.
A company that is consistently earning only normal profits may be viewed as underperforming by shareholders, which can lead to a decline in the company’s stock value and make it vulnerable to a hostile takeover.
3.3.4: What are ‘Super-normal’ profits / Economic profits / abnormal profits?
These profits refers to the level of profit above and beyond what is needed to cover all of the firms costs, including the opportunity cost of resources. The presence of these profits can attract new firms to enter the market, which may eventually lead to increased competition and reduced profits, towards normal profits.
3.3.4: When does super-normal profit occur?
This profit occurs when Price per Unit (AR) exceeds Average Total Costs (ATC)
3.3.4: What is Economic Loss?
This is also known as ‘subnormal profits’. In some cases, this can be temporary, however, such profits occuring for a sustained amount of time can threaten the commercial viability of a business. This might lead to a firm cutting back on output, employment and investment. They may also shut down parts of the business or leave an industry.
3.3.4: When does an Economic Loss occur?
This occurs when the Price per Unit (AR) is less than the Average Costs (AC).
3.3.4: What are the key causes of economic loss?
Economic downturn
Rising costs - if a business is not able to control its variable costs (e.g. cost of raw materials) or has high overheads (foxed costs), then it may not be able to generate enough revenue to cover its costs.
External shocks - E.g. COVID which resulted in shock reduction in consumption, or wars such as the Ukraine-Russia war.
3.3.4: What are ‘Shut Down Points’ in the Short Run?
This is when Price per Unit (AR) is less than the Average Variable Costs (AVC).
3.3.4: What is the Short Run - Shut Down price?
This is the price of a product at which a firm would rather shut-down some or all of their business operations than continue producing. This is the point at which it is no longer profitable for a firm to keep producing and selling a product.
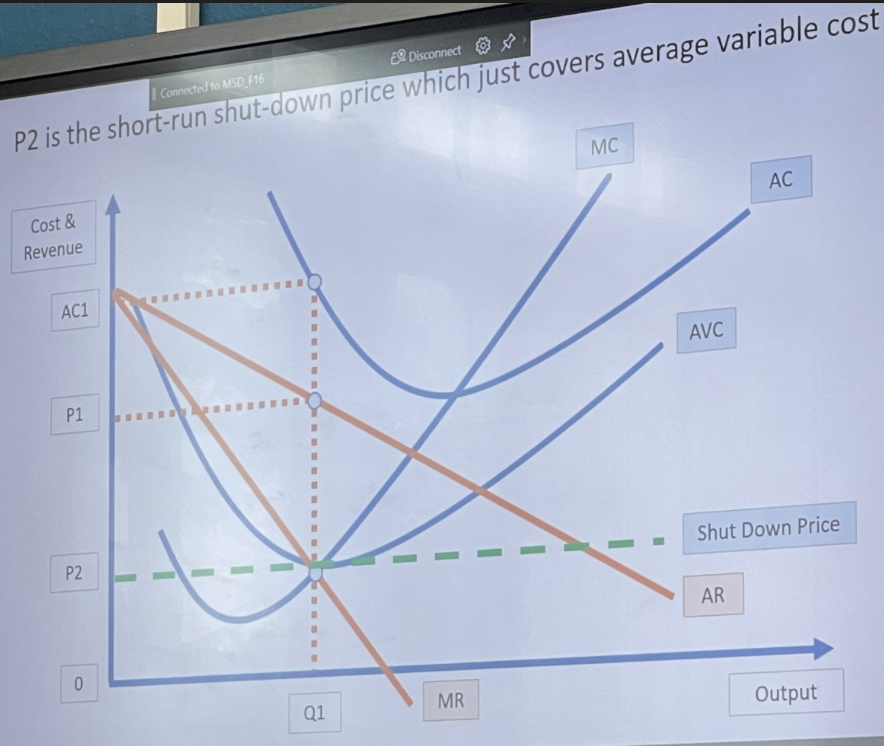
Explain the diagram of Short Run - Shut Down on a diagram.
At P2, the business is at a price where it is only covering its variable costs, bu it is nowhere near covering its fixed costs. However, the business is selling at P1, meaning that it is covering its variable costs, and some of its fixed costs, but not all of them. This means that in the short term, the fimr is not able to cover all of its total costs, but can continue producing in the short term.
3.3.4: What is the condition for Long-Run Shut Down point?
This is when Price per Unit (AR) is lower than Average Total Costs (ATC)
3.3.4: What are partial shutdowns?
A firm may decide to shut down just one division or product line if it is not profitable, while keeping other parts of the business running. This may also be called streamlining to keep a firm more efficient.
3.3.4: What are the costs of shut down for a business?
Severance pay (redundancy pay) for laid off employees
Legal fees for negotiating and terminating leases.
Possible reputation damage which can affect future business and stock prices.
3.4.1: What are the 4 different types of efficiency?
Allocative Efficiency
Dynamic Efficiency
Productive Efficiency
X inefficiency