Adv. Data Analysis - Graphs and GLM - Week 3
1/19
There's no tags or description
Looks like no tags are added yet.
Name | Mastery | Learn | Test | Matching | Spaced |
|---|
No study sessions yet.
20 Terms
For what type of data would you use a bar graph for?
Categorical
A histogram would be used for what type of data?
interval and ratio
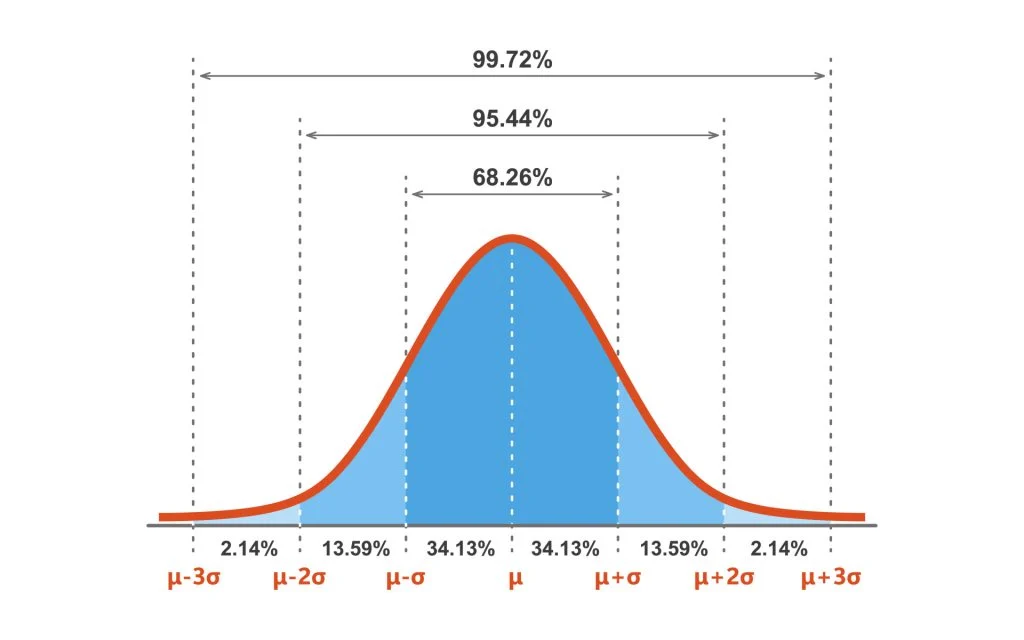
What is this distribution called?
Bell curve
What is skew?
The symmetry of distribution.
P
Bruh
Bruh
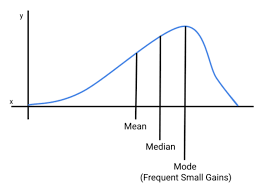
What skewness is displayed here?
negative
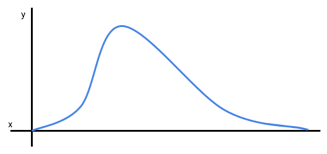
What skewness is displayed here?
positive
Kurtosis is the ____ of the tails.
heaviness
Leptokurtic means?
Heavy and pointy tails, higher probability of extreme values
Playkurtic means?
flatter tails
What is population?
The group you want to study
What is a sample?
A set of people from the population that you test in the stidy
What is a sampling error?
The difference between the parameter and the value of the sample
What is a parameter?
an estimation based on sampling data
What is variability?
A measure of how different the scores in the distribution are. Tells us how similar/different the scores are.
Variability shows _______ between a given score and the mean.
how much distance
What is a deviation?
The difference between the mean and an actual data point
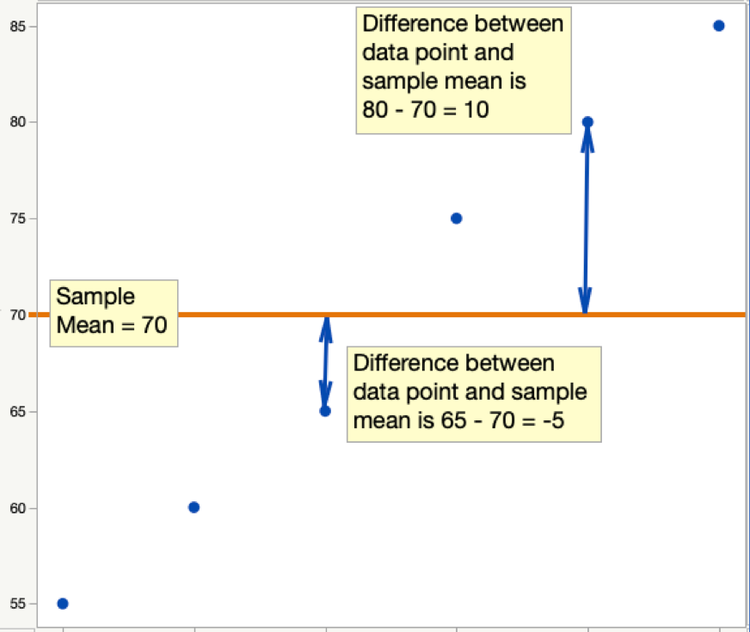
What is positive deviation?
Scoring above the mean
What is negative deviation?
Scoring below the mean