Module 1 (Week 1) - Chapter 2: Economic Theories, Data, and Graphs
1/38
There's no tags or description
Looks like no tags are added yet.
Name | Mastery | Learn | Test | Matching | Spaced |
|---|
No study sessions yet.
39 Terms
Define positive statements.
Advice that does not rely on a value judgement
Statements about matters of fact (what “is”)
Testable (through evidence)
Ex: taxing cigarettes discourages smoking
Define normative statements.
Advice that depends on a value judgement
It tells others what they ought to do (what “should be”)
It cannot be evaluated solely by facts (untestable)
Ex: the government ought to try harder to reduce unemployment
Define theories (or models).
Used to both explain events that have already happened and to predict events that might happen in the future
An abstraction from reality
Ex: the theory of supply and demand
Theories are distinguished by their ______, ______, and ______.
Theories are distinguished by their variables, assumptions, and predictions.
Define variable.
A well-defined item that takes on different possible values
Ex: the price or quantity of an item
Define endogenous variable.
A variable whose value is determined within the theory
Ex: in a theory of the egg market, price and quantity of eggs are endogenous variables
Theory is designed to explain these variables
Define exogenous variable.
A variable that influences endogenous variables but is determined outside the theory
Ex: in a theory of the egg market, weather is an exogenous variable
Weather may affect the price and quantity of eggs, but weather is not influenced by the market for eggs
True or False: A theory’s assumptions outline the motives, directions of causation, and the conditions under which the theory is meant to apply.
True
When economists assume that one variable is related to another, they are assuming some ______ between the two.
When economists assume that one variable is related to another, they are assuming some causal link between the two.
______ is the assumption that firms attempt to make as much money as possible.
Profit maximization is the assumption that firms attempt to make as much money as possible.
Define prediction (or hypothesis).
Propositions that can be deduced from a theory
Ex: based on a theory of the global oil market, the rise in the world price for oil will lead Canadian oil producers to produce and supply more oil
Explain how a theory is tested.
A theory is tested by confronting predictions with empirical evidence.
A theory ceases to be useful when it cannot explain events better than an alternative theory
A theory is modified or replaced if it is consistently rejected by empirical observation
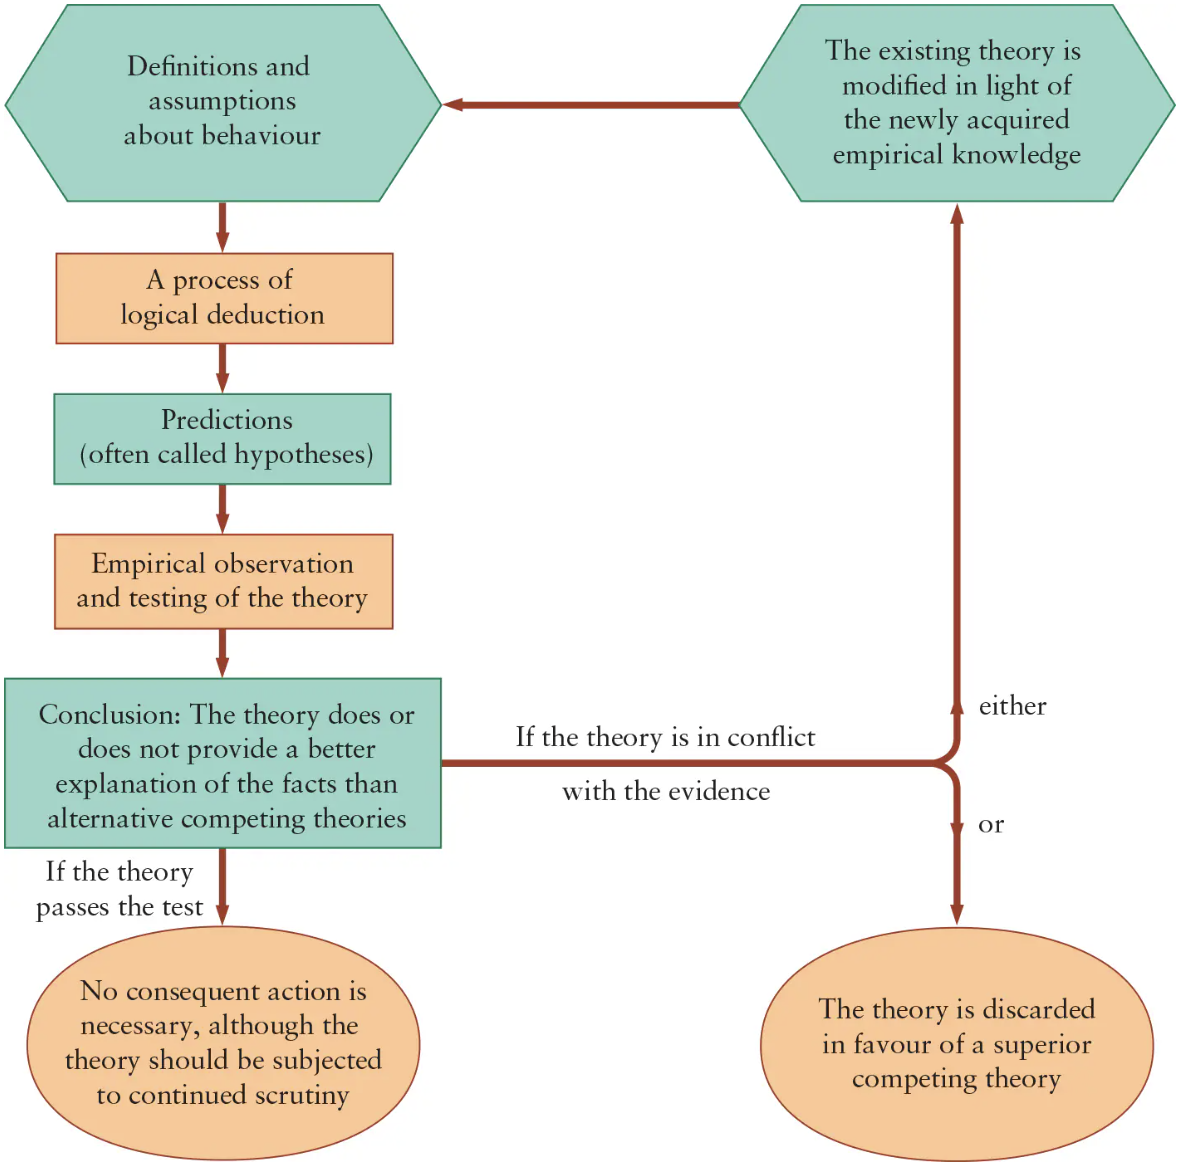
Theory and observation are in ______ interaction.
A) Continuous
B) Non-continuous
A) Continuous
True or False: The scientific approach is central to the study of economics.
True
______ leads to the construction of theories, theories generate ______, and predictions are tested by more detailed empirical observation.
Empirical observation leads to the construction of theories, theories generate predictions, and predictions are tested by more detailed empirical observation.
Define statistical analysis.
Method used to test predictions
Data is used to test whether a relationship exists between x and y
If the relationship exists, it provides an estimate of the magnitude of that relationship
True or False: When testing theories about relations among specific variables, economists must use statistical techniques designed for situations in which other things cannot be held constant.
True
Variables are generally influenced by a number of varying forces
Define causation.
A relationship in which a change in x is predicted to cause a change in y
Define positive correlation.
A relationship in which x and y tend to move together
Correlation between x and y is sometimes influenced by a ______ variable, z.
Correlation between x and y is sometimes influenced by a third variable, z.
When testing predictions, economists must distinguish between ______ and ______.
When testing predictions, economists must distinguish between correlation and causation.
Define randomized controlled trials (RCTs).
A type of controlled experiment to test theories
2 groups are randomly selected from the population (control group and treatment group)
Control group is provided with a placebo
Treatment group receives the intervention being tested
Significant difference in treatment group’s behaviour is attributed to the intervention
What is a concern with randomized controlled trials (RCTs)?
The RCT approach may be too rigid to be useful in situations where proposed policy changes are more complex.
True or False: In economics, there is a division of labour between collecting data and using data to test theories.
True
Define index numbers.
Used to measure relative change (rather than absolute change)
Expresses the value of some variable in any given year as a percentage of its value in the base year
When 2 variables are measured in different units, it is not always clear which variable has an upward or downward trend, or which variable is more volatile
Comparing the time paths of 2 data series is difficult when ______ numbers are used, but much easier when ______ numbers are used.
Comparing the time paths of 2 data series is difficult when absolute numbers are used, but much easier when index numbers are used.
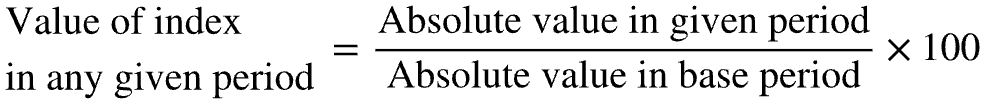
To build an index number, take the value of the variable at some point in time as the ______, which will be compared to the values in other periods (______). Take the output of each subsequent year (______), divide it by the output in the ______ year, and multiply by 100.
To build an index number, take the value of the variable at some point in time as the base, which will be compared to the values in other periods (base period). Take the output of each subsequent year (given year), divide it by the output in the base year, and multiply by 100.
For each index number, the value of output in the base year is equal to ______.
For each index number, the value of output in the base year is equal to 100.
True or False: Index number always measures percentage change compared with the base year.
True
True or False: When comparing an index number across non-base years, percentage change in the index number is not given by the absolute difference between two values.
True
Ex: from 2014 to 2016, index number for steel output increased from 125.0 to 132.5
However, this is not an increase of 7.5%
Percentage increase is calculated as (132.5 — 125.0) / 125.0 = 7.5 / 125.0 = 0.06 (6%)
The most famous index number used by economists is the ______, the index of average prices.
The most famous index number used by economists is the Consumer Price Index (CPI), the index of average prices.
Define Consumer Price Index (CPI).
A price index of average prices paid by consumers for typical goods and services that they buy
Prices indexes must be a ______, in which the weight assigned to each price index reflects the relative importance of that good for typical consumers.
Prices indexes must be a weighted average, in which the weight assigned to each price index reflects the relative importance of that good for typical consumers.
Define cross-sectional data.
Cross-Sectional Data: number of different observations of one variable are all taken in different places at the same point in time
Define time-series data.
Time-Series Data: observations of one variable at successive points in time
Define scatter diagrams.
Scatter Diagrams: designed to show the relation between 2 variables
Values of 2 variables are measured on the horizontal axis and vertical axis
Data plotted on a scatter diagram may be ______ data or ______ data.
Data plotted on a scatter diagram may be cross-sectional data or time-series data.
Theories are built using ______ about relationships between variables.
Theories are built using assumptions about relationships between variables.