Looks like no one added any tags here yet for you.
Predicted y-value
hatted y
y-intercept
b sub 0
Slope
b sub 1
Correlation coefficient
r²
Least squares regression line
LSRL
Individual data value
x sub i
Sample mean
lined x
Population mean
mu
Sum
sigma
Sample variance
s²
Population variance
Sample standard deviation
Population standard deviation
The lowest number in a set of data
min
The 25 percentile
Q1 (the first quartile)
The 50 percentile
med (median)
The 75 percentile
Q3 (the third quartile)
The highest number in a set of data
max
Measures how many standard deviations a value is from the mean
z
Mean of a sampling distribution of sample proportions
mu sub hatted p
Standard deviation of a sampling distribution of sample proportions
Mean of a sampling distribution of sample means
mu sub lined x
Standard deviation of a sampling distribution of sample means
Significance level ALSO prob of type 1 error
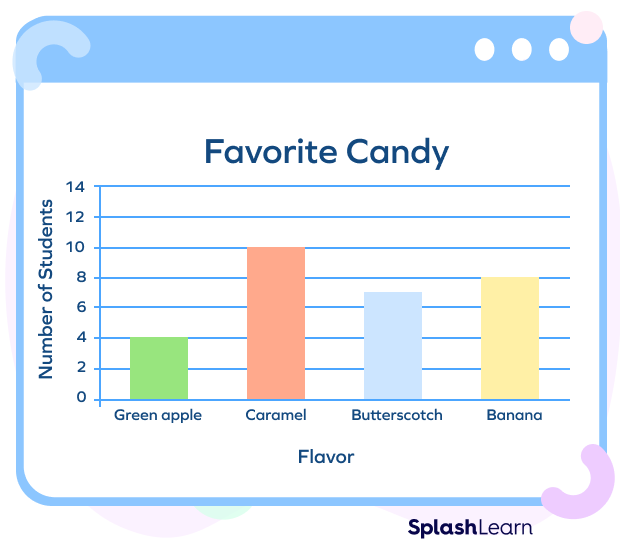
bar graph
categorical data
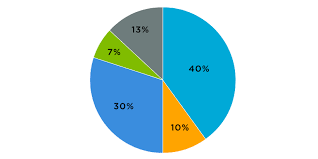
pie charts
categorical data usually for displaying parts of a whole
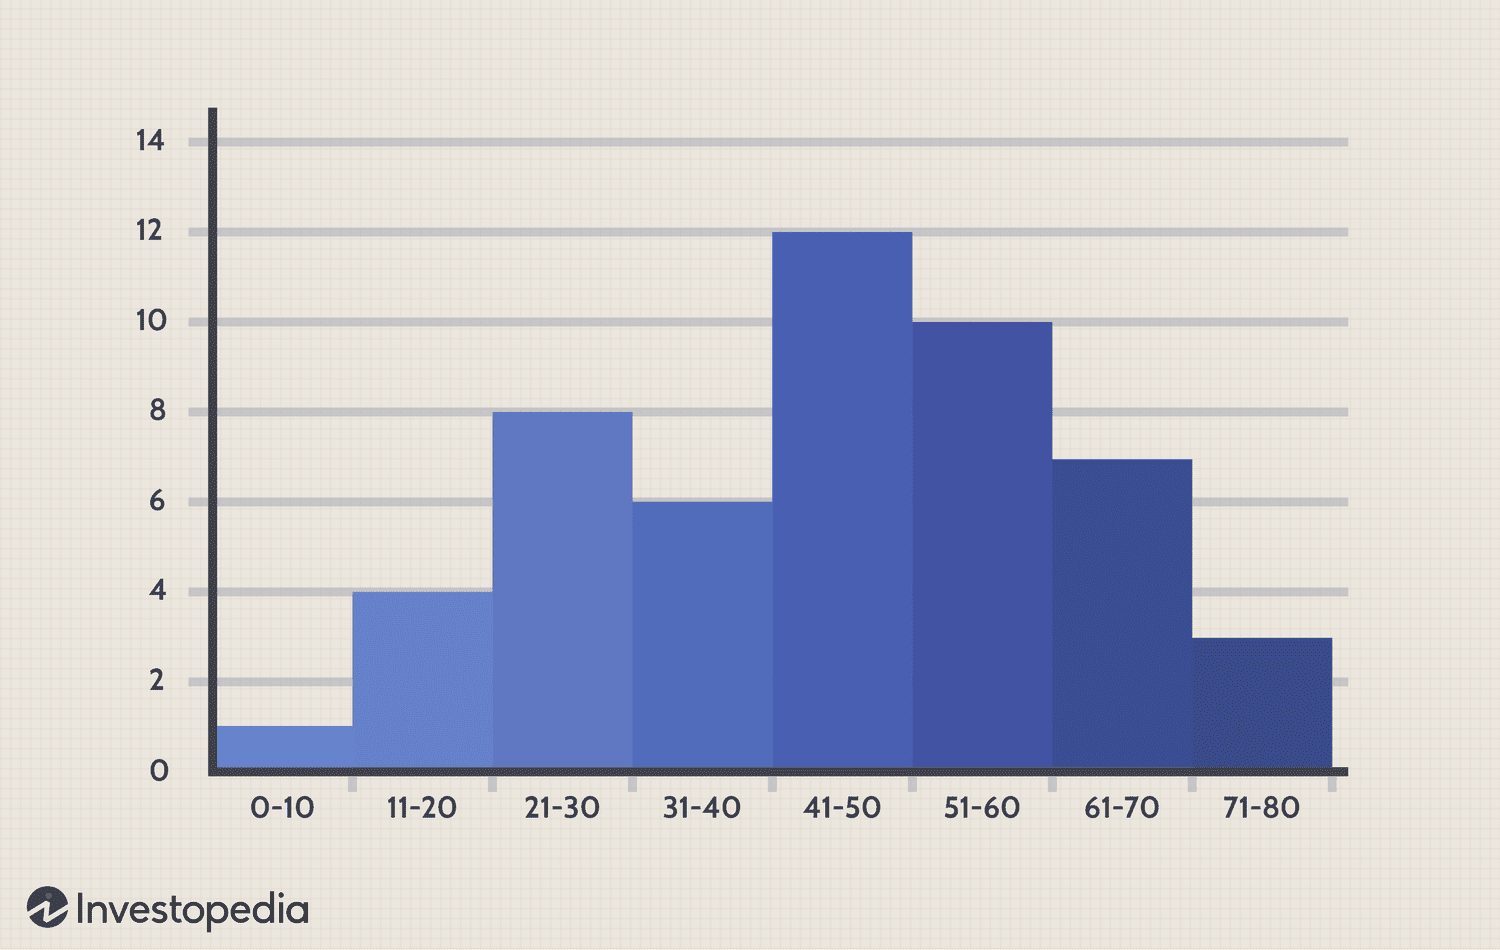
histograms
discrete numerical data
bar graphs what to look for
frequently & infequently occuring categories
pie charts what to look for
categories that form large or small prportions of the data set
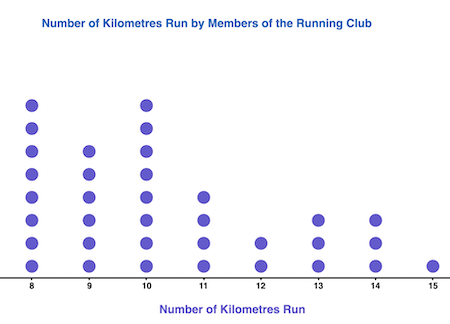
dot plots
used with numerical data EITHER continuous or discrete
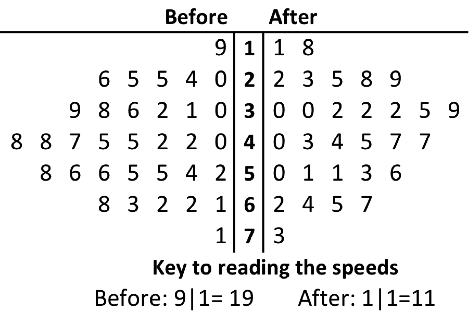
stem and leaf plots
used with univariate numerical data and MUST have key. numerical data (small to medium sets)
histograms what to look for
center & spread if data, type of distribution and unusual vlaues
Histograms
needs variety of data
cumulative relative frequency
used to answer questions about percentiles
cumulative relative frequency
contains quartiles every 25%
IQR (interquartile range)
Q3-Q1
CUSS =
Center, unusual features, shape, spread
number of pages in a book
discrete
the lifetime of a lightbulb
continuous
The mpg of a car
continuous
the distance that someone throws a baseball
continuous
The # of questions asked during a statistics final exam
discrete
continuous data
Numerical data values that can be MEASURED
discrete data
Data that can only take certain values.
When are pie charts particularly useful?
For finding the part percent of a whole out of 100%
frequency table
A table for organizing a set of data that shows the number of times each item or number appears.
relative frequency table
Shows the percents (relative frequencies) of observations in each category or class.
roundoff error
The difference between the calculated approximation of a number and its exact mathematical value. (close to 100% but not exactly, 99.9%)
bar graph
a graph that uses vertical or horizontal bars to show comparisons among two or more items
pie chart
a chart that shows the relationship of a part to a whole (exact percentages)
marginal distribution
one of the categorical variables in a two-way table of counts is the distribution of values of that variable among all individuals described by the table
two way table
a table of counts that summarizes data on the relationship between two categorical variables for some group of individuals
dot plots
a graph where dots that represent the value of data are plotted above a number line
shape
skewed, symmetric, unimodal/bimodal
center
approximate middle part of data distribution
spread
cluster, wide spread
outlier
an extreme deviation from the mean
stem plot
A graphical display of quantitative data that involves splitting the individual values into two components. The stem is the first part of the number and the second is added as the second number, etc. Remember to add a key
back-to-back stem plot
Data for one stem-and-leaf is on the right of the stem, the other is on the left of the stem.
histogram
A graph of vertical bars representing the frequency distribution of a set of data.
x bar
sample mean = sum of observations/n
mu (u)
population mean
resistant measure
A summary number that is not affected by outliers. The median is a resistant measure of center.
median
the midpoint of a distribution (resistant measure)
odd median
middle number
even median
the average of the two middle numbers
range
the difference between the highest and lowest scores in a distribution
interquartile range
Q3-Q1
arrange in increasing order + find median
median Q1
median Q3
Q3-Q1
Identifying Outliers
1.5 x IQR
Q3 + 1.5(IQR)
Q1 - 1.5(IQR)
5 number summary
min, Q1, median, Q3, max
boxplots
graph based on five-number summary
boxplot on calculator
stat
edit #1
L1 = values
stat
calc
1.1 vars stats -> L1, empty, click calculate + enter
use data: min, QI, median, Q3, max to make boxplot
stat
edit #4 -> L1 enter -> done
standard deviation
a measure of variability that describes an average distance of every score from the mean
variance
standard deviation squared
percentile
the pth percentile of a distribution is the value with p percent of the observations less than it
cumulative frequency column
add the counts in frequency column
cumulative relative frequency column
divide the cumulative frequency column by the total number of frequencies
standardized score (z-score)
the number of standard deviations and the direction from the mean that an observation falls
density curve
A mathematical model used to describe the overall pattern of the distribution of a random variable.
normal curve (normal distribution)
a symmetrical, bell-shaped curve that describes the distribution of many types of data; most scores fall near the mean (about 68 percent fall within one standard deviation of it) and fewer and fewer near the extremes.
empirical rule
68-95-99.7
response variable
a variable that measures an outcome or result of a study (y-axis)
explanatory variable
A variable that helps explain or influences changes in a response variable. (x-axis)
scatterplot
shows the relationship between two quantitative variables measured on the same individuals
scatterplot description
direction (pos/neg), form/shape, strength (correlation), outliers
positive association scatterplot
both variables in the same directions
negative association scatterplot
variable going in opposite directions
Correlation (r)
measures the direction and strength of the linear relationship between two quantitative variables
r on calculator
stat
edit
stat
calc 8
Least-Squares Regression Line
the line that makes the sum of the squared residuals as small as possible
extrapolation
Use of a regression line for prediction far outside the interval of values of the explanatory variable x used to obtain the line.
residual
the difference between an observed value of the response variable and the value predicted by the regression line
residual plot
a scatterplot of the regression residuals against the explanatory variable (should look random)
positive residual
model or predicted values underestimate the actual data value
negative residual
the predicted value is too big, an overestimate
good fit for residual plot
random, centered at 0, no clear patterns
coefficient of determination (r^2)
The fraction of the variation in the values of y that is accounted for by the least-squares regression line of y on x.
high leverage points
observations with extreme values for the independent variables
high magnitude points
outliers on the y-axis
experiment
A research method in which an investigator manipulates one or more factors to observe the effect on some behavior or mental process