psychology 2910 - lecture 10 (the distribution of sample means)
1/19
There's no tags or description
Looks like no tags are added yet.
Name | Mastery | Learn | Test | Matching | Spaced | Call with Kai |
|---|
No study sessions yet.
20 Terms
Population
All potential participants
Defined by research question:
- All humans
- All left-handed females
- All adults between 19 and 39
Sample
The people in the study
What makes something a good sample?
2 characteristics:
- They are representative: each member of the population has an equal chance of being in the sample
- They have more people: larger samples are more likely to be representative of a population than smaller samples
- Statistics cannot correct for a non-representative sample (unless you know how non-representative it is by comparing to other stats)
Sampling Error
The natural discrepancy - or amount of error - between a sample statistic and a population parameter
If we take two random samples from the same population:
- Means are likely to differ
- Which sample gives best estimate?
How can we determine which sample (if we take two random samples from the same population) gives the best estimate of the population?
Jar of marbles:
Experimenter 1 selects 8 marbles:
- 2 are white, 6 are red
- Infers 1/4 are white
Experimenter 2 selects 24 marbles:
- 8 are white, 16 are red
- Infers 1/3 are white
What is the real ratio of white to red marbles? Who should be more confident in the result?
- Larger sample tends to reduce sampling error
How can we determine the probability of obtaining any specific sample?
For example, what's the probability of obtaining a sample in which 1/4 of marbles are white? What's the probability of obtaining a sample in which 1/3 of marbles are white?
Examine the distribution of sample means!
Distribution of sample means describes the entire set of all possible sample means for any sized sample
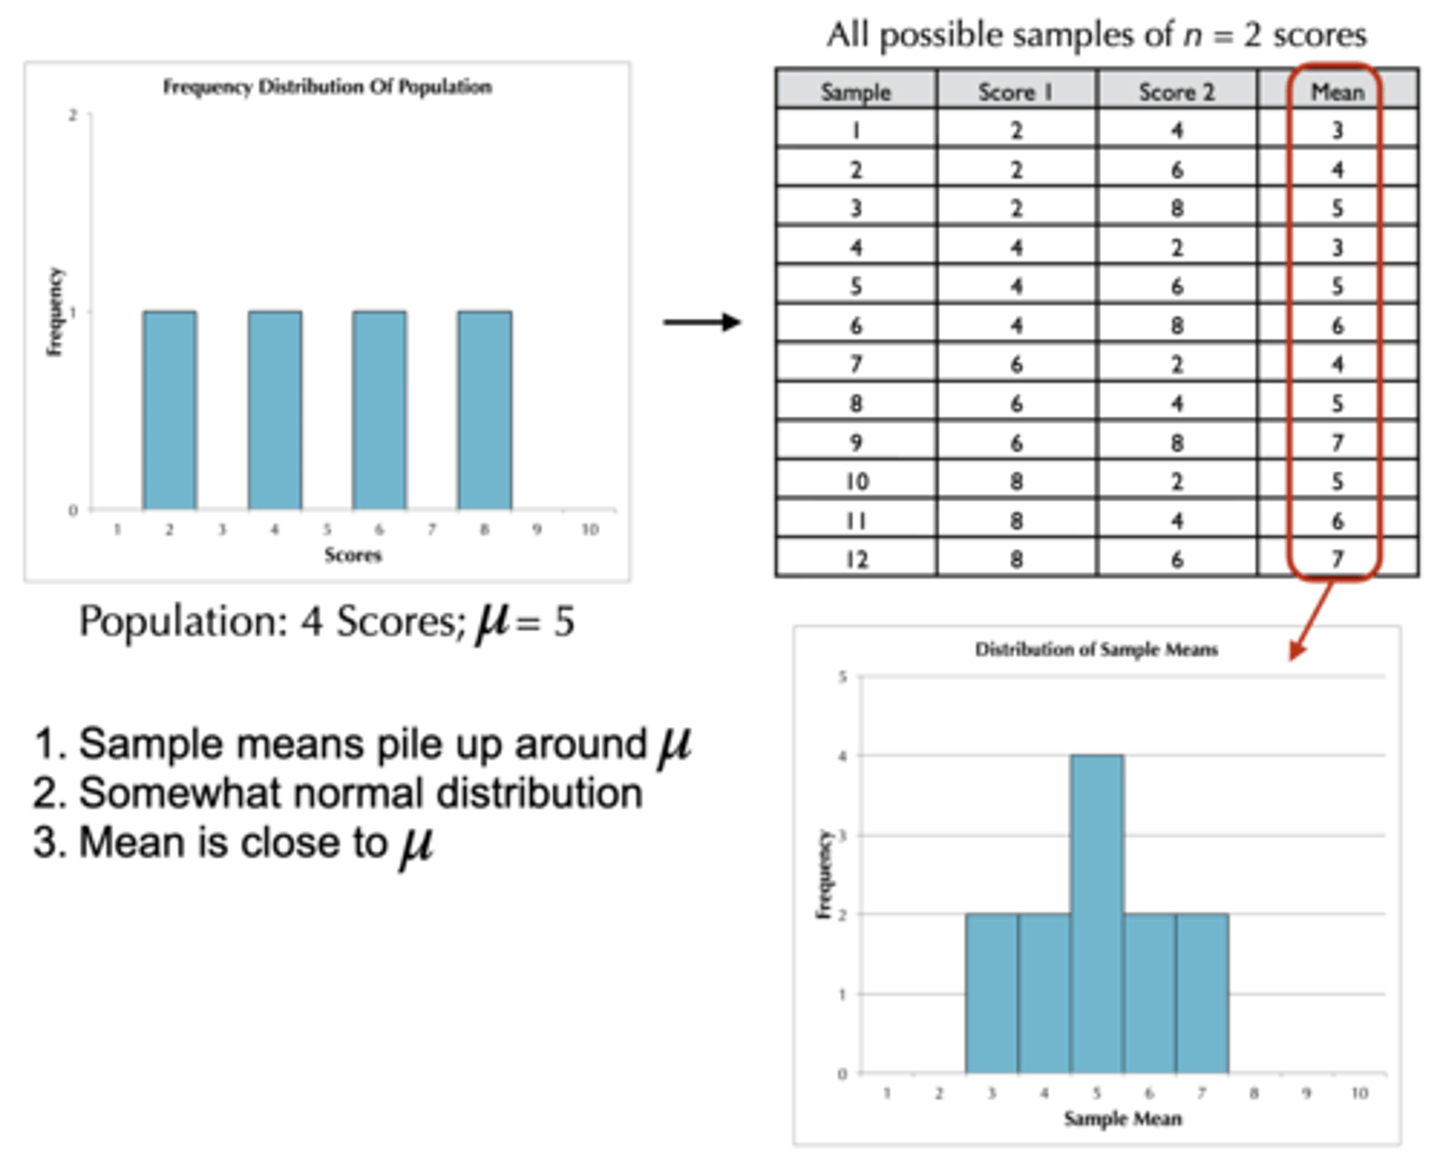
Distribution of Sample Means
The collection of sample means for all possible random samples of a particular size (n) from a population; theoretical
For n = 25:
- Randomly sample 25 MUN students; calculate first sample mean
- Randomly sample 25 MUN students; calculate second sample mean
- Randomly sample 25 MUN students; calculate third sample mean
... (get all possible random samples)
What are the characteristics of the distribution of sample means?
1. Sample means should pile up near population mean
2. Pile of sample means should be similar to a normal distribution (i.e. probability of getting a mean that's far away is low)
3. The larger the sample size, the closer the sample means should be to the population mean (i.e. larger sample size should result in less sampling error; squeezes distribution together)
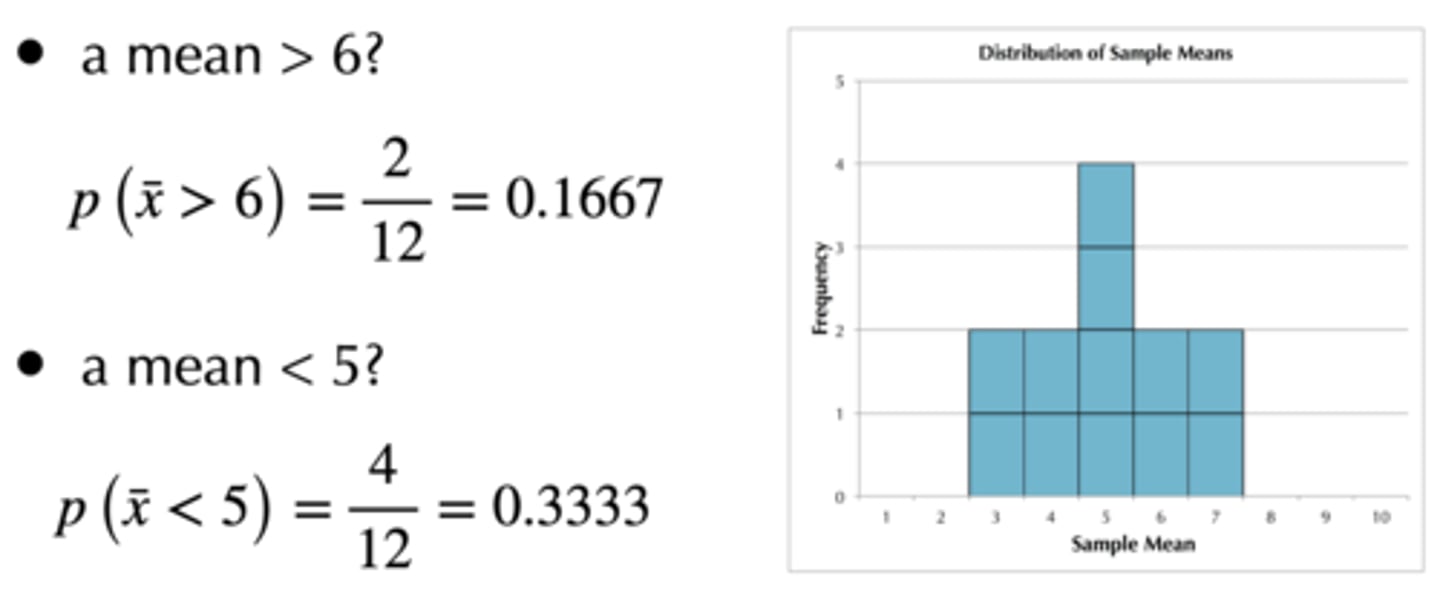
What is the probability of getting a mean above 6 (based on the pictured graph)? Below 5?
Chance of getting a mean > 6 is 2/12 = 0.1667 (16.67%)
Chance of getting a mean < 5 is 4/12 = 0.3333 (33.33%)
When will the distribution of sample means be almost perfectly normal?
If either of the following holds:
1. The population from which the samples are selected is a normal distribution
2. The number of scores (n) in each sample is relatively large (approx. 30 or more)
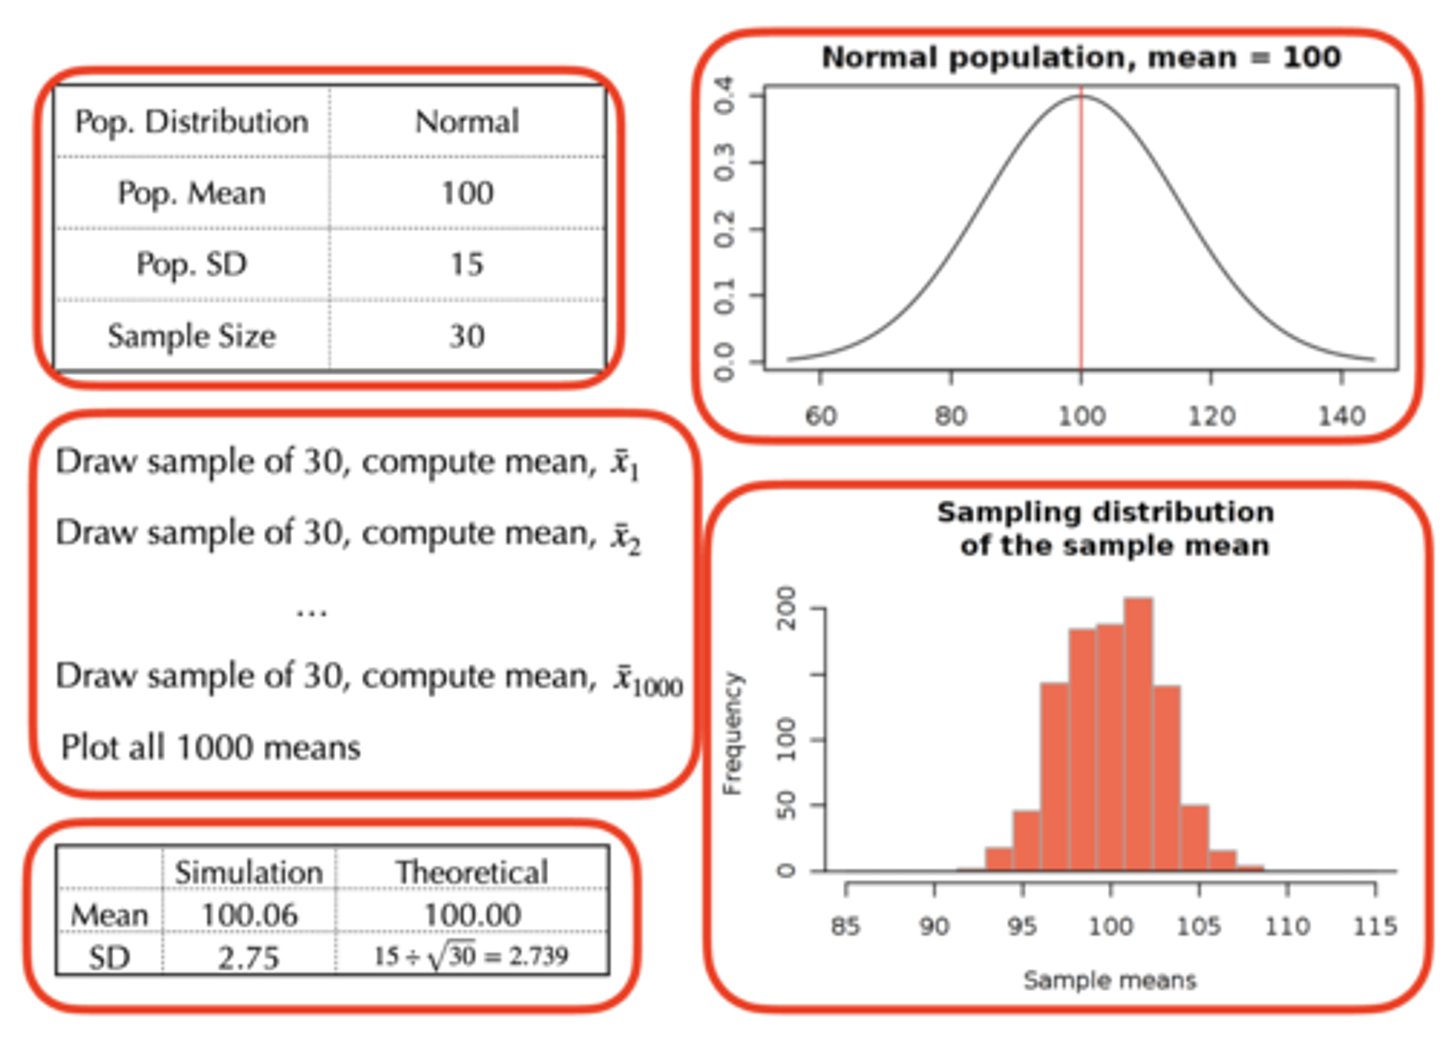
Central Limit Theorem
For any population with mean μ and standard deviation σ, the distribution of sample means for sample size n will:
- Have a mean of μ (population parameter)
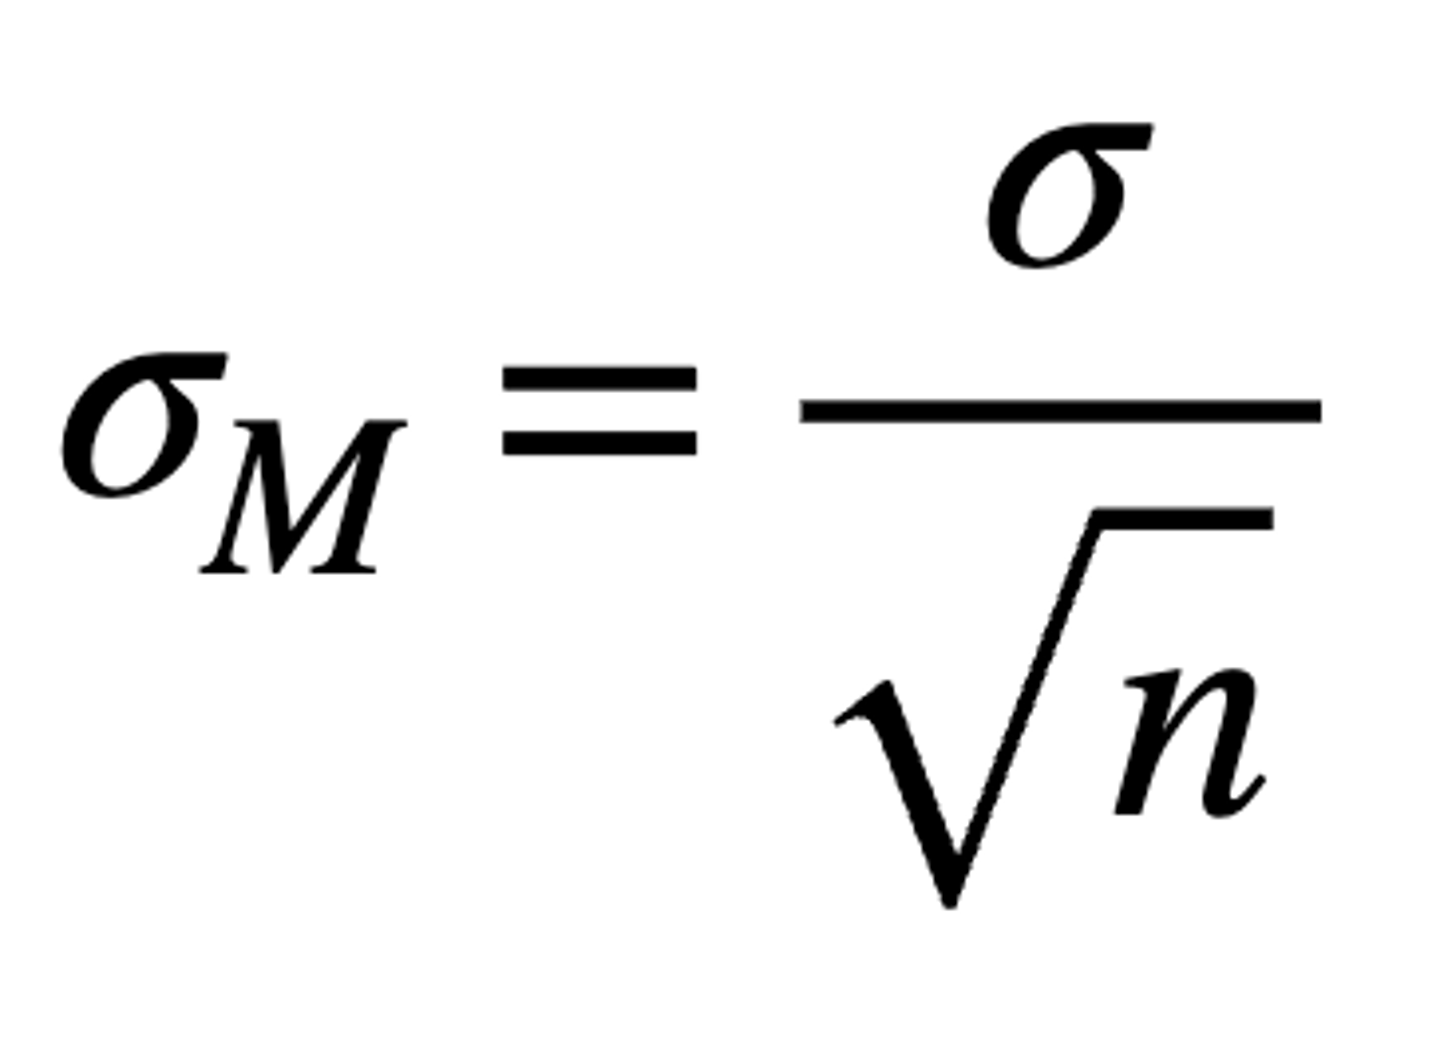
- Have a standard deviation of σ/√n (as n gets bigger, it makes SD smaller)
- Will approach a normal distribution as n approaches infinity (usually when n = 30 or more)
- Distribution of sample means will be normal if population has normal distribution or number of scores is relatively large (> ~30)
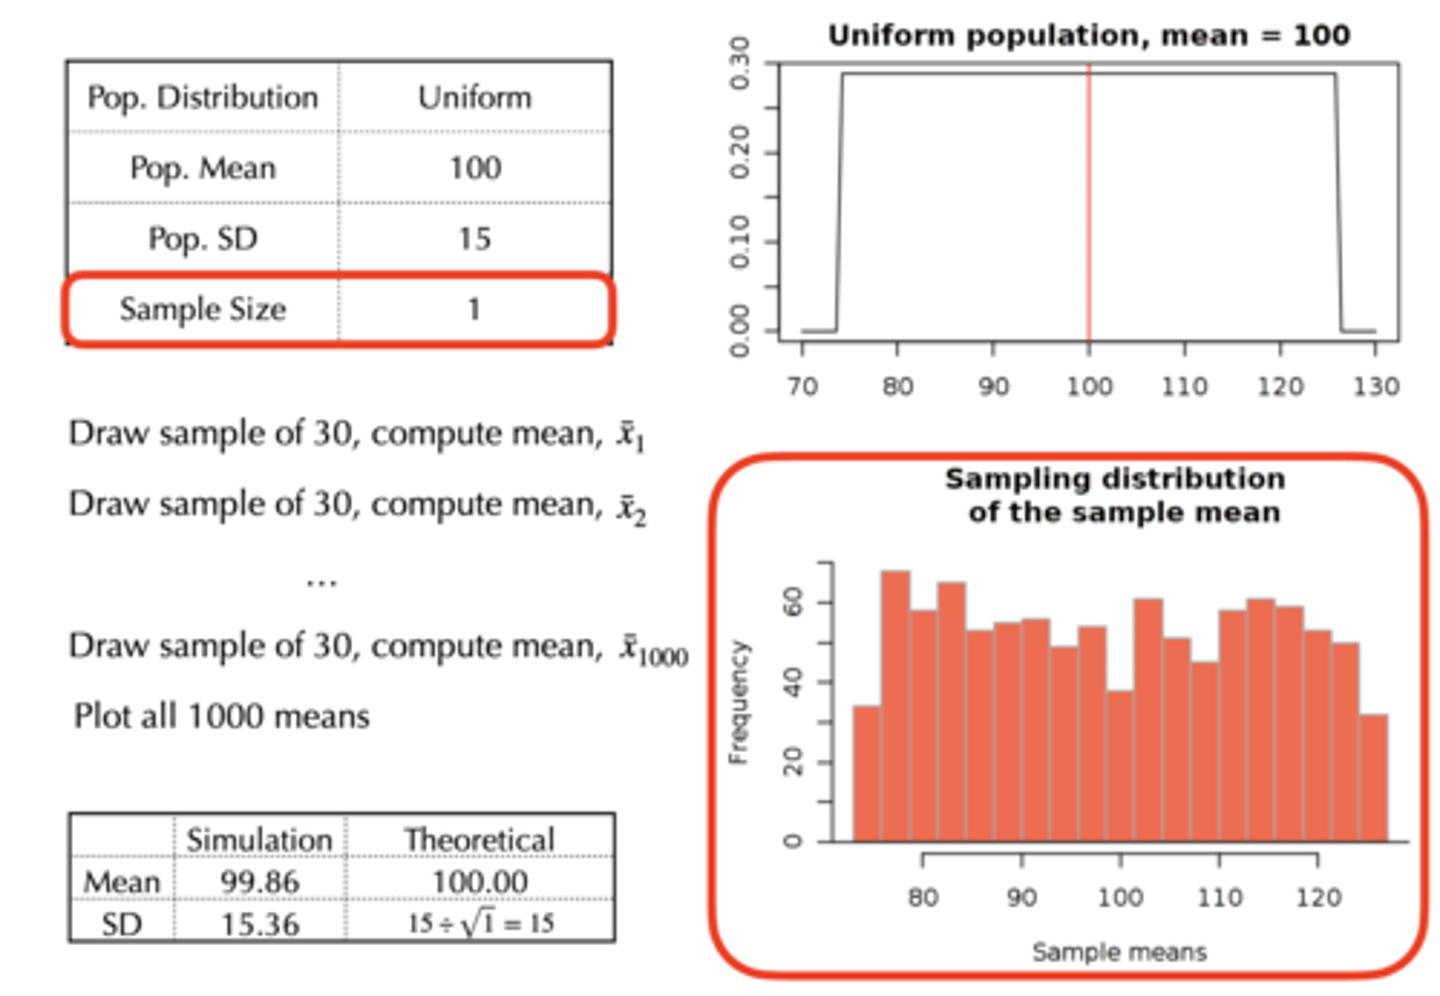
If the first four simulations have n > 30, will the sample distributions be approximately normal?
All sample distributions will be approx. normal (regardless of whether population is normal, bimodal, uniform, skewed - because sample size is large)
If the second four simulations have n = 1, will the sample distributions be approximately normal?
Only one sample distribution will be approx. normal
Normal population will produce a normal sampling distribution; however, a bimodal population will produce a bimodal sampling distribution - the same applies to uniform and skewed populations
Expected Value of M
The mean of the distribution of sample means is equal to the population mean, μ, and is called the expected value of M
The mean of the sampling distribution equals the mean of the sampled population
Standard Error of M
Describes distribution of sample means; when small, all sample means are close together (resembles the population mean)
Measures how well an individual sample mean represents the entire distribution; also, how well it represents μ, the mean of the sampled population
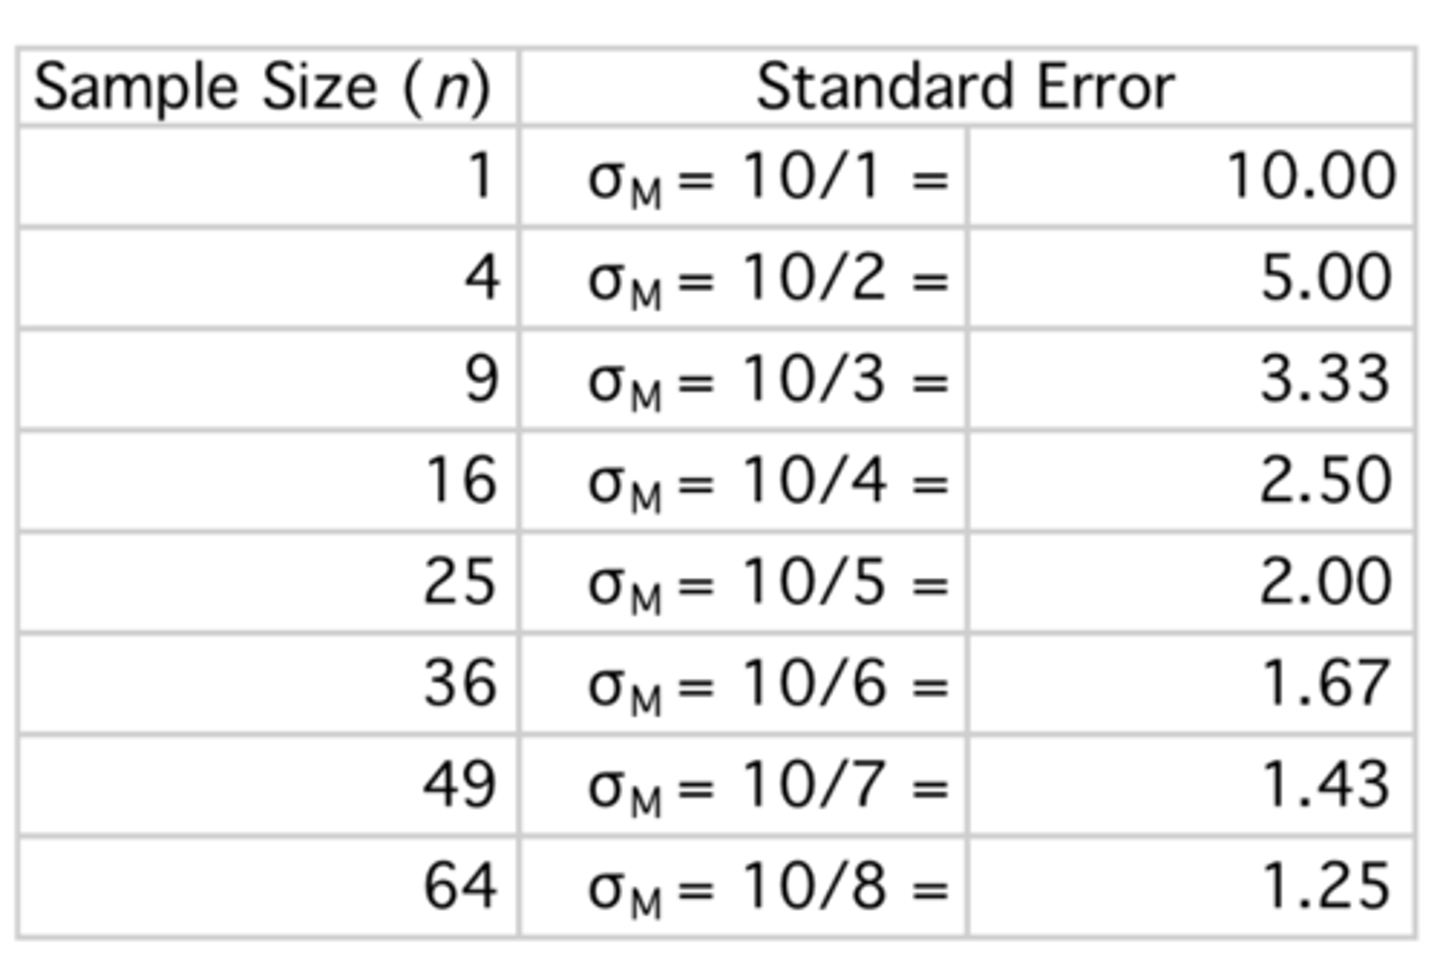
Assume a population standard deviation of 10. As sample size increases, how is standard error affected?
Systematically decreases; as n goes up (denominator), standard error goes down
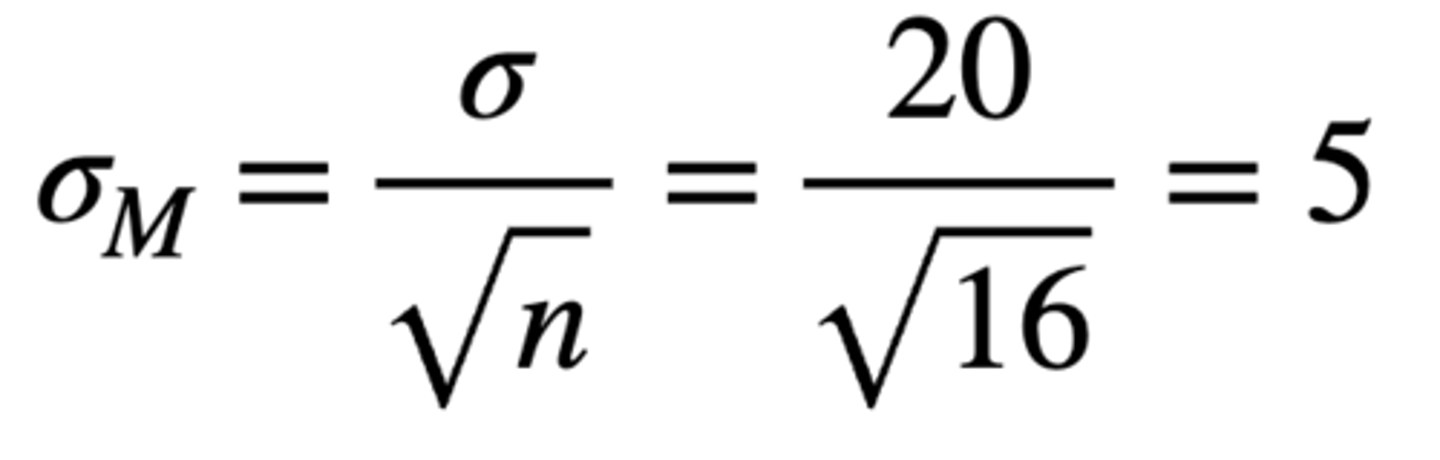
Describe the shape, central tendency, and variability of a distribution of sample means of size n = 16 drawn from a normally distributed population of scores with population mean (μ) = 80 and standard deviation (σ) = 20.
- Shape is normal (because population is already normally distributed)
- Mean of the sampling distribution of the means = population mean = 80
- Standard error of M = 5
The population of scores from the GRE forms a normal distribution with population mean (μ) = 500 and standard deviation (σ) = 100. A random sample of n = 25 students is taken.
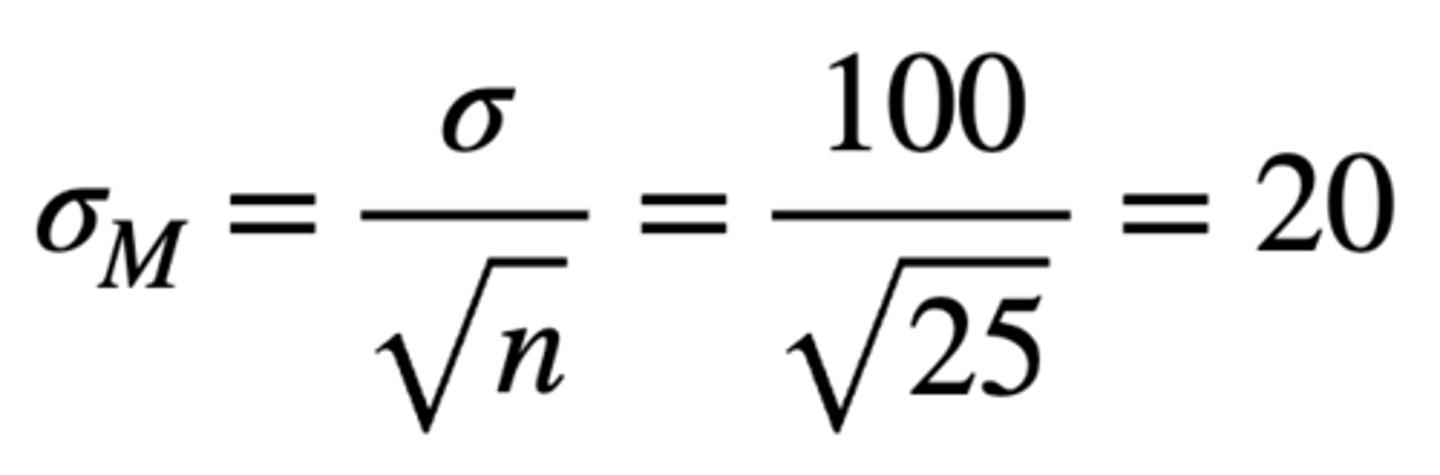
What is the standard error of M?
- Sampling distribution of the means is normal (because population is already normally distributed)
- Mean of the sampling distribution of the means = population mean = 500
- Standard error = 20
The population of scores from the GRE forms a normal distribution with population mean (μ) = 500 and standard deviation (σ) = 100.
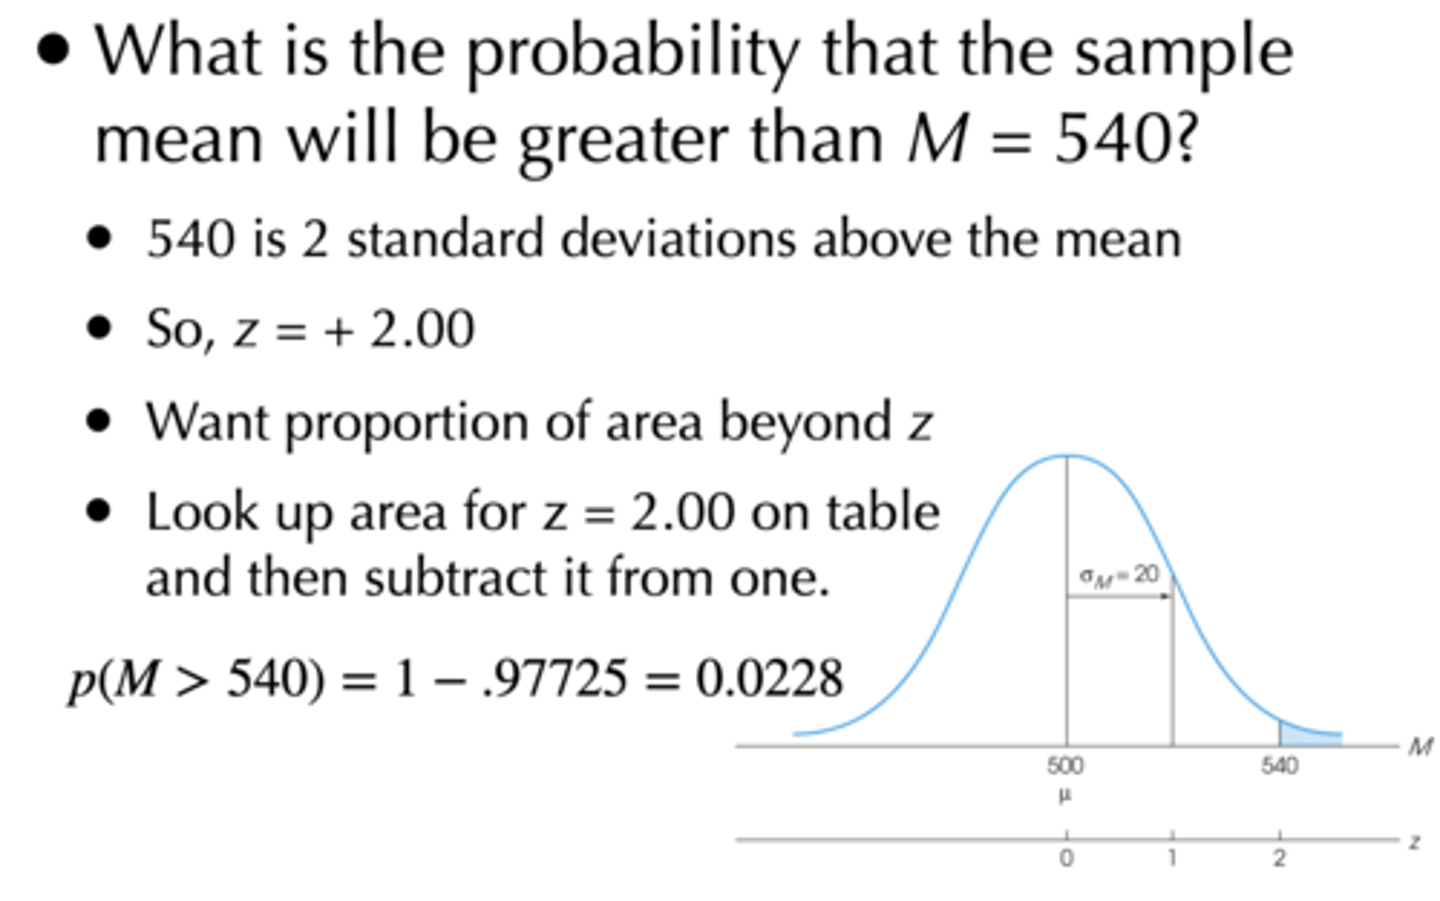
If you take a random sample of n = 25 students, what is the probability that the sample mean will be greater than M = 540?
z = (raw score - population mean / standard error of M)
= 540 - 500 / 20
= + 2.00
p = 1 - 0.97725 = 0.02275
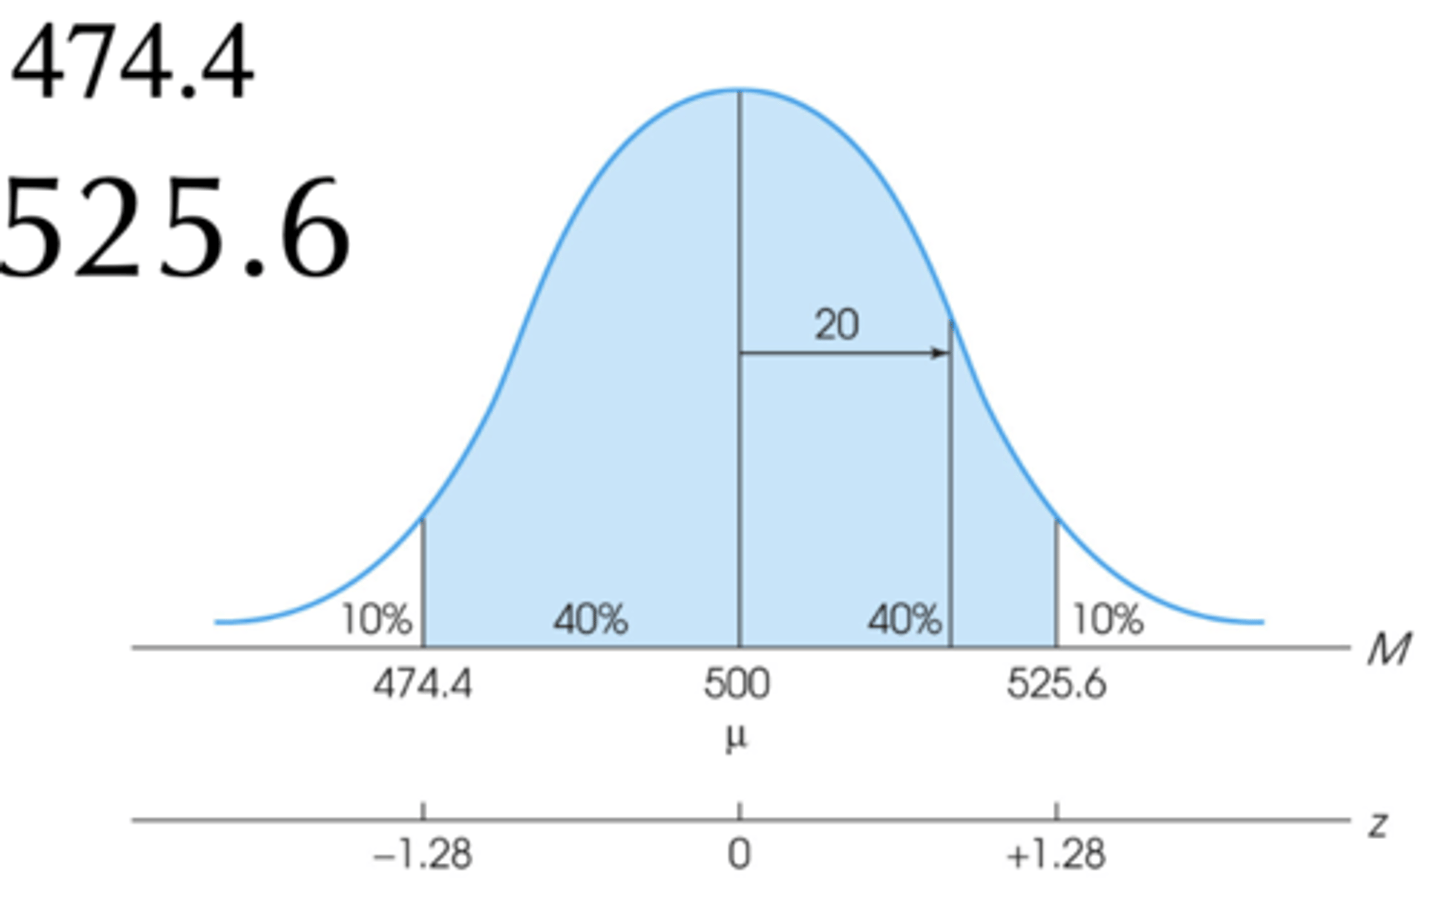
The population of scores from the GRE forms a normal distribution with population mean (μ) = 500 and standard deviation (σ) = 100.
If you take a random sample of n = 25 students, what is the range of scores that you would expect 80% of the time?
Mean of the sampling distribution of the means = 500
Standard error of M = 20
- 80% means that we want area from 40% below mean to 40% above mean
- z-score of 1.28 indicates that 90% of scores are below 0.89973; 40% of scores are between that and the mean
Multiply standard error of M by z-score and add mean population:
- 20(-1.28) + 500 = 474.4
- 20(+1.28) + 500 = 525.6
- Therefore, 474.4 to 525.6