Week 5 (statistical inference)
1/12
There's no tags or description
Looks like no tags are added yet.
Name | Mastery | Learn | Test | Matching | Spaced | Call with Kai |
|---|
No analytics yet
Send a link to your students to track their progress
13 Terms
Why do we standardise a number?
to improve its quality by making it consistent, accurate, and reliable for analysis, integration, and decision-making and compare it
How do we standardise a number?
with z-scores
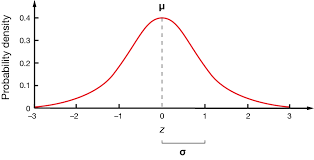
What does the standard normal distribution look like?
e a symmetric, bell-shaped curve with its highest point at the center and its tails tapering off on both sides. standard distribution of 1 mean at 0.
What do z scores and the standard normal distribution have to do with each other?
A z-score indicates how many standard deviations a value is from the mean, allowing for comparison of different data sets and the calculation of probabilities using z-tables and the standard normal curve.
What are the two differences between calculating a z score for an individual and calculating it for a group of people?
the parameters used in the formula and the purpose of the calculation
Dispersion
tells us descriptive uncertainties
Descriptive statistics
way of summarising what we know in a particular data set
standard deviation
range
Inferential statistics
make predictions about a population based on a sample from that population
using information we have in our data to draw conclusions about the population
Inferential uncertainty
Inferential uncertainty
whether the pattern we find in our data is similar to what we’d find due to random processes
result could have been produced by chance is very low than our uncertainty about our conclusions is low
can’t calculate this
so we calculate the probability that a random process could produce a pattern like the one we’ve found in our data
statistical inference
we can use statistical inference to make statements about the unknown
apply samples to whole population
random process are highly predictable over the long time
Test statistic
p value
test statistic
information/error
information is what is going on in the data
error is all the reasons the data might be changing
if the difference is big compared to the error we can be sure that something is going on
p value
probability of a random process producing a pattern
Once u know this we can make a decision about whether we think our data is just due to chance or if there is a meaningful pattern
Why are z scores useful?
You can see where the score sits
interpret a score meaningfully as it can compare to others
can compare with other data as well (different measures)
what proportion of people are scoring higher and lower
represent how far the score is from the mean in standard deviation units