Unit 0: Intro. to AP Biology (Part 2: Statistical Analysis + Task Verbs)
1/31
There's no tags or description
Looks like no tags are added yet.
Name | Mastery | Learn | Test | Matching | Spaced | Call with Kai |
|---|
No analytics yet
Send a link to your students to track their progress
32 Terms
Null Hypothesis (H₀)
The hypothesis that states that there is no statistically significant difference between two groups in an experiment.
Alternative Hypothesis (Hₐ)
Opposes H₀, assumes a significant effect or difference exists (difference, association, slope ≠ 0)
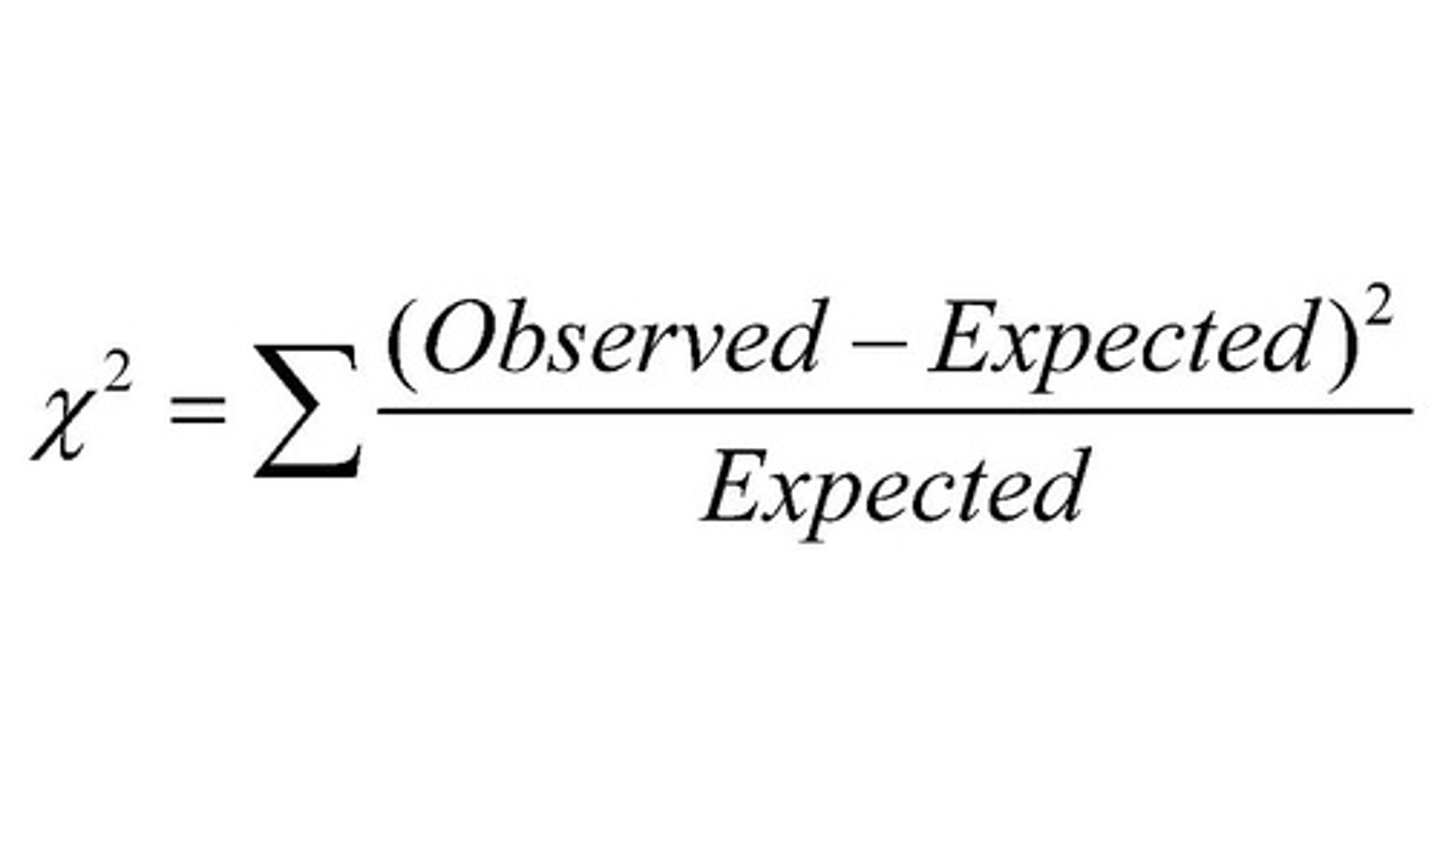
Chi-Square Test
Used to compare the expected results and the observed results of an experiment.
Degrees of Freedom (df)
Number of possible outcomes in an experiment minus one.
For goodness-of-fit: df = categories - 1
For test of independence: df = (rows-1)(columns-1)
P-Value
Probability that the observed data would be produced by random chance alone.
Low p‐value (< α) ⇒ reject H₀
Descriptive Statistics
Statistics that are used to describe data sets.
(Mean, Median, Mode, Standard Deviation)
Mean (x̄)
The sum of all the members of a data set divided by the number of members in the data set (aka: average)
Formula: x̄ = Σxi / n
Median
The midpoint of a data set (the point at which half the members of the set are below and half the members of the set are above.
Mode
Most frequent data value(s).
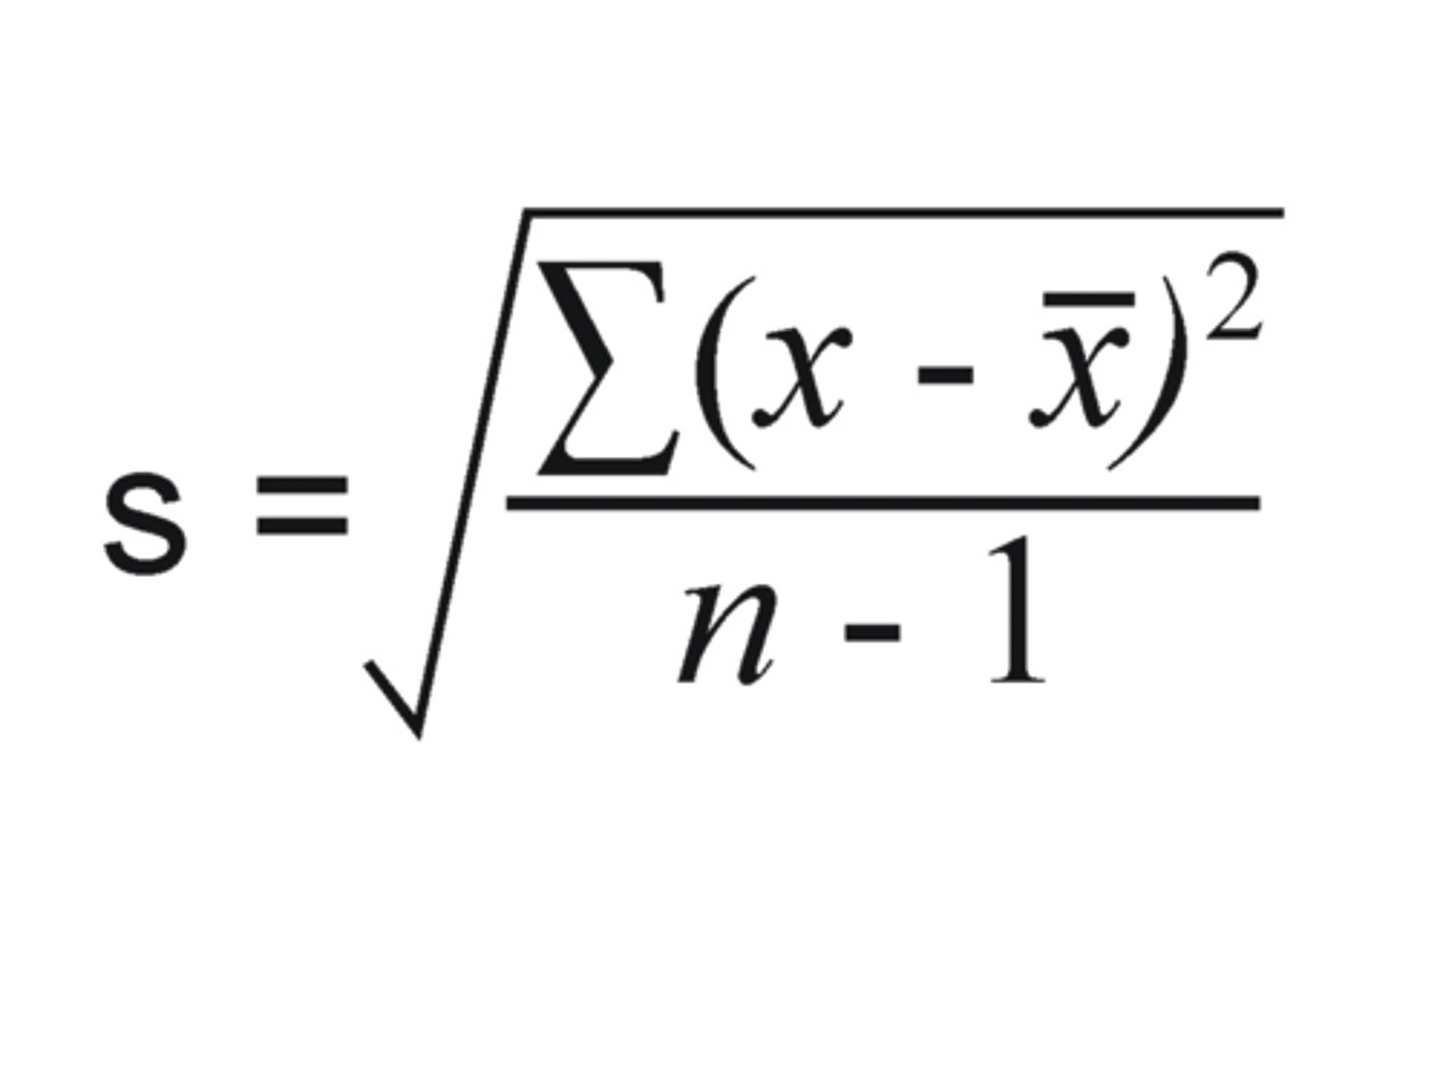
Standard Deviation (s)
A way to average how close each member of a data set is from the mean of the data set. Larger standard deviations usually indicate more variability in the data set.
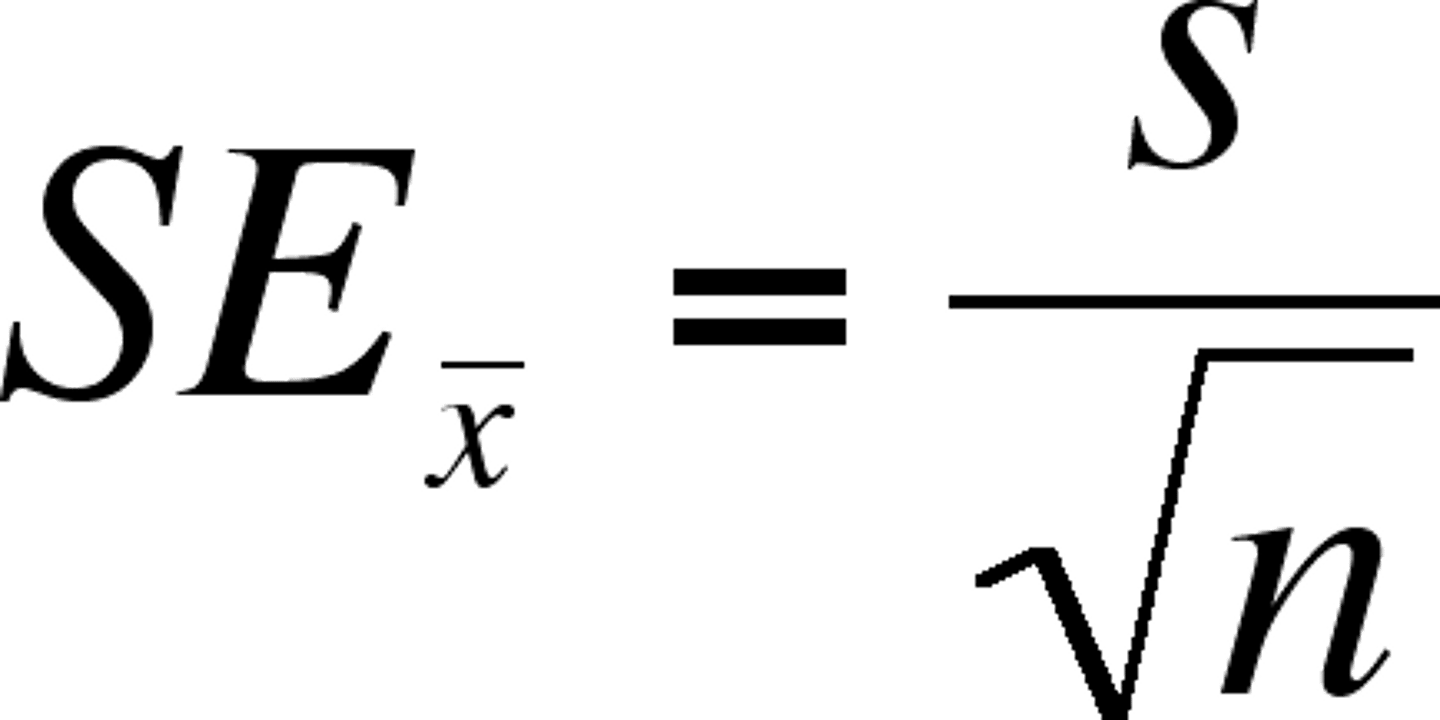
Standard Error of the Mean (SE)
The standard deviation of a data set divided by the square root of the number of the members of the data set.
Larger sample sizes usually lead to smaller standard errors of the mean.
95% Confidence Interval (CI)
The interval in which the mean of an experiment would fall 95% of the time, if an experiment were repeated.
Upper Limit of 95% Confidence Interval
Calculated by adding two time the standard error of the mean to the mean of the data set.
Upper limit = statistic + (critical × SE)
Lower Limit of 95% Confidence Interval
Calculated by subtracting two times the standard error of the mean from the mean of the data set.
Lower limit = statistic - (critical × SE)
Task Verb: Predict
State what you think will happen if a change is made in a system or process.
(Estimate a result based on a model or trend)
Task Verb: Justify
Based on evidence, provide reasoning to support your claim/predictions.
Task Verb: Make a Claim
Make a statement based on the available data or evidence.
Task Verb: Explain
State "why" or "how" something happens. Go beyond numbers -- tie your response back to the content of our course.
Note: This is more demanding than describing.
Task Verb: Support a Claim
Provide evidence to defend your claim.
Your response should be backed with data, context, and calculations.
Task Verb: Describe
Note the charactistics of something. (Shape, Color, Size, etc).
Task Verb: Identify
Provide the information that is asked for (note: this is less demanding than describing).
Task Verb: Calculate
Perform the requested calculation, and always show you work and your units.
(Note: you will lose points on FRQ's if units are not provided!)
Task Verb: Construct
Make a graph/table or a diagram that illustrates data or a relationship.
(Note: you will lose points if units are not provided!)
Task Verb: Determine
Make a conclusion (find an answer) based on evidence.
Task Verb: Evaluate
Assess the validity or accuracy of a claim or hypothesis -- consider context, assuptions, significance, etc.
Task Verb: State
Give a null hypothesis or alternative hypothesis that is supported by data/evidence.
Task Verb: Compare
Provide similarities and/or differences between groups or distributions, explicitly using comparison phrases like "greater than," "approximately equal to," etc
On the AP Exam, how should you respond to 'Identify' or 'State'
Provide a brief answer—just the label, name, or value—no explanation needed.
What's expected when I see 'Determine' or 'Find'
Show your work! Apply definitions or formulas and perform calculations to get the answer.
What extra is required for 'Justify' or 'Verify'
Evidence + Reasoning!
The points for this will typically be found in your Reasoning, but your reasoning must be based on evidence.
How should I handle 'Explain' or 'Interpret'
Tie results back to context. Use complete sentences to show why or what the evidence or data suggest.
What is expected by 'Evaluate'
Judge the quality or accuracy—assess assumptions, limitations, or strengths of a claim or result. May require calculation plus explanation.