Food Service Final SG
1/131
There's no tags or description
Looks like no tags are added yet.
Name | Mastery | Learn | Test | Matching | Spaced | Call with Kai |
|---|
No study sessions yet.
132 Terms
Aesthetic factors of menu planning
flavor
texture
color
shape
preparation
management factors of menu planning
Food cost
Production capabilities
Type of service
Availability of food
Customer satisfaction
equipment needs related to menus
sustainability and menu planning
carbon footprint of food
Global hunger & malnutrition
Unequal economic access to nutritious food
Precariousness of fresh-water supplies for irrigation
Equity for food system workers
menu planning process
1. Dinner entrees 1st for entire cycle - balance between low & high cost items
2. Plan lunch entrees - don’t duplicate
3. Decide on starch for each item
4. Select salads, accompaniments, & appetizers
5. Plan desserts
6. Add breakfast after lunch & dinner are complete
7. Review completed menu for duplication and flow of
menu
challenges of purchasing
• Seasonality
• Volume
• Quality
• Specification & packaging consistency
• Competitive cost
pros and cons of fresh produce
• Good quality if in season
– Taste
– nutrition
• Good price if in season
• More storage
• More labor associated with it
• ↑ spoilage
pros and cons of frozen produce
• Convenient - available
• Low labor cost
• Less storage
• Less spoilage
• Lower food cost
• Good nutritive value
pros and cons of canned produce
• Quality
– Nutrient
– Taste
• Lower food cost
• Lower labor cost
• No spoilage
• Easy storage
pros and cons of convenience foods
• Higher food cost
• Lower labor cost
• Look at facility
• ↓ storage
• Uniform product
• ? Quality, nutritive value, variety
value analysis
Methodical analysis of all components of an existing product or service with the goal of discovering & eliminating unnecessary costs without interfering with the effectiveness of the product or service
Looking for best buy
Make or Buy decisions
quality, quantity, service, & cost
forecasting - time series model
moving average
Uniformly weighs past observations
All numbers are weighted evenly
exponential smoothing
Recent values are given more weight
forecasting - causal model
regression analysis
much more complex and expensive
look at several variable and the relationship between variables
selling price, packaging, # of items, temperature
food processing plants
forecasting - subjective model
naïve model
use when relevant data is scarce or when relationships between data do not tend to persist over time
Relies on opinions
Delphi technique
give to experts individually to complete questionnaires on a topic
Summarized
Revised for consensus
time consuming & expensive
informal purchasing
Purchasing small amount
Item only available by few sources
Need is immediate
Market is uncertain – prices fluctuating a great
deal, ? SupplySize of operation small
types
open market
blank check
cost plus
negotiated bid
open market buying
• cherry picking (line item bidding)
• bottom line (all or nothing bidding)
blank check buying
• risky, item in short supply
cost plus buying
• buyer purchases at cost + % markup or $ markup
formal buying
• Competitive Bids
• Large facilities or government
• Fixed for large # of items for a long period
of time
• Buyer draws up
– specifications
– method of delivery
– payment details
• types: line-item, all or nothing, contract
line-item bidding
– Time consuming
– Usually costs more for both buyer & seller
all or nothing bidding
– Bottom-line approach
competitive bids
Seller
submit sealed bids by certain date
open at one time
award contract
Binding Contract
agreement between 2 or more parties
• offer
• acceptance
• consideration
express warranty
Promises, specifications, samples, and descriptions of goods that are under negotiation. For a certain period of time promises are made
Implied warranty of merchantability
– Suppliers “puff ” the virtues of their products for the purpose of making a sale
– must reasonably conform to an ordinary buyer's expectations
Implied warranty of fitness for a particular purpose
Buyer relies on the supplier’s skill or judgment to select or furnish suitable goods. when a buyer relies upon the seller to select the goods to fit a specific request
central purchasing
cost center (just expenses)
Personnel in one office does all the purchasing for all the units in that organizations
group purchasing
– Union of separate units (hospitals) not related to a single management
– Large volume purchasing- economical
warehouse purchasing
buying in bulk to store in a warehouse
Just in Time (JIT) purchasing
– Purchase products as need for production & immediate consumption
– $ not tied up in inventory
flow of purchasing
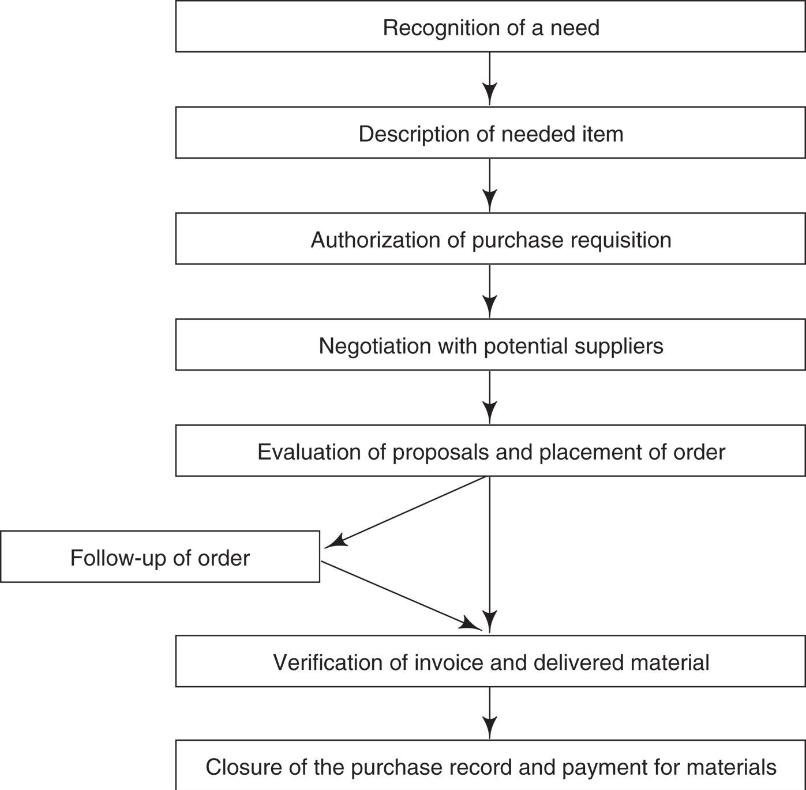
requisition
Form used by foodservice manager to request items from purchasing manager or department
purchase order
– made by buyer
– written record of items ordered
– item, quantity, specifications, prices, delivery date
invoice
– made by vendor
– delivery slip list items & prices
– extension
– check against items received & PO
– check extensions & total
direct issues
items directly from receiving to production
storeroom issues
written record when food is removed from storerooms
physical inventory
– actual count of goods on hand at the end of an accounting period
– usually do 1X/month
– put prices on products and extend to determine value
perpetual inventory
• Running record of each item in the storeroom, add purchases, subtract issued items
• At any time can value inventory
• Still must do physical inventory
• Daily or Direct Issues + Storeroom Issues = Food Cost
inventory turnover ratio
• How many times the inventory turns over in a year
• Total Cost of Food Sold / Average Food Inventory
• High # - small inventory- $50,000 ÷ 500= 100 times/year
• Low # - large inventory - $50,000 ÷ $2,000 = 25 times/year
• 2-4 times per month is often desirable
par stock ordering method
• Bring stock up to the par level EVERY time an order is places regardless of how many you have in inventory
• Par is 10 cases and you have 8 cases, order 2 cases
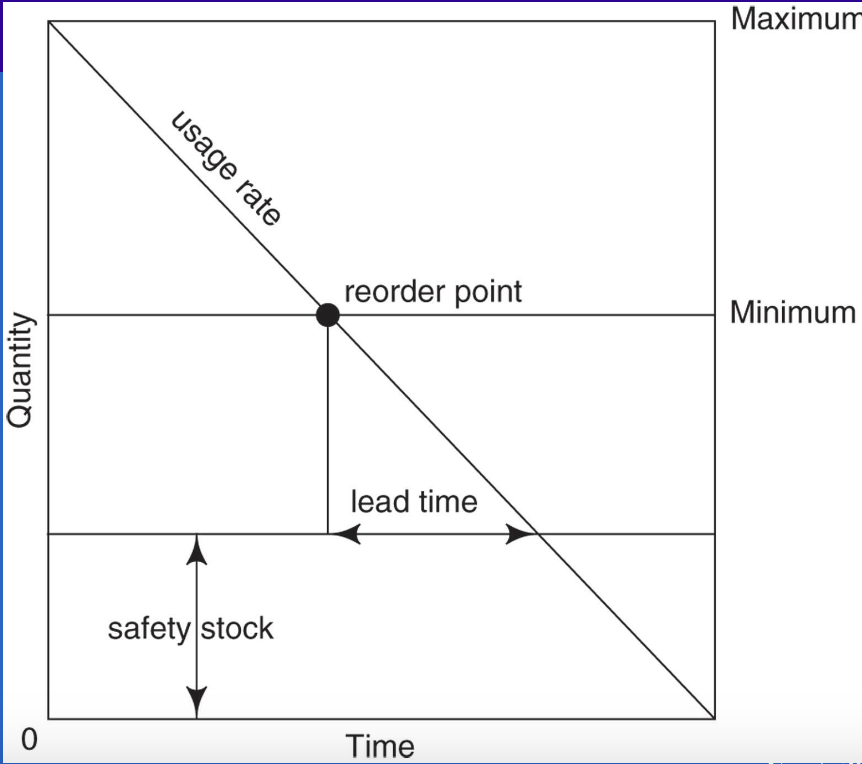
Fixed order quantity inventory system
Determine the order point
(Average daily use) (lead time) + safety stock
– Lead time= # of days from placing the order until
delivery
– Safety stock = small back up supply
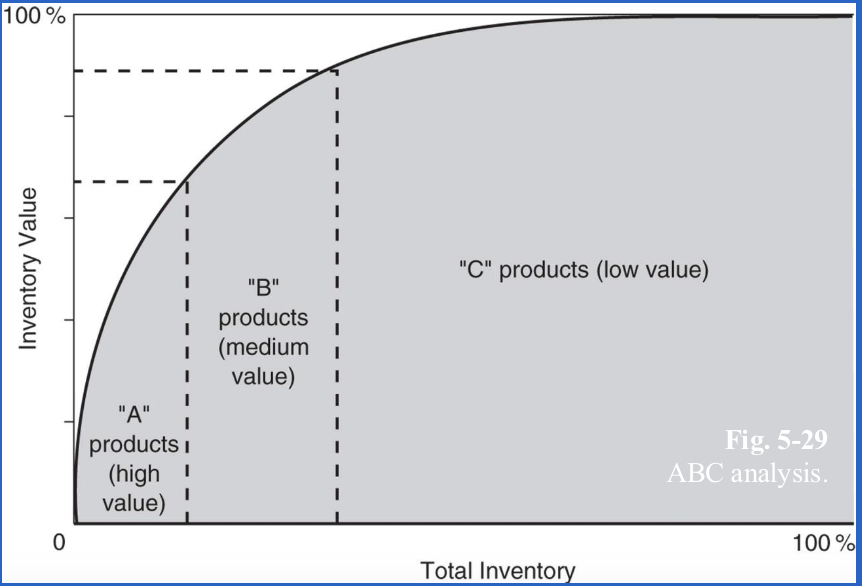
ABC method of inventory control
method of classifying items according to value
A Class only about 15-20% of inventory items account for 75-80% of the value of inventory
keep a minimum amount
B Class lesser value items 10-15% of items but value of 20-25%
C Class $ value 5-10% but make up 60-65% of inventory item
Minimum-Maximum method of inventory control
Goal is to have 0 of an item when shipment is received
Maximum is the correct # to order
Need to establish a safety factor
Need to have adequate LEAD TIME interval between ordering & receiving
Reorder point - lowest stock level that is safe
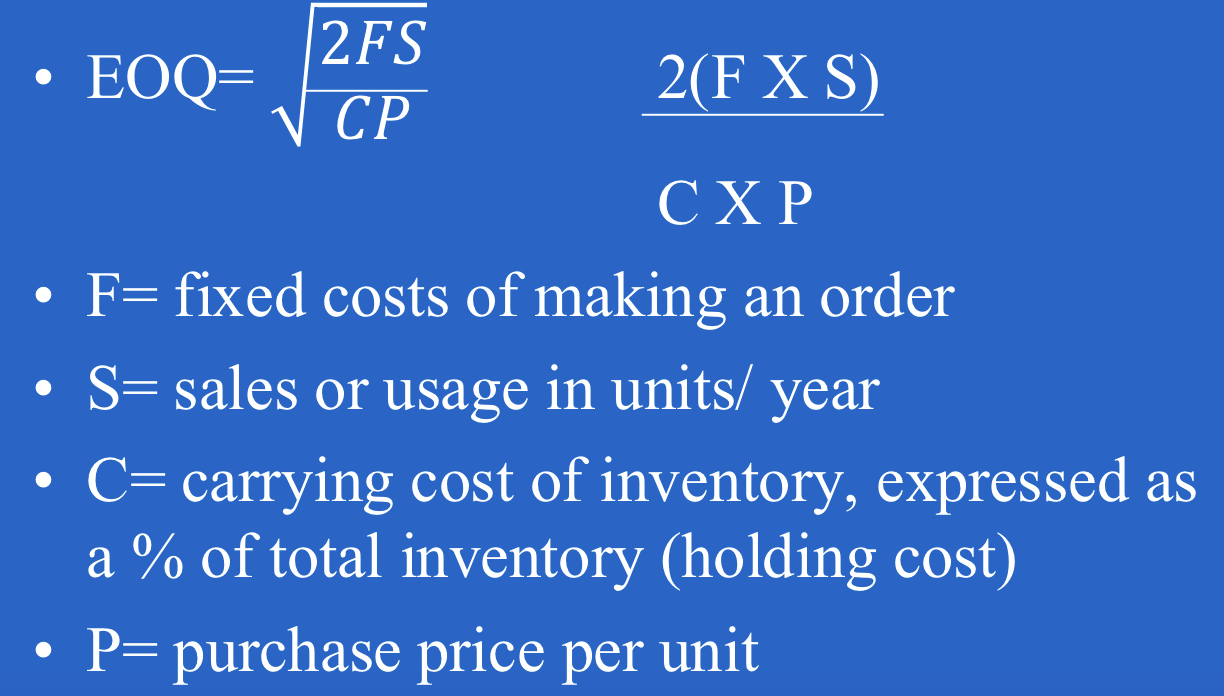
EOQ inventory control method
Attempts to find the quantity that minimizes both purchasing and inventory costs
Order size that is most economical
Inventory valuation: Actual Purchase Price
– specific identification
– price at actual cost of item
– detailed record keeping
– unrealistic
Inventory valuation: Weighted Average
– average cost method
– items marked at purchase price
Inventory Valuation: FIFO
– Use the most recent price paid for an item
– reflects flow of goods value of inv highest
– cost of goods sold lowest
– Used most frequently in food service
Inventory valuation: LIFO
– Use the oldest price paid for an item
– feel that this keeps up with current production inv is lowest
– cost of goods sold highest (used to reduce profit)
liquidity current ratios
current assets / current liabilities
acid test ratios
looking at actual ability to pay

inventory turnover ratio

percent occupancy

meals per labor hour

revenue
total amount of money an entity brings in from its activities during a specific period
cost of sales
cost of the raw food and beverage sold (and labor?)
gross profit
Profit shown after subtracting raw food and beverages (cost of sales) from sales/ revenue
net profit
Profit shown after ALL expenses have been deducted from sales
calculate number of FTEs
employee turnover
Total number of separations from previous year
Average number of employees company has- not FTEs actual numbers; # at beginning and end ofyear then average
calculate total number of employees needed
Multiply the number of full time employees by 1.55
trend analysis
Comparison of results several periods of time
usually as an absolute number or a %
oftentimes as a graph to show trends
sales, food, labor, operating expenses
common size statements
Financial statements expressed as percentages
Might have assets as 100% and then look at categories as a percent of the whole
operating budget
Sales/ revenue portion of the budget
- look at both internal & external influences
- review past performance & budgets
- changes in prices/rates
- seasonal variations
expenditures
- food what are anticipated changes?
- labor what is happening with ee salaries, cost of living, changes in taxes?
- Operating expenses
incremental budget
uses an existing budget as a base & projects changes for the ensuing year
zero based budgeting
start from scratch
fixed budget
prepared at one level of sales or revenues
flexible budget
adjusted to various levels of operation or sales
expense budget
• Personnel costs
• Fringe benefits
• Overhead
– Heating, light, telephone
• Depreciation
– Converting an asset to an expense
• Cost of goods
• Rent expense
• Insurance
• Taxes
cash budget
• cash inflow and outflow
• seasonal changes
• large cash outlays
capital expenditure budget
• Improvements, expansions, & replacements
• Buildings, equipment, & land
• Over a certain amount of money, oftentimes
$5,000
• Often project for 5 - 10 years
net present value
– Preferred method of evaluating expenditure
– Value of a $ today not = to a $ - 2 yrs from now
– Initial investment
– Expected income or cash savings
– Cost of capital
– Table of discounted cash flow factors
profit margin
net profit / sales
return on equity
net profit / equity
return on assets
net profit / total assets
average customer check
total sales / total # of customer checks
meals per FTE
number of meals / number of FTEs required to produce
labor minutes per meal
total labor minutes to produce meals / number of meals served
layout based on menu
• Type of delivery system
– Conventional
– Commissary
– Ready Prepared
– Assembly Serve
• What equipment you need and where it will be placed
• Good flow of materials and labor
flow of food service
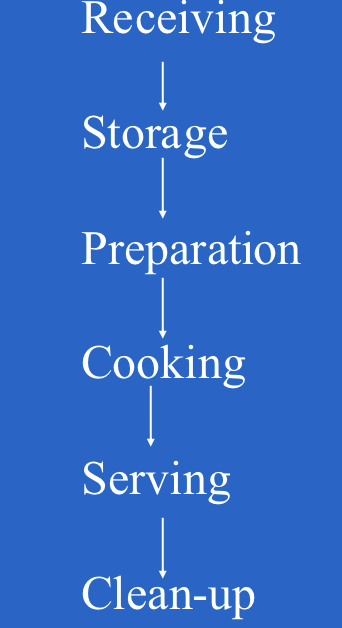
conventional food service
– Foods are purchased in various stages of preparation for an individual operation, and production, distribution, and service are completed on the same premises
– Cook serve
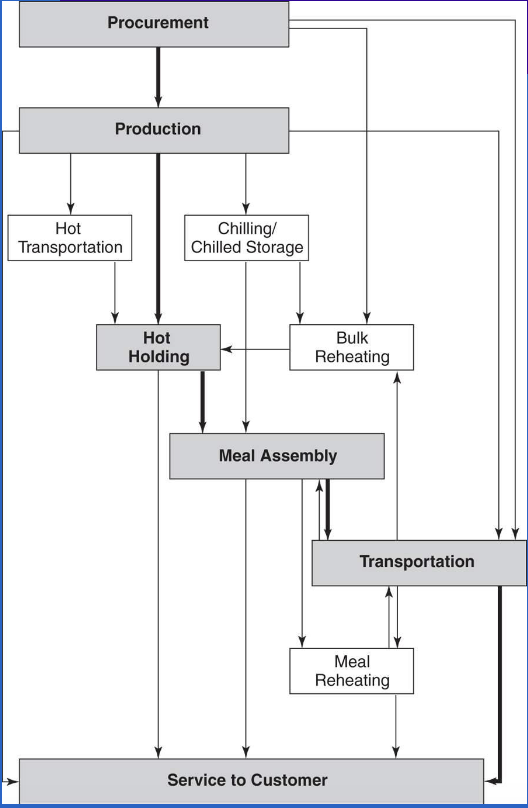
ready prepared food service
• Menu items are produced and held chilled or frozen until heated for service later.
– Food items are stored & recorded in storage & withdrawn when needed for production.
– After production, items are stored in refrigerators or freezers, and entered in thedistribution inventory.
commissary food service
• centralized procurement & production facilities
• distribution of prepared items to several remote areas for final preparation & service
• central commissaries, commissariats, or food factories
• Satellite service centers
assemble/serve
• Assembly/serve foodservice occurred primarily because of the market availability of foods that are ready to serve or require minimum cooking.
– convenience-food foodservices, or minimal cooking concept
– Another factor has been chronic shortage of skilled personnel in food production & increasing labor cost
• limited processing needs to occur
point of first use
Keep products close to where they will be used
economy of motion
– Store based on usage; heavy use within normal reach
– Heavier products lower
charente
collaborative planning session for design project
bubble diagram
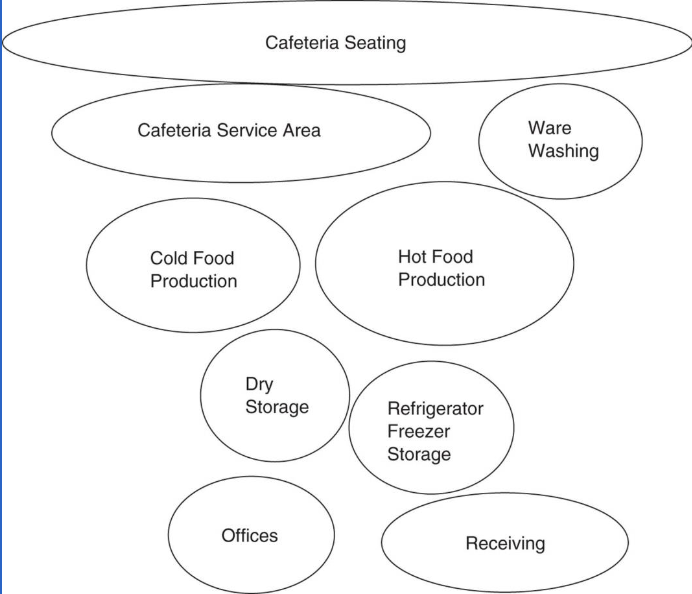
factors to consider when planning a design
• Quantity of food and supplies
• Amount and kind of production (to determine equipment)
• Type of delivery system
• How food served to the customers
• to renovate or build
• Operating cost of the facility
• Any food safety issues of concern
• # of employees
• Any future plans
blueprints
– Specifics
– Mechanicals, electrical, plumbing
– Drawn to scale- usually ¼ inch = 1 foot
– Accompanied by a specifications book
LEED certification
sustainability certification
sustainability in food service
green energy efficient equipment
water conservation
waste management
dry storage factors to consider
– must be off floor 10” to 12” for air flow
– use vertical space
– opaque windows
– one door
– Secured
– 50-70 degrees F
conduction
transfer of heat by direct contact
convection
hot air circulating
radiation
energy transferred by waves of heat or light
induction
cooking vessel made of specific magnetic material
faster and energy efficient
types of heating equipment
• Heat lamps
• food warmers
• pass through refrigeration & warmers
• drawers
• lowerators
• steam tables
clean up equipment
garbage disposals
pulpers - dehydrates the product
recycling
direct lighting
light aimed at specific location