Correlation and Regression
1/16
There's no tags or description
Looks like no tags are added yet.
Name | Mastery | Learn | Test | Matching | Spaced | Call with Kai |
|---|
No study sessions yet.
17 Terms
Correlation analysis
method used to measure the strength of relationship between two or more variables,
positive correlation
Negative correlation
Zero correlation
Types of correlations
Positive correlation
exists when high scores in one variable are associated with high scores in the second variable
Negative correlation
exists when high scores in one variable are associated either with low scores in the second variable
ZERO CORRELATION
exists when high scores in one variable tend to score neither systematically high nor systematically low in the other variable.
Scatter Diagram
A graph of plotted points that shows the
relationship between two sets of data.
Perfect correlation= 1.0
high= 0.80-0.99
moderately high= 0.60-0.79
Moderate= 0.40-0.59
Low= 0.20-0.39
Slight/negligible=0.01-0.19
No correlation= 0
Perfect correlation=
high=
moderately high=
Moderate=
Low=
Slight/negligible=
No correlation=
PEARSON PRODUCT-MOMENT CORRELATION COEFFICIENT
The most common statistical tool in
measuring the linear relationship between
two random variables,
Pearson Product-Moment Correlation Coefficient or Pearson r
x and y, is the linear
correlation coefficient commonly called
the ____________ or _________for short.
KARL PEARSON
x and y, is the linear
correlation coefficient commonly called
the Pearson Product-Moment Correlation
Coefficient or Pearson r for short. This
formula was developed and perfected by
__________
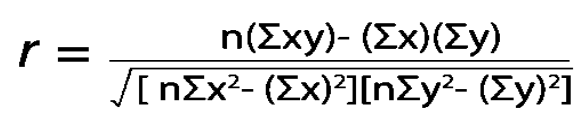
Pearson Product-Moment Correlation
Coefficient FORMULA:
TEST OF SIGNIFICANT OF THE CORRELATION COEFFICIENT
It is important that the value of the
correlation coefficient be tested if it is
significant or not. If it is found to be
significant then, there is a relationship that
exists between the two variables.
Otherwise, the computed r is due to
chance alone.
SPEARMAN RANK-ORDER CORRELATION
COEFFICIENT
The Pearson product-moment correlation
coefficient is most appropriate when the
data are interval or ratio scale. For ordinal
data, the ___________of the ranks of the variables is
used to determine the strength of
relationship between two variables.
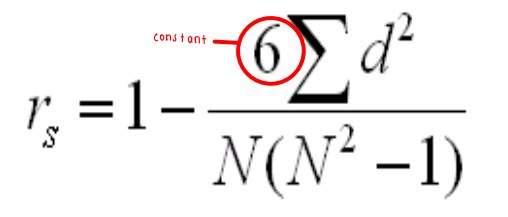
FORMULA OF Spearman Rank-Order Correlation Coefficient
REGRESSION ANALYSIS
deals with the estimation of one variable
based on the changes or movements of the
other variable.
y=a + bx
formula of regression analysis
y= criterion measure
x= predictor
a= ordinate or point where the regression line corsses the y-axis
b=beta weight of the slope of the line
y=
x=
a=
b=