Specialist vs. Generalist Species & Population Dynamics in Ecology
1/68
There's no tags or description
Looks like no tags are added yet.
Name | Mastery | Learn | Test | Matching | Spaced | Call with Kai |
|---|
No analytics yet
Send a link to your students to track their progress
69 Terms
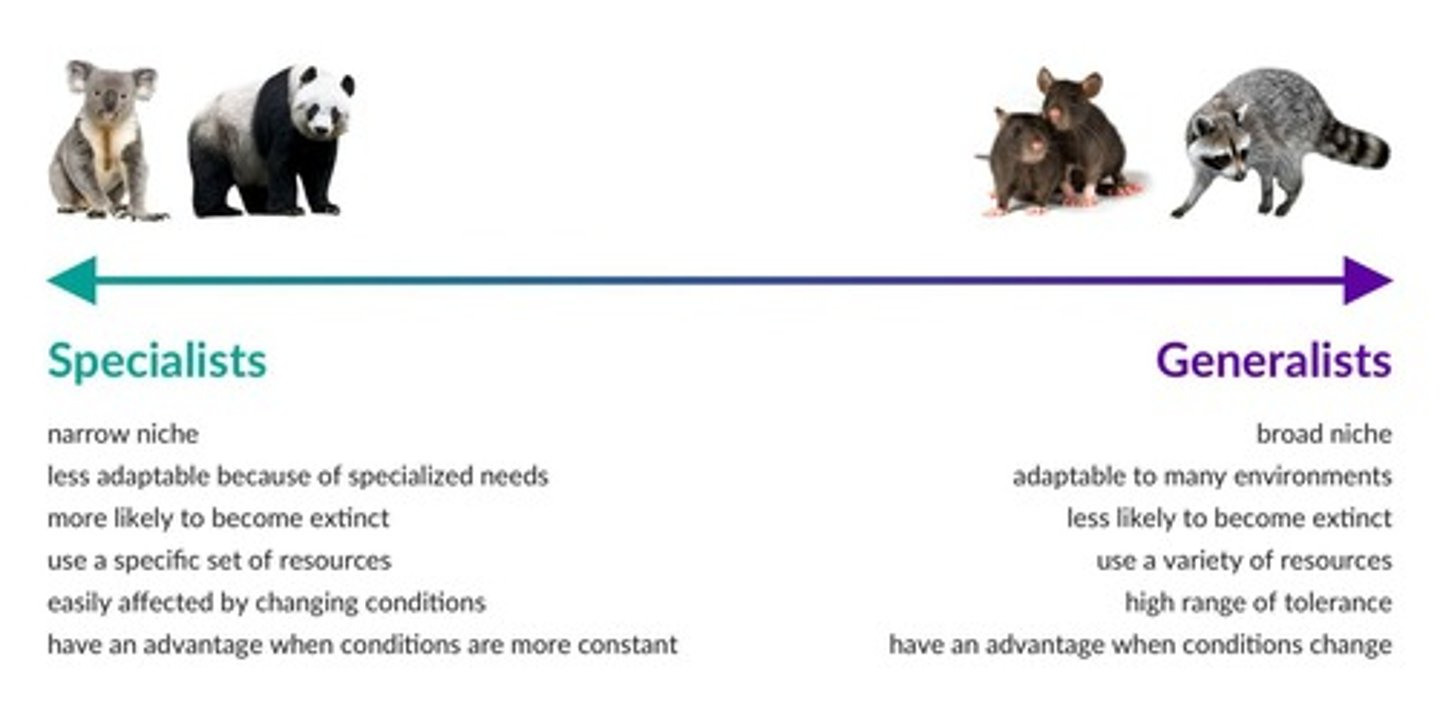
What defines a specialist species?
A specialist species has a smaller range of tolerance and specific food requirements, making them more prone to extinction.
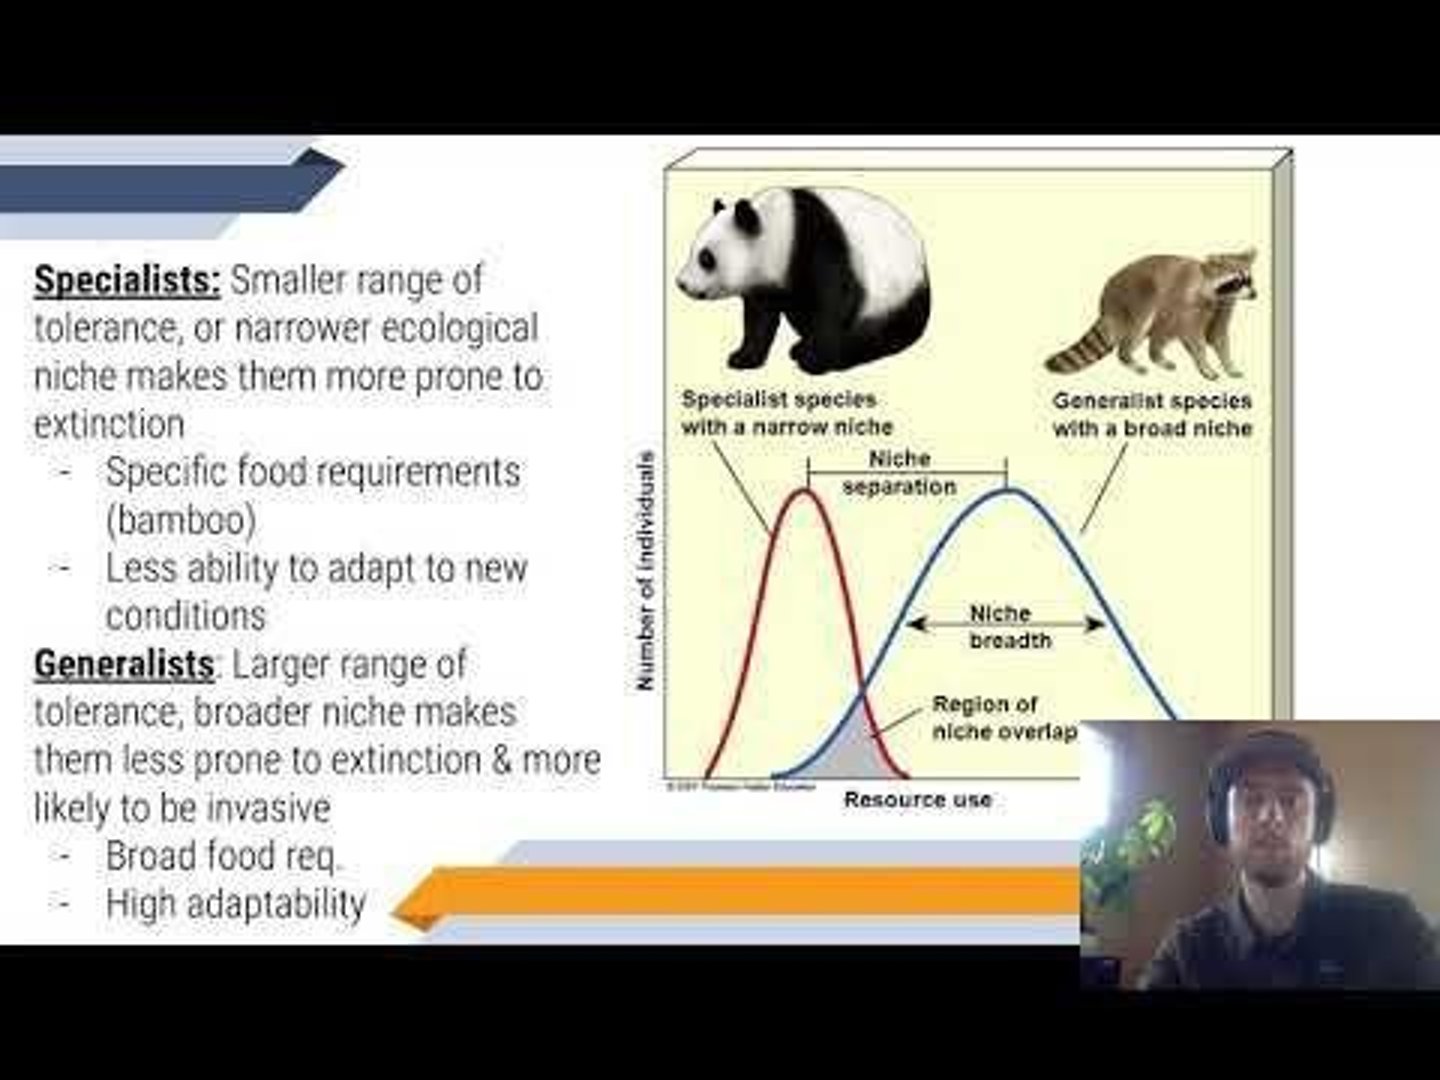
What is a key characteristic of generalist species?
Generalist species have a larger range of tolerance and broader ecological niches, making them less prone to extinction and more likely to be invasive.
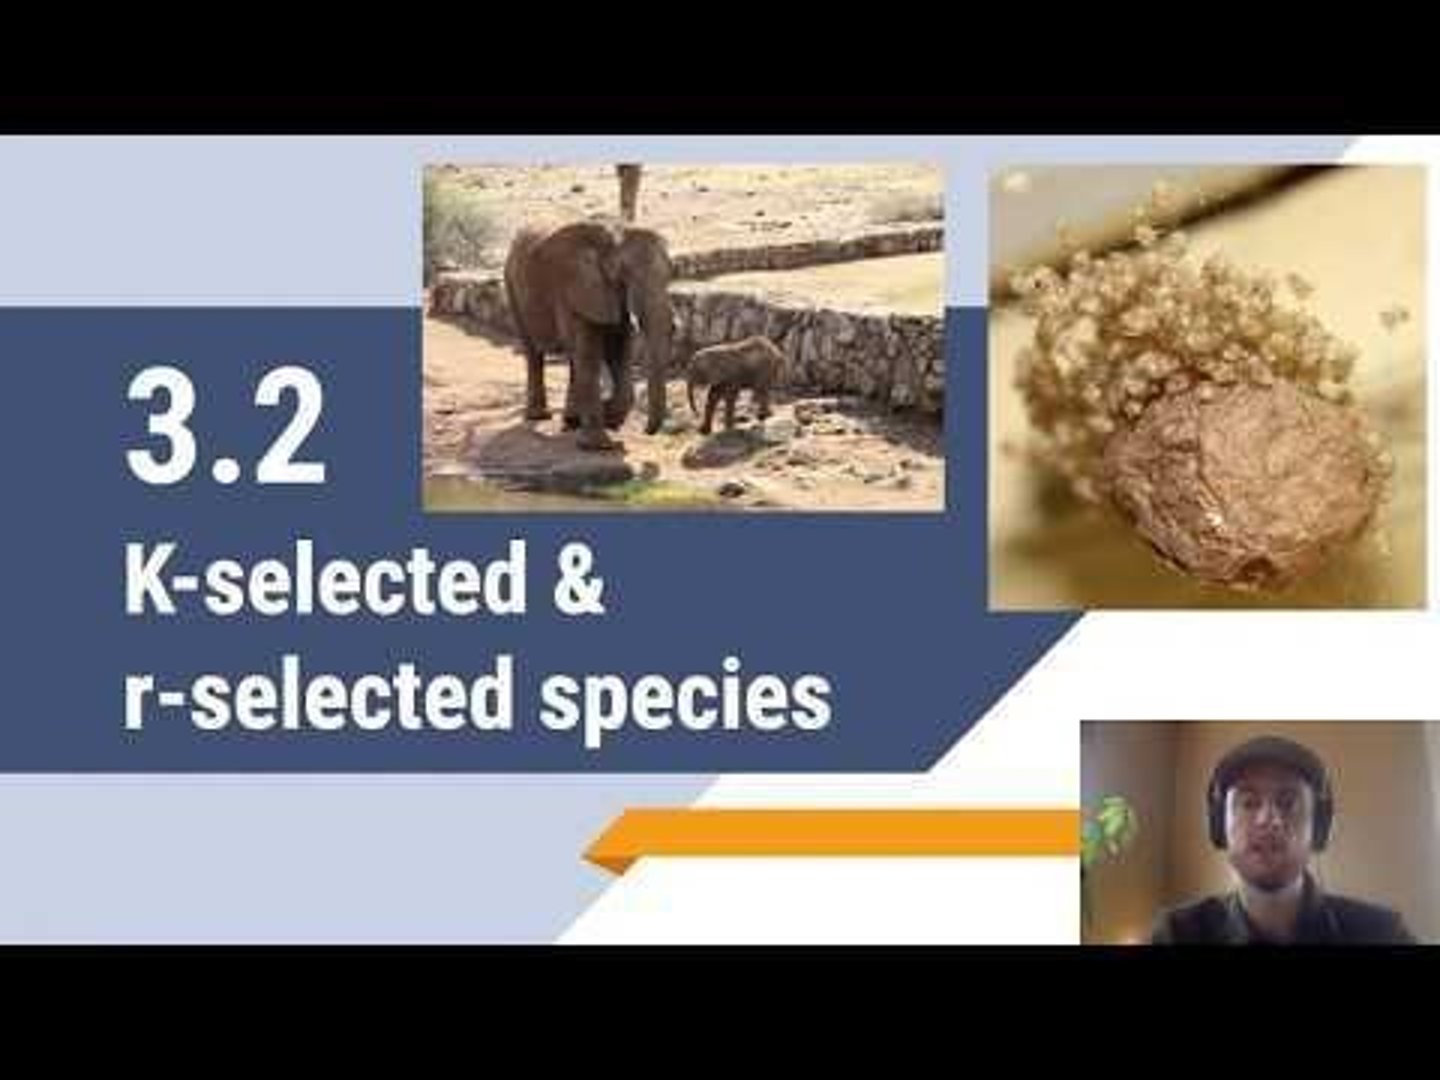
What are r-selected species characterized by?
R-selected species are characterized by producing many offspring with little to no parental care, leading to a high biotic potential and rapid population growth.
What are K-selected species characterized by?
K-selected species are characterized by having fewer offspring with high parental care, resulting in a lower biotic potential and slower population growth.
How do r-selected species typically respond to environmental changes?
R-selected species are better suited for rapidly changing environmental conditions due to their high adaptability and rapid population recovery.
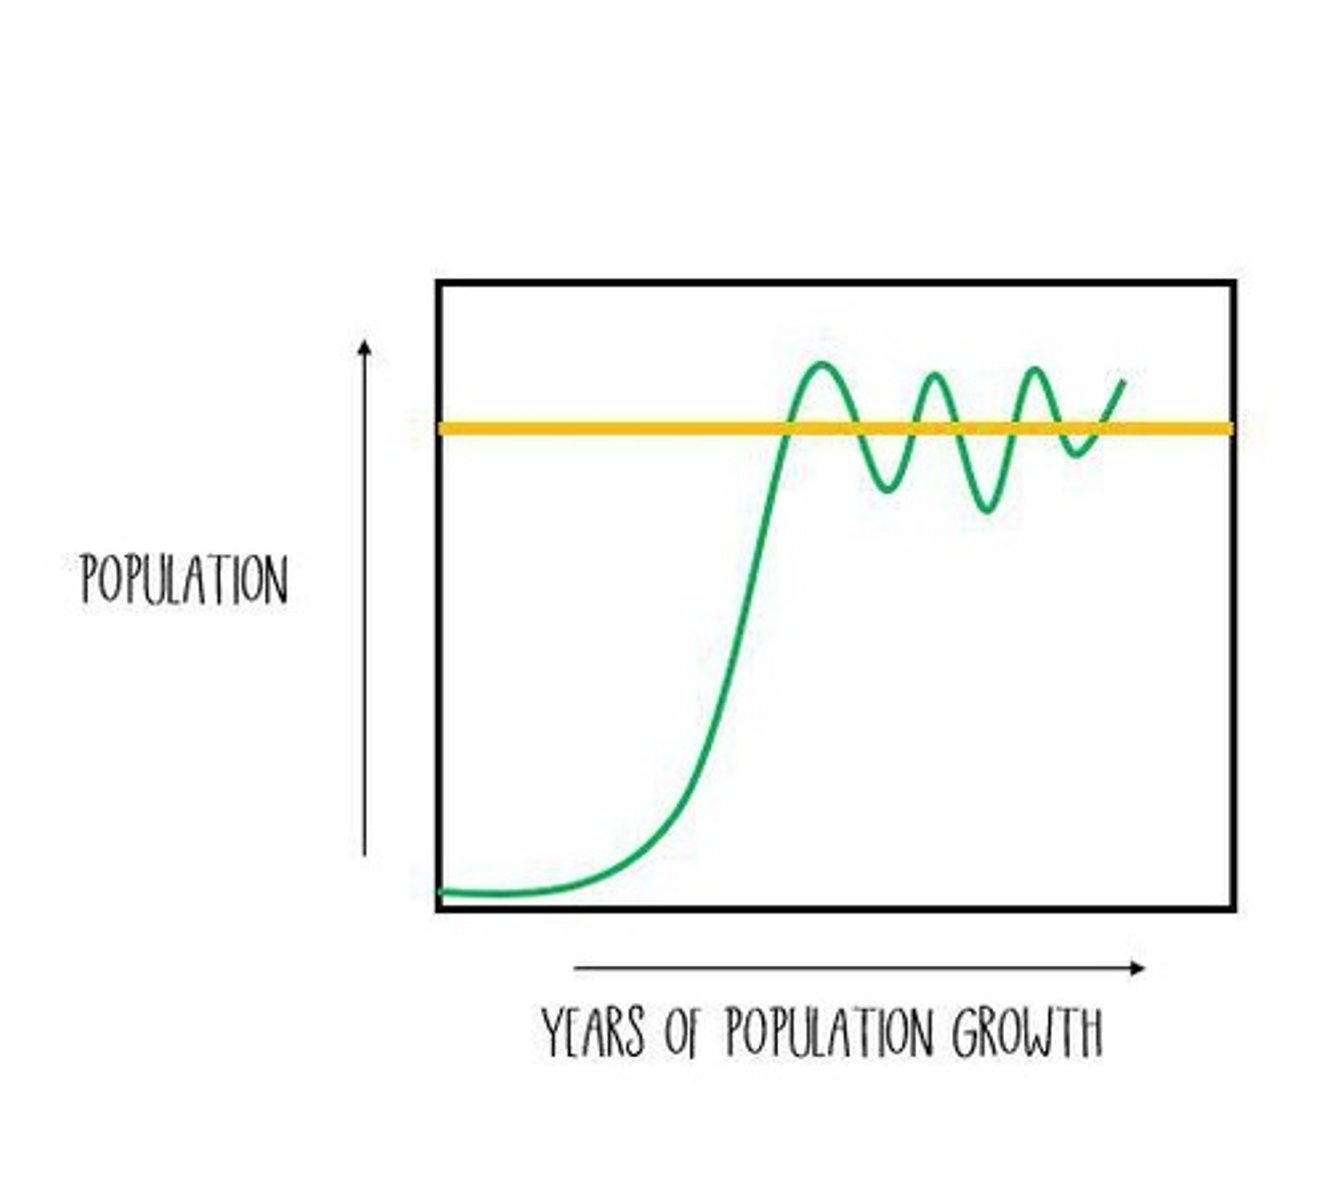
What is the carrying capacity (K) of an ecosystem?
Carrying capacity is the maximum number of individuals that an ecosystem can support based on limiting resources.
What happens during a population overshoot?
During a population overshoot, the population briefly exceeds the carrying capacity, leading to resource depletion and potential die-off.
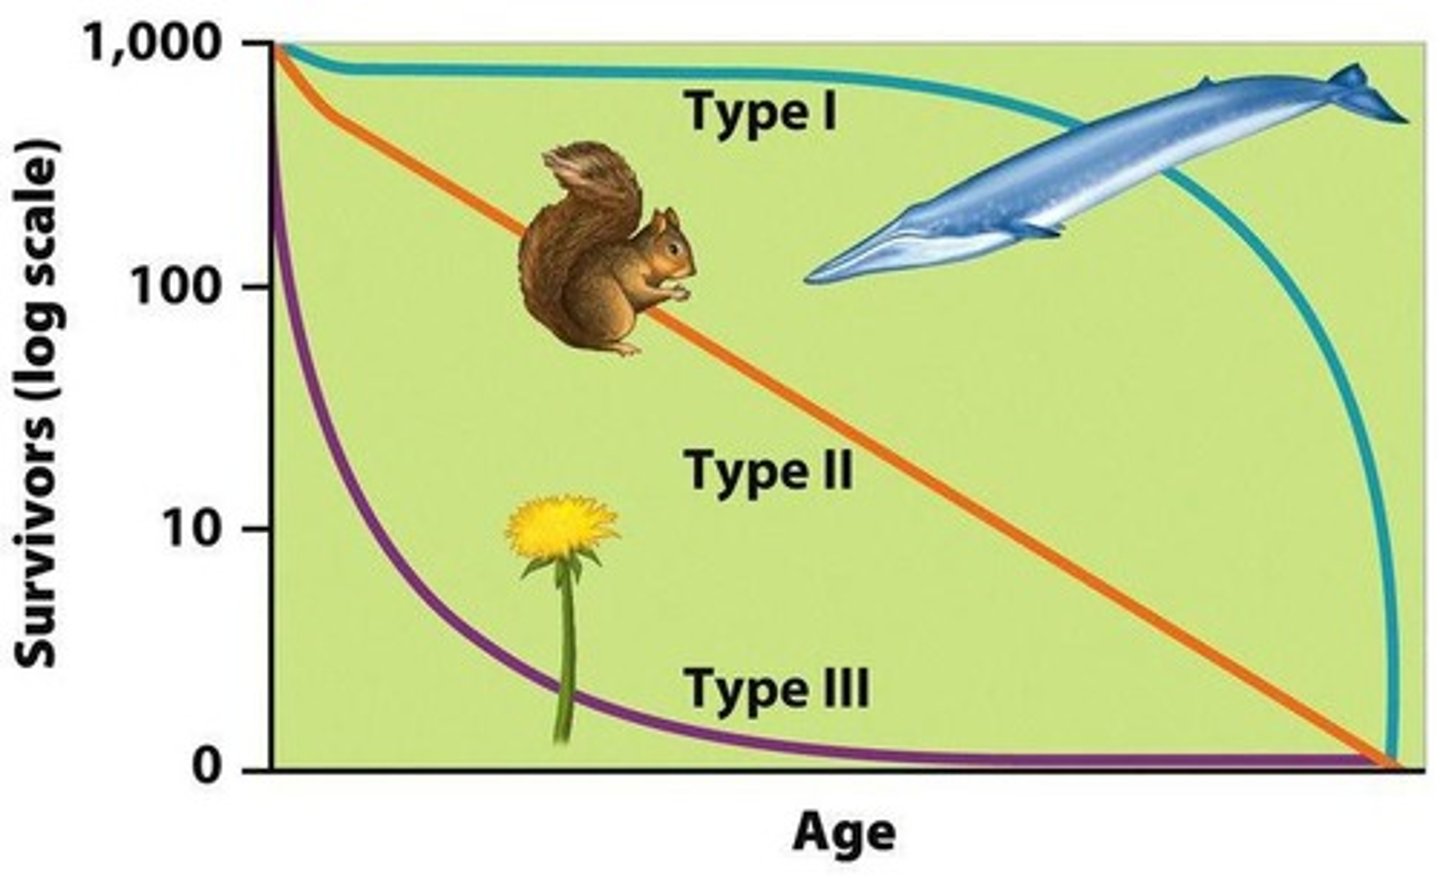
What is a survivorship curve?
A survivorship curve is a graph that shows the survival rate of a cohort (group of same-aged individuals) in a population from birth to death.
What characterizes a Type I survivorship curve?
Type I survivorship curves show high survivorship early in life due to high parental care, with a rapid decrease in survivorship in late life.
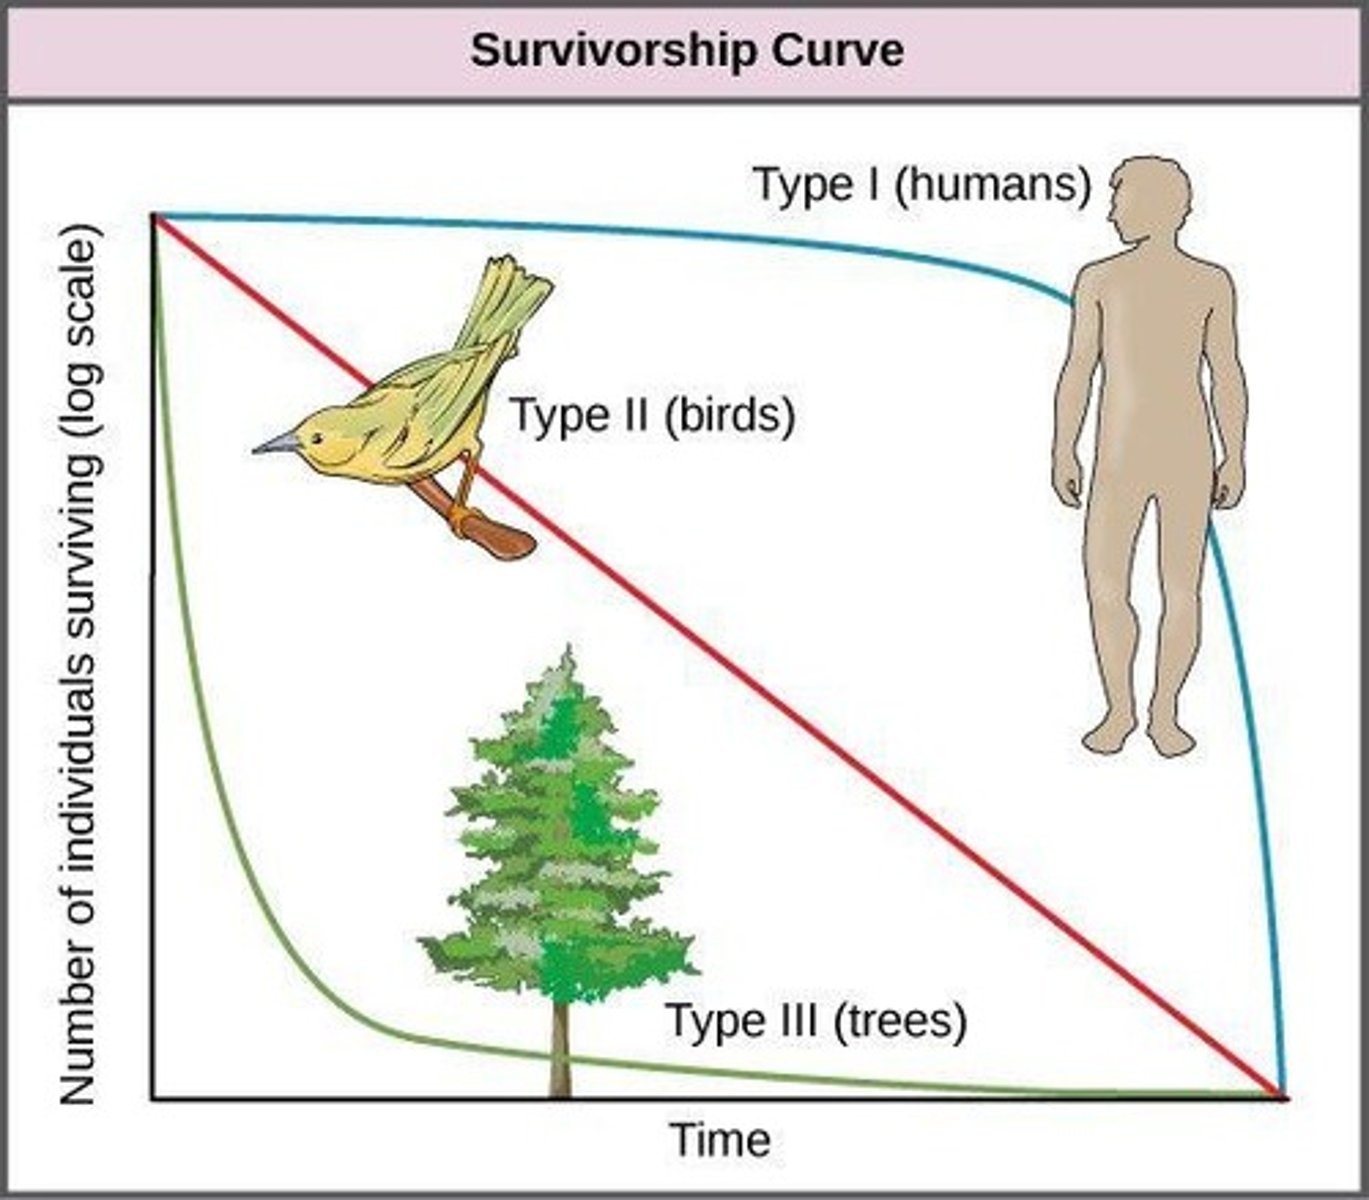
What characterizes a Type III survivorship curve?
Type III survivorship curves show high mortality early in life due to little to no parental care, with few individuals reaching adulthood.
What is the relationship between zebra mussels and unionid mussels in the Hudson River?
Zebra mussels often outcompete unionid mussels for resources, leading to a decline in the unionid mussel population.
What is the significance of the r variable in ecology?
The 'r' variable represents the maximum reproductive rate in ecology, used to classify r-selected species.
How does population density affect competition?
Higher population density increases competition for resources, the possibility of disease outbreaks, and the risk of depleting food sources.
What is the impact of parental care on r-selected and K-selected species?
R-selected species provide little to no parental care, while K-selected species provide high parental care, impacting offspring survival rates.
What is the typical lifespan and reproductive pattern of r-selected species?
R-selected species typically have shorter lifespans and reach sexual maturity quickly, allowing for high population growth rates.
What is a consequence of resource depletion in populations?
Resource depletion can lead to sharp decreases in population size, known as die-offs, especially after overshooting carrying capacity.
How do K-selected species typically respond to environmental disturbances?
K-selected species are less likely to recover quickly from disturbances due to their low biotic potential and high parental care.
What are the three types of population distribution?
The three types of population distribution are random, uniform, and clumped.
What is the effect of invasive species on native populations?
Invasive species, often r-selected, can outcompete native species for resources, leading to declines or extinctions of native populations.
What is the significance of high biotic potential in r-selected species?
High biotic potential allows r-selected species to recover rapidly after disturbances and increases their chances of becoming invasive.
What is the difference between population size and population density?
Population size refers to the total number of individuals in a given area, while population density is the number of individuals per unit area.
What is the impact of parental care on offspring survival in K-selected species?
High parental care in K-selected species increases offspring survival rates, but the death of a parent can significantly impact the offspring.
What does a survivorship curve with a steady decline indicate?
A survivorship curve with a steady decline indicates a Type II survivorship, where mortality is consistent throughout life.
What happens to populations that exceed their carrying capacity?
Populations that exceed their carrying capacity may experience a die-off due to resource depletion.
What are density-independent factors?
Factors that influence population growth regardless of its size, such as natural disasters.
What is the bottleneck effect?
A die-off that can lead to a skewed sex ratio, limiting population growth due to a lack of females.
What are density-dependent factors?
Factors that influence population growth based on size, such as food availability, competition, and disease.
How does food act as a density-dependent factor?
Food availability limits population growth; adding more food can increase carrying capacity.
What is biotic potential?
The maximum potential growth rate of a population in the absence of limiting resources, also known as the intrinsic rate of increase (r).
What is logistic growth?
Growth characterized by initial rapid increase followed by a slowdown as limiting factors restrict population to carrying capacity (K).
How is population change calculated?
Population Size = (Immigrations + births) - (Emigrations + deaths).
What is total fertility rate (TFR)?
The average number of children a woman will bear throughout her lifetime.
What is replacement level fertility?
The TFR required to offset deaths in a population and maintain stable population size, typically about 2.1 in developed countries.
What factors contribute to higher TFR in less developed countries?
Higher infant mortality rates and lack of access to healthcare, clean water, and food.
What is infant mortality rate (IMR)?
The number of deaths of children under one year per 1,000 people in a population.
How does government policy affect TFR?
Policies can be coercive (forceful) or noncoercive (encouraging) and significantly influence fertility rates.
What role does female education play in TFR?
Higher education levels in women lead to fewer unplanned pregnancies and more job opportunities, reducing TFR.
What is the significance of age structure diagrams?
They show the distribution of different age cohorts in a population, indicating growth trends.
What does a larger 0-14 age cohort indicate?
Current and future population growth potential.
What does a stable age structure diagram look like?
It resembles a house shape, indicating little to no growth.
What population problems have countries like China and Italy faced?
China implemented a one-child policy, while Italy offered payments for births to boost fertility rates.
What is the relationship between affluence and TFR?
More affluent nations tend to have lower TFR due to better access to education and family planning.
How can access to healthcare affect IMR?
Improved healthcare access leads to lower IMR, which is associated with lower TFR.
What is the impact of competition for resources on population growth?
Competition for limited resources like food and habitat can limit population growth, especially in larger populations.
What is the expected outcome of a population leveling off?
It typically indicates that the population has reached its carrying capacity and growth has stabilized.
What factors can lead to a decline in population growth?
Increased education and economic opportunities for women, access to family planning, and lower IMR.
What is the Malthusian theory regarding human population?
Malthus theorized that Earth has a human carrying capacity based on food production, and that human population growth is occurring faster than food production growth.
How can technological advancements affect Earth's carrying capacity?
Technological innovations, such as synthetic nitrogen fixation, can increase food supply and alter Earth's carrying capacity.
What is the formula for calculating growth rate (r)?
Growth Rate (r) = (Crude Birth Rate - Crude Death Rate) / 10.
What does the Rule of 70 calculate?
The Rule of 70 estimates the time it takes for a population to double by dividing 70 by the growth rate.
If a country's growth rate is 1.2%, how long will it take for its population to double?
It will take approximately 58.3 years (70/1.2).
What is the Crude Birth Rate (CBR)?
The Crude Birth Rate is the number of births per 1,000 people in a population.
What is the Crude Death Rate (CDR)?
The Crude Death Rate is the number of deaths per 1,000 people in a population.
What factors increase human population growth?
Factors include higher Total Fertility Rate (TFR), high infant mortality rates, and high immigration levels.
What factors decrease human population growth?
Factors include increased access to clean water and healthcare, higher education for women, and delayed marriage and childbearing.
What is the significance of life expectancy in relation to standard of living?
Life expectancy is a key health indicator that reflects the quality of life and standard of living in a country.
What does Gross Domestic Product (GDP) indicate?
GDP indicates the total value of goods and services produced in a country and is a key economic indicator of standard of living.
What characterizes Stage 1 of the Demographic Transition Model?
Stage 1 is pre-industrial with high infant mortality rates, high death rates, and high Total Fertility Rates due to lack of access to education and healthcare.
What occurs in Stage 2 of the Demographic Transition Model?
Stage 2 is characterized by declining death rates and infant mortality rates, while Total Fertility Rates remain high, leading to rapid population growth.
What defines Stage 3 of the Demographic Transition Model?
Stage 3 features lower Total Fertility Rates due to increased education and economic opportunities, resulting in a slowing growth rate.
What are the characteristics of Stage 4 in the Demographic Transition Model?
Stage 4 is post-industrial with very high per capita GDP, low Total Fertility Rates, and population decline as birth rates drop below death rates.
What is a potential human activity impacting biodiversity due to population growth?
Urbanization and habitat destruction due to expanding human settlements can significantly impact biodiversity.
What is one government solution to slow population growth?
Governments could implement family planning programs to provide access to contraceptives and education.
What is the relationship between high infant mortality rates and Total Fertility Rates?
High infant mortality rates can drive up Total Fertility Rates as families have more children to ensure some survive to adulthood.
What is the impact of increased education for women on population growth?
Increased education for women typically leads to lower Total Fertility Rates and delayed childbearing.
What is the significance of per capita GDP?
Per capita GDP is the total GDP divided by the total population, indicating the average economic output per person.
How does industrialization affect population growth?
Industrialization leads to improved healthcare and living conditions, reducing death rates and initially increasing population growth.
What happens to TFR as a country becomes more affluent?
As a country becomes more affluent, the Total Fertility Rate typically declines as families prioritize education and career.
What is the relationship between standard of living and population growth?
Higher standards of living, indicated by high GDP and life expectancy, are associated with lower population growth rates.