AP STATS UNIT 1-4
1/80
There's no tags or description
Looks like no tags are added yet.
Name | Mastery | Learn | Test | Matching | Spaced | Call with Kai |
|---|
No analytics yet
Send a link to your students to track their progress
81 Terms
Categorical Variable
Variable that takes a name.
Quantitative Variable
Numerical values (makes sense to average)
Discrete Variable
Countable, finite. (0,1,2)
Continuous Variable
Not always exactly countable. (Weight)
What is S O C S
Shape, Center, Outliers, Spread
Skewed, Unimodal, Bimodal are examples of:
Shape
Values far from the mean
Outliers
Mean, Median are descriptions of:
Center
Range, IQR are descriptions of
Spread
“C” in CSOCS is for:
Context
Mean is:
Sum divided by number of values
Median is:
Middle value
Which is affected by outliers: Mean or Median?
Mean
Empirical Rule (FOR NORMAL DISTRIBUTIONS)
68% within 1SD, 95% Within 2SD, 99.7% within 3SD
IQR is:
Q3-Q1
Q1 is
25th percentile
Median (in terms of percentile) is
50th percentile
Q3 is
75th percentile
Five number summary:
min, q1, median, q3, max
Lower Outlier Rules (fence + SD)
q1-1.5 x IQR & mean - 2SD
Upper Outlier Rules (fence + SD)
q3 + 1.5 x IQR & mean + 2SD
Formula for Z Score:
(value - mean) / (standard deviation)
(Calculator Function) To find mean, standard deviation, and 5 number summary for a data set.
1 Var Stats
(Calculator Function) Finds the proportion of observations above, below, or between values assuming a normal model.
normalcdf (lower, upper, mean, SD)
(Calculator Function) Finds a value given a percentile.
invNorm(area, mean, standard deviation)
What is CDOFS
Context, Direction, Outliers, Form, Strength
r value is
correlation coefficient. is between -1 and 1
what doese’t affect r value?
changing units, switching axes
Correlation does not equal…..
causation
Equation of LSRL
y hat = a +bx
Equation for residual:
y (actual) - y (predicted) = residual
Positive/Negative residuals mean:
Positive = Underestimation, Negative = Overestimation
Interpretation of Slope
For every 1 unit change in independent variable, our model predicts and average change of the slope in response variable
explanatory variable
independent variable
response variable
dependent variable
interpretation of y intercept
when independent variable is zero, LSRL predicts dependent variable would be y intercept.
r2 value is:
the precent of the variability in the dependent variable that can be explained by the linear relationship with the independent variable.

What value is the slope:
0.16292
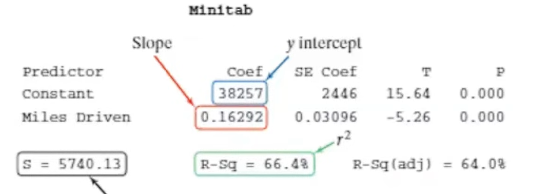
What values is the y intercept
(Constant) 38257
What does it mean if the residual plot has a pattern?
LSRL is BAD
What does it mean if the residual plot dosen’t have a pattern?
LSRL is GOOD
How do I find correlation coefficient from r2 ?
sqrt (r2)
(Calculator Function) Gives summary stats for both variables.
2-Var Stats (L1, L2)
(Calculator Function) Creates the least-squares regression line.
LinReg(ax+b) (L1, L2)
Simple random sample:
Random selected Subset of population.
Stratifed random sample
splits population into groups based on shared traits, choose some from each group
Cluster Sample
Splits population into groups, everyone from group gets chosen
Systematic Random Sample:
Picking individuals at regular/set intervals
Convenience Sampling
(bad sampling) choosing who is easy to each.
Voluntary Response Sampling
(BAD) allowing people to choose to participate.
Under coverage
When some people are left out.
Nonresponse
When individuals cant/dont respond
Response bias.
lying, but for a reason
Observational Study
Collecting data without influence of subjects
Experiment
Collecting data with influence of subjects
What is CRCR for experimental design
Comparison, Random Assignment, Control, Replication
Confounding Variable
When another variable affects the results.
Placebo
Fake Treatment
Single Blind
Subjects don’t know treatment, researchers do.
Double Blind
nobody knows who has what treatment.
Block
Group of experimental units with same characteristic
Block Design
subjects are divided based on specific characteristics
Matched Pair Design
Subjects are PAIRED.
Mutually Exclusive
two events that cannot occur at the same time
Independent Events
One dosen’t effect the other.
How to find the probability of either one of 2 mutually exclusive events happening?
Add them
How to find the probability of either one of 2 NON-mutually exclusive events happening?
Add them, subtract the overlap.
How to find the probability of 2 independent events BOTH happening?
multiply them.
How to find the probability of 2 NON-independent events BOTH happening?
Multiply the probability of the first event with the probability of 2nd event, given that the first has already happened.
How do i find the chance that an event simply dosen’t happen.
1 - Probability that the event happens.
Complement Rule
P(Ac) = 1-P(A)
Expected Value Formula
x times probability of x (1 × 1.0)
What changes when we add or subtract the same constant to each value in a probability distribution? (Shape, Center, Variability?)
Center (changes by the constant)
What dosen’t change when we multiply or divide the same constant to each value in a probability distribution? (Shape, Center, Variability?)
Shape.
What is BINS (for binomial distributions)
Binary, Independent, Number, Success.
(Calculator Function) Calculates probabilities using a known normal distribution.
normalcdf(lower, upper, mean, standard deviation)
(Calculator Function) Finds a value corresponding to a probability
invNorm(probability, mean, standard deviation)
(Calculator Function) Probability of exactly x successes.
binompdf(number of trials, probability of success, number of successes)
(Calculator Function) Probability of at most x successes.
binomcdf(number of trials, probability)
(Calculator Function) Probability first success occurs on trial x.
geometpdf(probability, x)
(Calculator Function) Probability first success occurs by trial x.
geometcdf(p, x)