Midterm 1 Practice
1/118
Earn XP
Description and Tags
Intro to Analytical Chem, Statistics, Quality Assurance and Calibration Method
Name | Mastery | Learn | Test | Matching | Spaced | Call with Kai |
|---|
No analytics yet
Send a link to your students to track their progress
119 Terms
when do you calibrate?
when the relationship between analyte concentration and signal/response is unknown
negative bias
mean is below true value (underestimation)
positive value
mean is above true value (overestimation)
low precision results in
difficulty in identifying small differences between data (t-test)
rounding
@5 round to nearest even digit
± answer has same # of digits
x or / answer has same # of sigfigs
systematic error (determinate)
flaw in method/design, reproducible, can be detected and corrected, skews data in 1 direction, affects accuracy
random error (indeterminate)
uncertainty in measurements that cannot be eliminated, can be reduced by better precision, affects reproducibility, aka variance of data
gross erros/blunders
human errors
uncertainty calculations
x / use relative uncertainty
+ - use absolute uncertainty
calibration curve uncertainty use formula
matrix
everything else in sample other than analyte
bias
deviation from truth in data collection, analysis, interpretation, publication, can cause false conclusions
types of bias
fraud
selective reporting
publication bias
confirmation bias
source of bias
design
sampling
presentation
data quality
scientific misconduct (2 types)
fraud (intentional)
unintentional, erroneous
Intentional scientific misconduct
falsification, fabrication, plagiarism (FFPs)
Unintentional scientific misconduct
misuse of stats
image manipulation
lack of access to primary data
witholding scientific info
What are some strategies that you can implement in the laboratory to avoid bias?
have a null hypothesis to alleviate some confirmation bias
quality assurance
use blinding and masking techniques also reduces confirmation bias
reproducibility crisis due to
pressure to publish
selective reporting
insufficient replication
inadequate validation
low statistical power
most published research is false because
study power is low
study power is dependent on
sample size
effect size (response size)
tested relations
hierarchy in quality of evidence
lowest expert opinions
animal studies
randomized control trials
meta analysis (results of many studies) highest
reproducibility crisis
where scientists are unable to produce results from published research papers when they attempt to reproduce their studies, many cannot even reproduce their own results → suggests that most published data is false
what are some strategies we can use to improve reproducibility & scientific integrity?
declaration of conflicts of interests
data transparency
adequate replication with enough study power
eliminating sources of bias in study design
method validation
appropriate statistical analysis
biggest source of error in lab 1
vision which is relative person to person to spot endpoint
Precision
is a measure of indeterminate error, amount of variance in replicate measurements
how to quantify precision
standard deviation
relative standard deviation/coefficient of variance
confidence intervals
to increase precision
can have more replicants
standard deviation (s) of sample
measures how closely data is clustered about the mean
+- 1s covers 68% of data
report +- 2s
larger s, poor precision
breadth of gaussian distribution of data
sigma
standard deviation of population
mu
mean of population
x bar
mean of sample, central tendency of gaussian distribution
relative standard deviation (RSD)/coefficient of variance (CV)
s/xbar
standard deviation as a % of the mean
RSD < 15% acceptable
RSD > 20% is poor precision
degrees of freedom
sample size - 1 (for 1 data set)
field blank
environmental analysis, sample that goes through experiment @ site of sampling (see if contaminants added in shipment)
confidence intervals
range of values in which we are (confidence level %) confident that the true mean lies in
± ts/sqrt(n)
CL is usually 95%
more replicates (larger n), smaller CI
use instead of standard deviations cuz 3 replicates not enough for gaussian distribution
n
number of replicates
student’s t test value
statistical tool used for confidence intervals and comparing results from different experiments
incr dof, decreases t-crit
incr CL, increase t-crit
reference ranges (for disease vs. healthy states)
test healthy pop
find 95% CI → reference range
if data is outside CI means unhealthy
used for diagnostic testing
accuracy
closeness of measured result to true value
% accuracy
check for bias in different ways (standard reference materials, blanks, compare with another validated method aka Bland Altman plot, round-robin experiments, spike and recovery test)
% accuracy
reveals closeness of measured result to true value
your average/true value
acceptable 85%-115%
blank sample analysis
run method on sample containing no analyte → should get zero response
round-robin experiment
same experiment is done by different labs/ppl, if the difference in data cannot be explained by random error —> sign of systematic error
sources of systematic error
sample preparation
human
equipment problem
reporting error
calculation error
there are many pre&post analytical factors that can lead to bias in an analytical method
cognitive biases
human nature (interpret)
environment, culture, experience
case specific
s, RSD, CI all assume
normal distribution of data
how to check for outliers
rank data
grubbs test
outher basic statistical tests (visualize)
Grubbs Test
null hypothesis (there are no outliers in data, all data is random)
calculate mean
calculate stdev
apply formula to all data points: (|sus value-mean|)/s
if g-calc>g-crit then can reject null hypothesis and claim that data point cannot be explained by random error, and can thus be removed
p value
1-CL
probability for error
types of t-tests
single-tailed t-test
2-tailed t-test
(both can either be with equal variance or unequal variance)
paired t-test
F-test
always done before t-test
null: the variance between the 2 data sets are equal
f-calc = s1²/s2²
if f-calc>f-table, reject null and claim that variance between the data sets are unequal
alternative to f-test (j/ look at variance and see if its similar in magnitude)
2-tailed t-test
use to compare means between 2 data sets
null: 2 means are not significantly different
calculate means
calculate stdev
calculate t-calc
if t-calc>t-table then can reject null, claim that the means are significantly different
testing to see if mean is within 5% error total on EITHER side of graph
x - stat
x - calc
x - crit
x- table
full change (FC)
ratio of different mean concentrations
round error to 2-3 sigfigs
round mean accordingly
paired t-test
compare means from tests applied to identical samples (ex. same test subject)
if means are not significantly different, can conclude that methods give the same answer
ex. BICARB muscle fatigue study
variance (s²)
another measure of data’s dispersion around mean
endpoint of titration
the point at which a color change has been reached indicating a slight excess of titrant has been added to an unknown amount of titrand
visually detect equivalence point has been passed
equivalence point of titration
point at which moles of analyte is equal to moles of titrant
standard operating procedure (SOP)
states steps taken in an validated analytical protocol:
standardization titration
titration of a known amount of analyte to determine the
concentration of the titrant
direct translation
titrant is added to analyte until reaction is complete
titration error
the difference between the end point and the equivalence point
single-tailed t-test
compare mean to a known value (ex. MAC)
null: the mean and the known value are not significantly different
FIRST check if the known value is within the upper and lower CI of the mean, if it isn’t reject null and claim they are significantly different, if it does cannot reject null
calculate t-stat (different formula and t-crit values than 2 tailed t-test)
if t-stat>t-crit, reject null and claim that mean and known value are significantly different
testing to see if mean is within 5% error on ONE SIDE OF GRAPH
to compare means from 3+ data sets
ANOVA
iterative t-tests (if trying to find max, take largest value and do t-tests with that value and all other values)
pregnancy test
measures hormone released in early stages of fetus development
type 1 error
false positive
rejecting true null hypothesis
ex. pregnancy test positive when not pregnant
causes: interferences in sample, human erro
type 2 error
false negative
accepting a false null hypothesis
ex. pregnancy test is negative when acc are pregnant
causes: early measurement, below detect limit
linear regression
measure the change in 1 variable (compared to another related variable)
ex. R²
person’s correlation
measures the change in 2 related variables
r
parametric test
statistical test that assumes normal distribution of data
non-parametric test
test that doesn’t rely on assumptions about the distribution of data
symmetric data sets
random distribution, equal variance between the two groups
biomodal data set
suggests batch effect (samples tested in different batches cause different results, suggesting non-random variation)
bar graph can mask
unequal variance between groups
unequal replicates in each group
outliers
non-gaussian distribution of data
can tell if stdev is larger than mean
report median and IQR (not mean and CI)
do non-parametric tests
designing an analytical method
choose scope of analyte (single molecule vs. molecular class)
know physiochemical properties of analyte to choose a selective method (unique properties can be used to separate & detect analyte)
identify sample matrix & matric effects in order to determine how to sample prep
know what the expected analyte conc is (check with method’s detect limit)
what precision and accuracy is expected
real world sample
complex
heterogenous
do not act like analyte in pure solution
requires measurement of minor analyte in prescence of major chemical compounds
matrix effects
components of matrix that represent major source of interference
ex. interferences could co-elute, spike/suppress signal, spectral overlap
analyte
target species to be measured/identified
Thalidomide tradegy due to
drug compound having an enantiomer that is toxic which is found in equal concentration as drug compound, Frances Oldham a hero for stopping people from buying it
sample pretreatments
sample workup done to make sample analyzable (into homogenous solution at appropriate analyte concentration with minimum intereferences)
ex. homogenization (blending), acid digestion, centrifugation, dilution
con: can introduce error the more complicated sample preparation is (try to minimize)
method validation
process of proving that an analytical method is acceptable for its intended purpose (measuring that analyte in that sample)
assessed according to 8 figures of merit & with calibration methods
8 figures of merit
method specificity, linearity, accuracy, presicion, range, limit of detection (LOD), limit of quantification (LOQ), robustness
specificity/selectivity
ability of an analytical method to distinguish (measure just) analyte from everything else that might be in sample
consider all known interferences and determine impact on analyte signal
perform stress test
analyze representative samples (that rep entire pop)
blank sample should get zero response
ASK: can your method accurately demonstrate that it is measuring just analyte response?
to improve: do sample prep to remove interferences, change method to a more selective one
examples of selectivity/specificity in class
ex. mass spectrometry is also very specific because it reports specific fragment mass values
ex of poor specificity: to test heparin medicine, tested the medicine’s clotting ability, didn’t acc test for analyte —> don’t know what is causing clots (in some batches it was a toxic compound)
stress test
purposefully degrade analyte to see what the byproducts of degradation responses look like
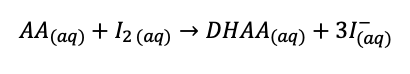
ascorbic acid is oxidized (looses electrons, loss of H, gain of O)
iodine is the oxidizing agent (is reduced to iodide)
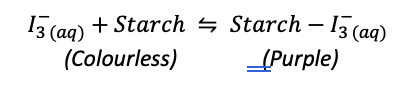
iodine is colourless, when no more AA to react with, it reacts with starch
starch-iodide complex is purple
why is column chromatography more specific than titration?
titration only get 1 response for entire sample (ex. a/b titration measures bulk a/b capacity of sample)
column chromatography can identify what compound gave what response (peak)
repeatability
precision of results when measuring same sample with same method, operator, on same day, in same conditions
less variance, less trustworthy
intermediate precision/within lab reproducability
precision when measuring analyte from single lab over longer time with different analysts
(between lab) reproducibility
standardized measurements performed at different laboratories
important for method to be transferred across multiple labs globally
depends on context
more variance, more trustworthy
interference
species that causes a bias in analysis by enhancing/decreasing instrument response to the analyte
total response
analyte sensitvity*concentration of analyte + (interference sensitivty*concentration of interference) should be low so can remove from equation
sensitivity
slope of calibration curve; method’s change in signal in response to change in analyte concentration
selectivity co-eficient
analyte sensitivity compared to interference sensitivity
if >100 then method is selective
ma/mI
spike & recovery analysis
add known amounts of analyte to a spiked sample
difference in response between sample and spiked sample should equal the known amount of analyte added
if not that indicates matrix interference, poor accuracy
Bland Altman Plot
used to compare results with results from another validated method
the data points plotted should be within 1-2 standard deviations of the mean from the validated method
should see random variation
±12% is acceptable
calibration methods
external standard
internal standard
standard addition
only applicable to specific sample