GRE Review Part IV: Data Analysis
1/66
There's no tags or description
Looks like no tags are added yet.
Name | Mastery | Learn | Test | Matching | Spaced | Call with Kai |
|---|
No analytics yet
Send a link to your students to track their progress
67 Terms
__ of a variable/data indicates how frequently different categorical or numerical data values are observed in the data.
Distribution
Define frequency.
the number of times that the category or numerical value appears in the data set
Define frequency distribution.
a table or graph taht presents the categories or numberical calues along with their corrospondng frequencies
The __ ___ of a category or numerical value is the corresponding frequency divided by the total number of data.
relative frequency
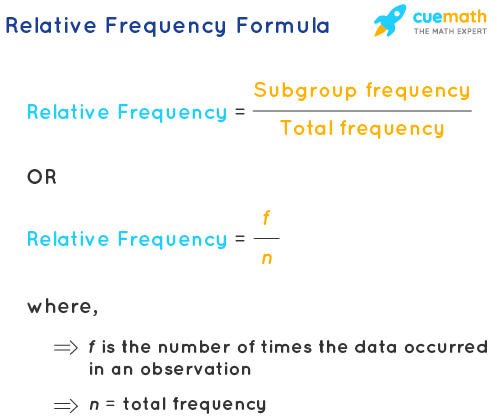
Define relative frequency distribution.
a table or graph that presents the relative frequencies of the categories or numerical values
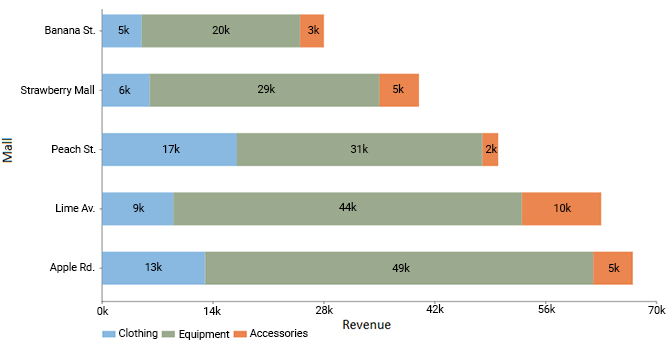
What kind of graph is this?
segmented bar graph
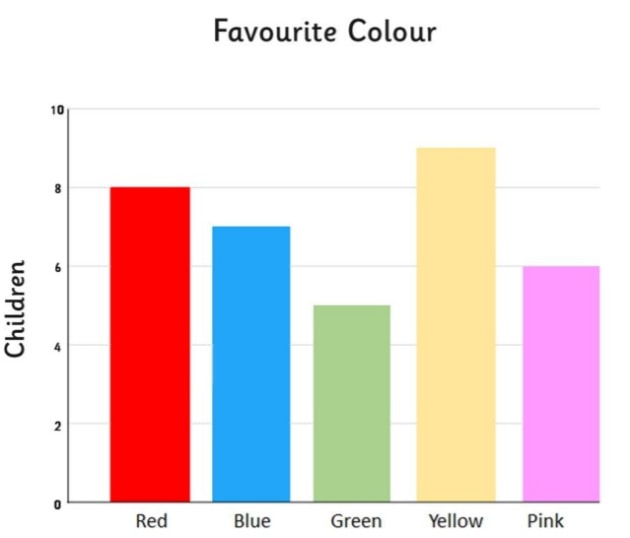
What kind of graph is this?
bar graph
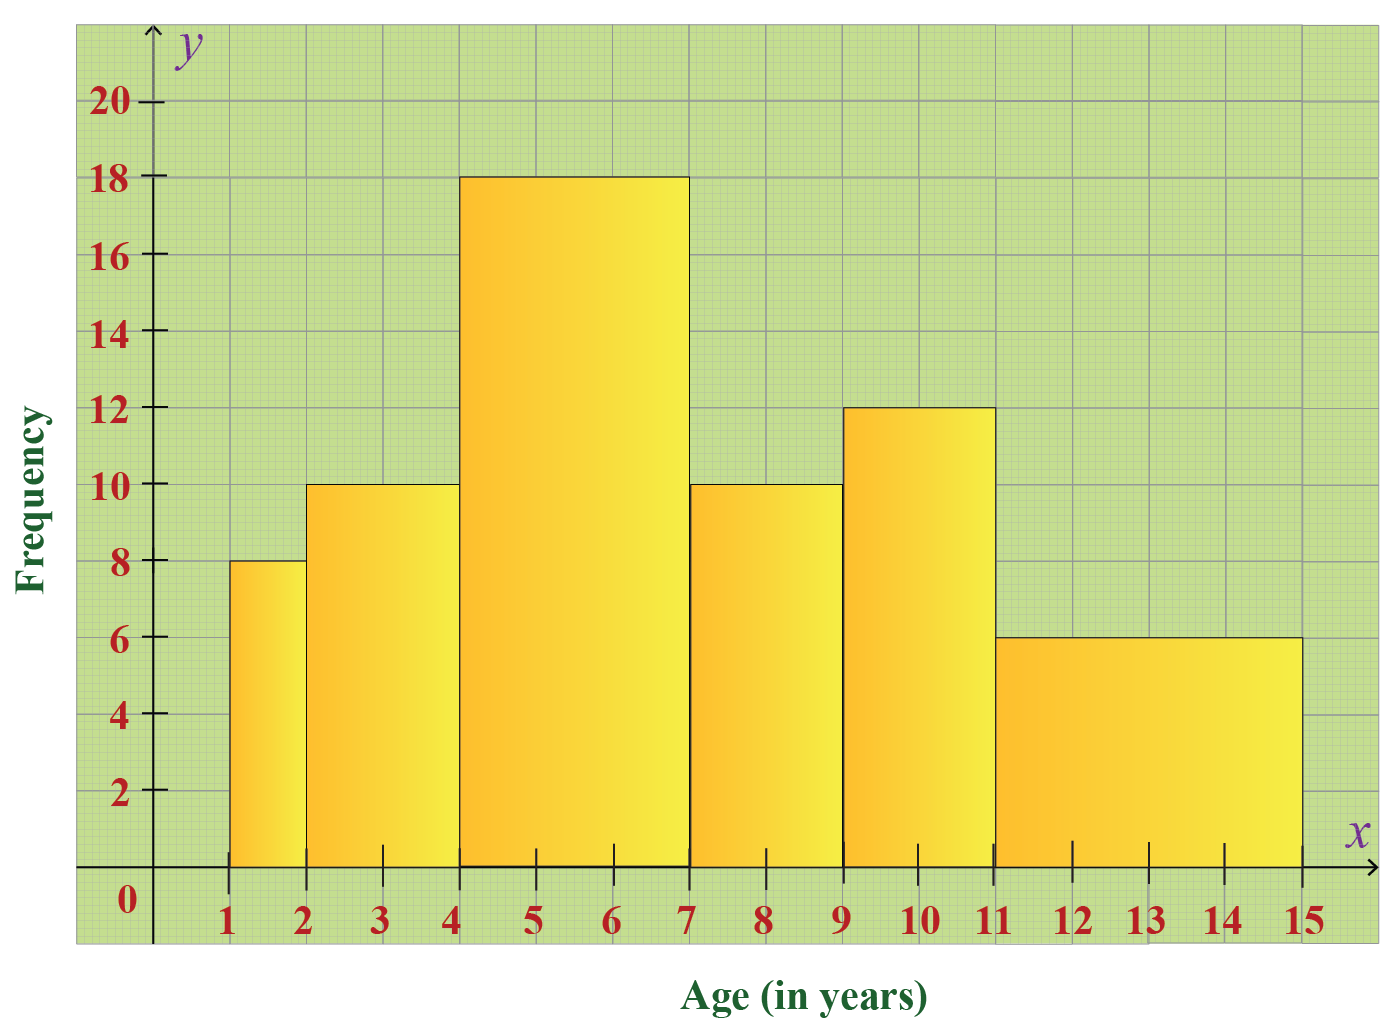
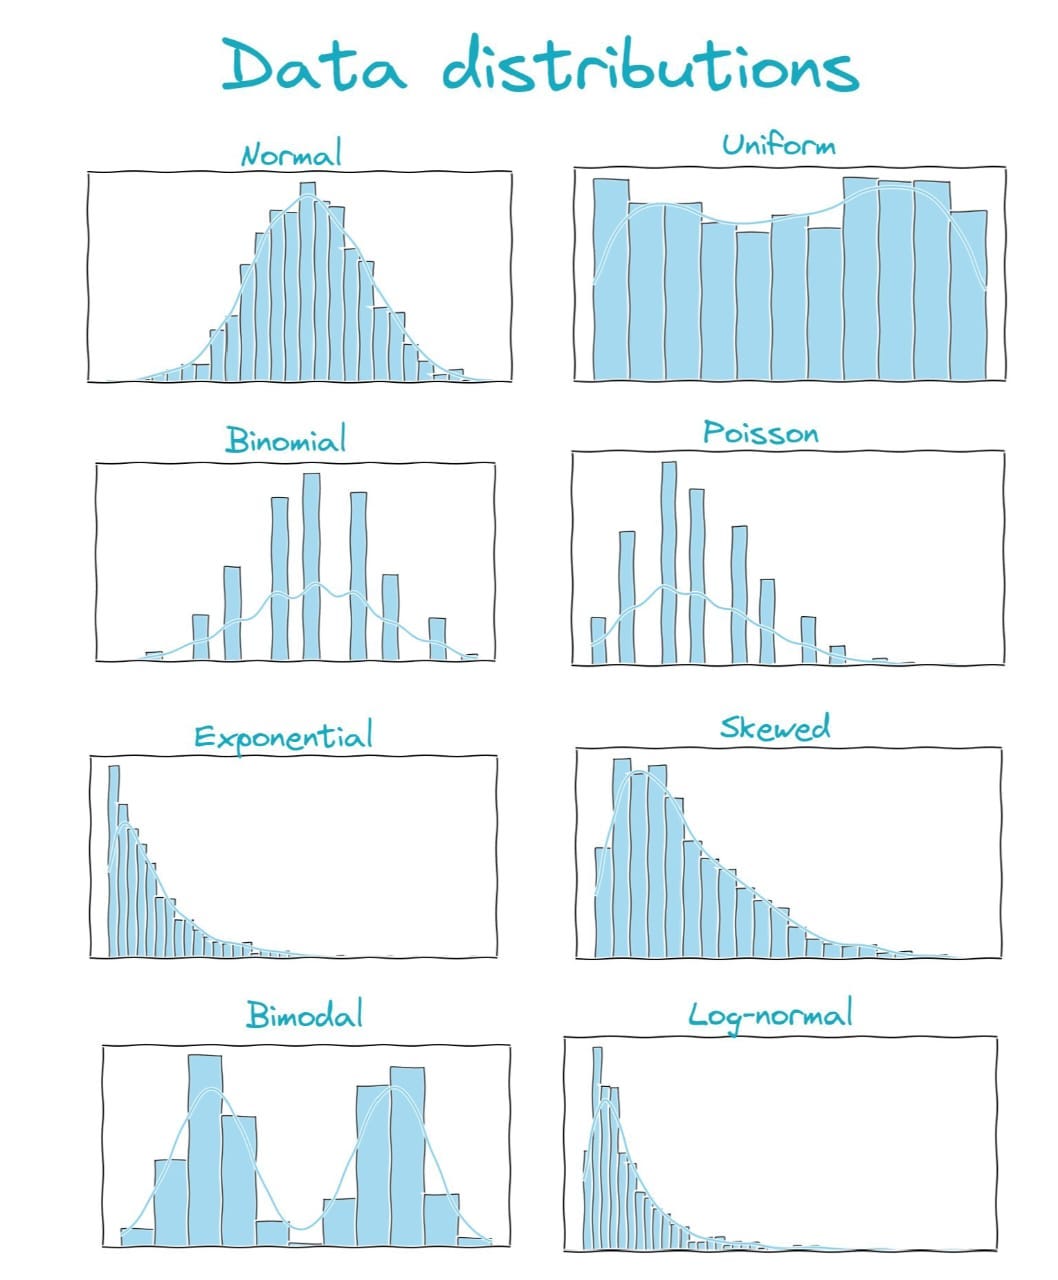
What kind of graph is this?
histogram
Define histogram.
graphs of frequency that have a number line for the horizontal axis which represents numerical values; there are no regular spaces between bars as that would indicate that there is no data in the empty intervals
Why are histograms useful as opposed to other bar graphs?
helpful in identifying the general shape of a distribution of data
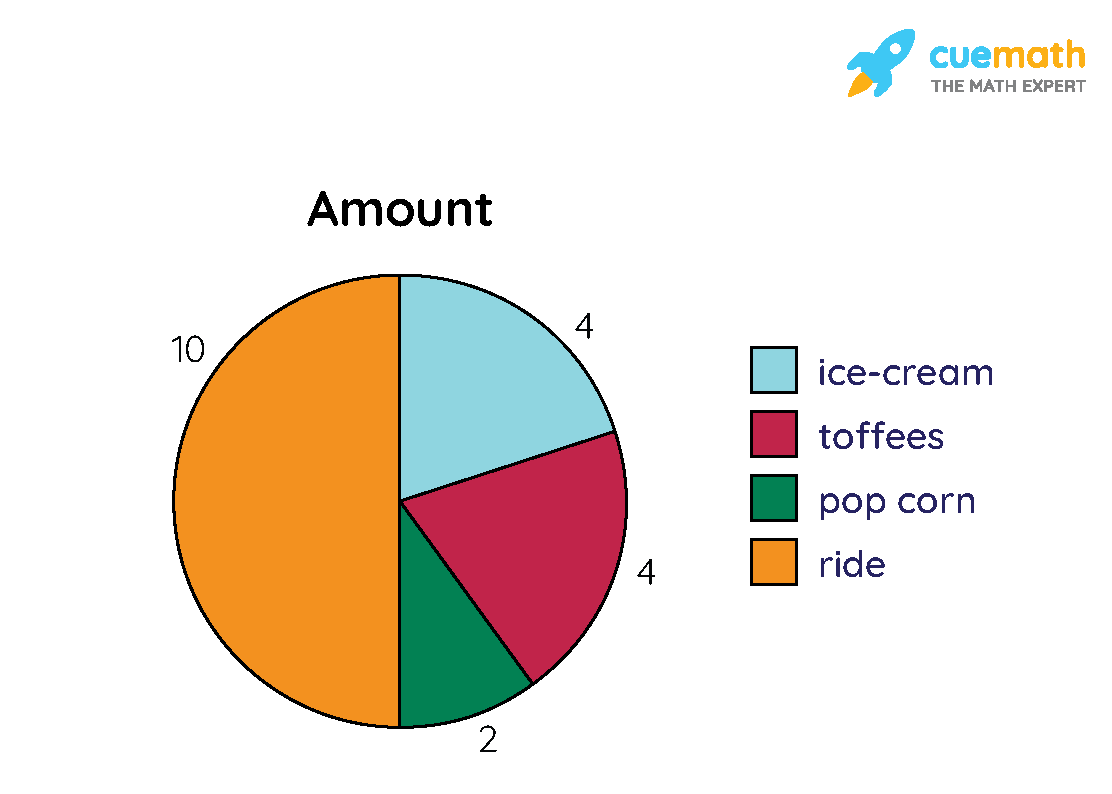
What kind of graph is this?
pie chart or circle graph
Each portion of a pie chart is called a __.
sector
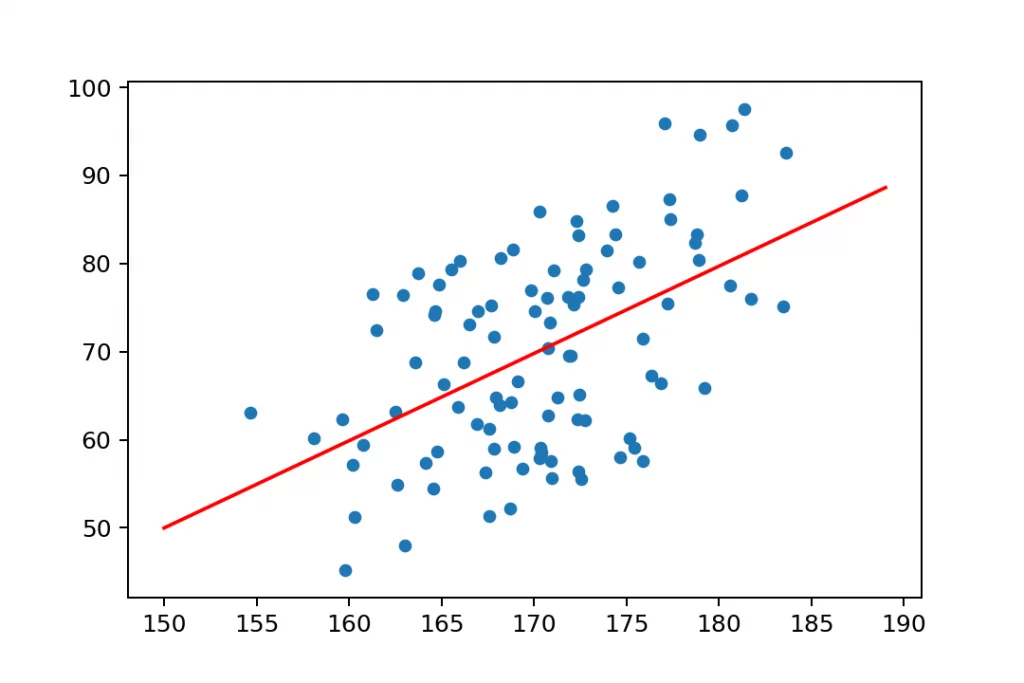
What kind of graph is this?
scatter plot
A __ __ is a type of graph that is useful for showing the relationship between two numerical variables whose values can be observed in a single population.
scatter plot
Define trend.
an overall pattern in a relationship between two variables
Tue or False: Trends are shown in scatter plots with a trend line. This is used to show everyone what the data should be doing.
False; trend lines interpret the relationship between the two variables and can demonstrate how well data fits the existing trend by proximity to the line. Trend lines can also be used to make predictions.
How do you predict something based off a trend line?
Find the slope of the trend line.
How would you interpret a trend line of -.05?
The y-variable is predicted to decrease -.05 units for every x-variable.
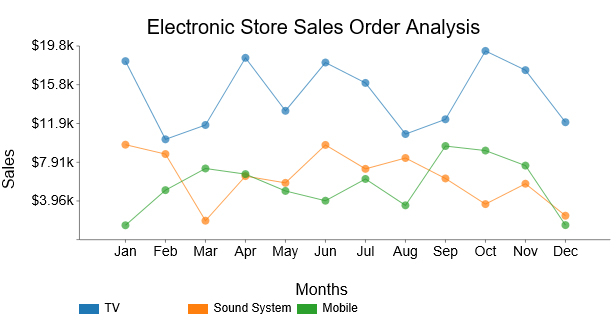
What kind of graph is this?
line graph
Central tendencies indicate the “center” of the data along the number line and are usually reported as values that represent the data. The three common measures are:
mean (average, arithmetic mean), median, mode
How do you calculate mean?
add all the data values and divide by the number of data valuesH
How do you calculate mode?
find the data that appears the most in a data set
How do you calculate median?
order the numbers from least to greatest; if there are an odd number of values, take the center value, and if there are an even number of data values, take the average of the two center values and
What is the weight of a value?
how often it appears in a list, or the frequency
The mean is affected by extremely high/low values that can be referred to as __.
outliers
The three most basic positions in a lineup of data are:
L (least), M (median), and G (greatest)
Another common measure for a lineup of data are __ and __.
quartiles and percentiles
Rather than split a lineup of data in one place, the median, quartiles split the data in __ places to create __ sections of data.
Quartiles split the data in three places (first Q1, second Q2, and third quartiles Q3) to create four sections of data. Note that Q2 is equal to M (median).
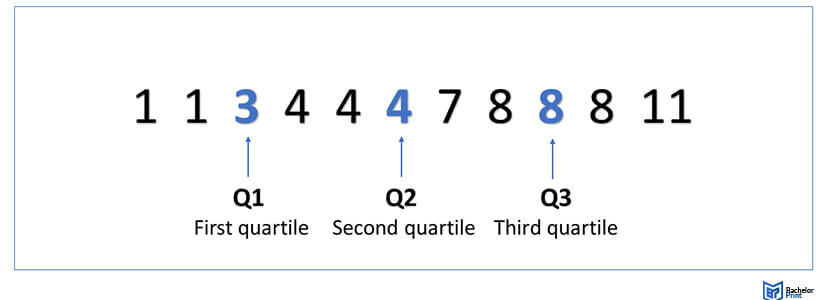
How to quartiles and percentiles differ?
Quartiles create four sections of data where percentiles (P1, P2, … , P99) create one hundred sections of data.
What is the measure of dispersion?
the degree of spread in a range of data, most commonly measured using the interquartile range and standard deviation
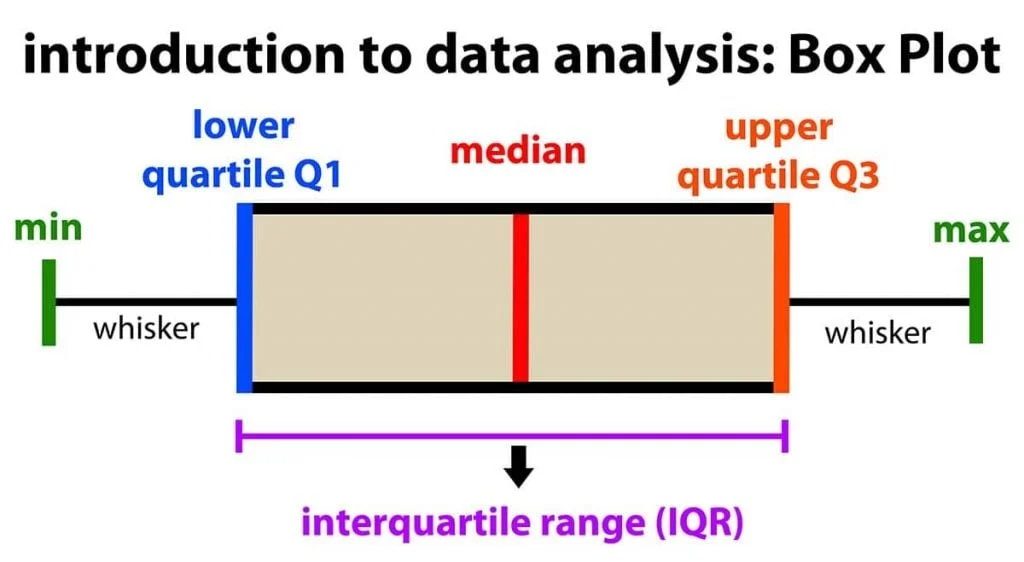
Define interquartile range.
interquartile range (IQR) is the difference between the 75th percentile (Q3) and the 25th percentile (Q1) of a dataset, representing the spread of the middle 50% of values.
What is the range of a lineup of data?
difference between the greatest number (G) and the lowest (L); G - L
Why is range useful?
reflects the maximum spread of the data
What is the advantage of interquartile range (IQR) rather than regular range?
IQR is unaffected by outliers
Define outlier.
an outlier is a data point that differs significantly from other observations, which may be due to variability, error, novelty or heavy-tailed distribution
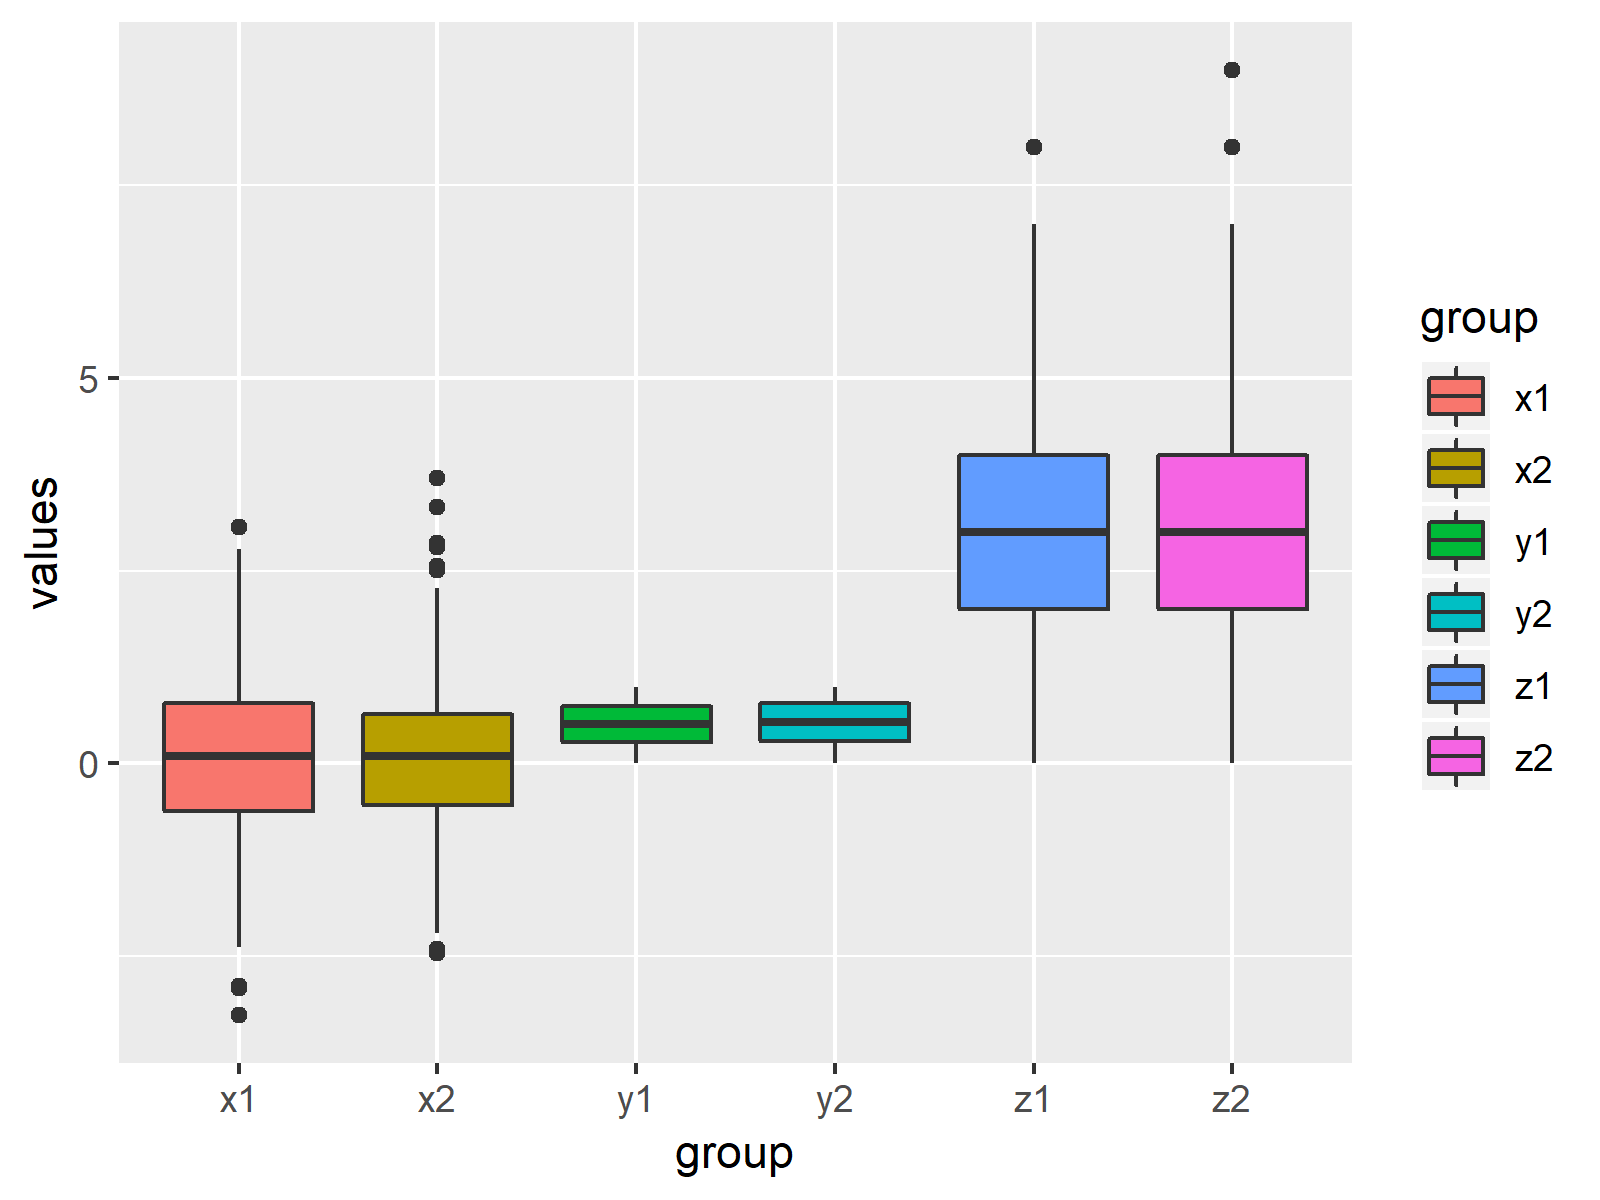
What is this graph?
boxplot or a box-and-whisker graph
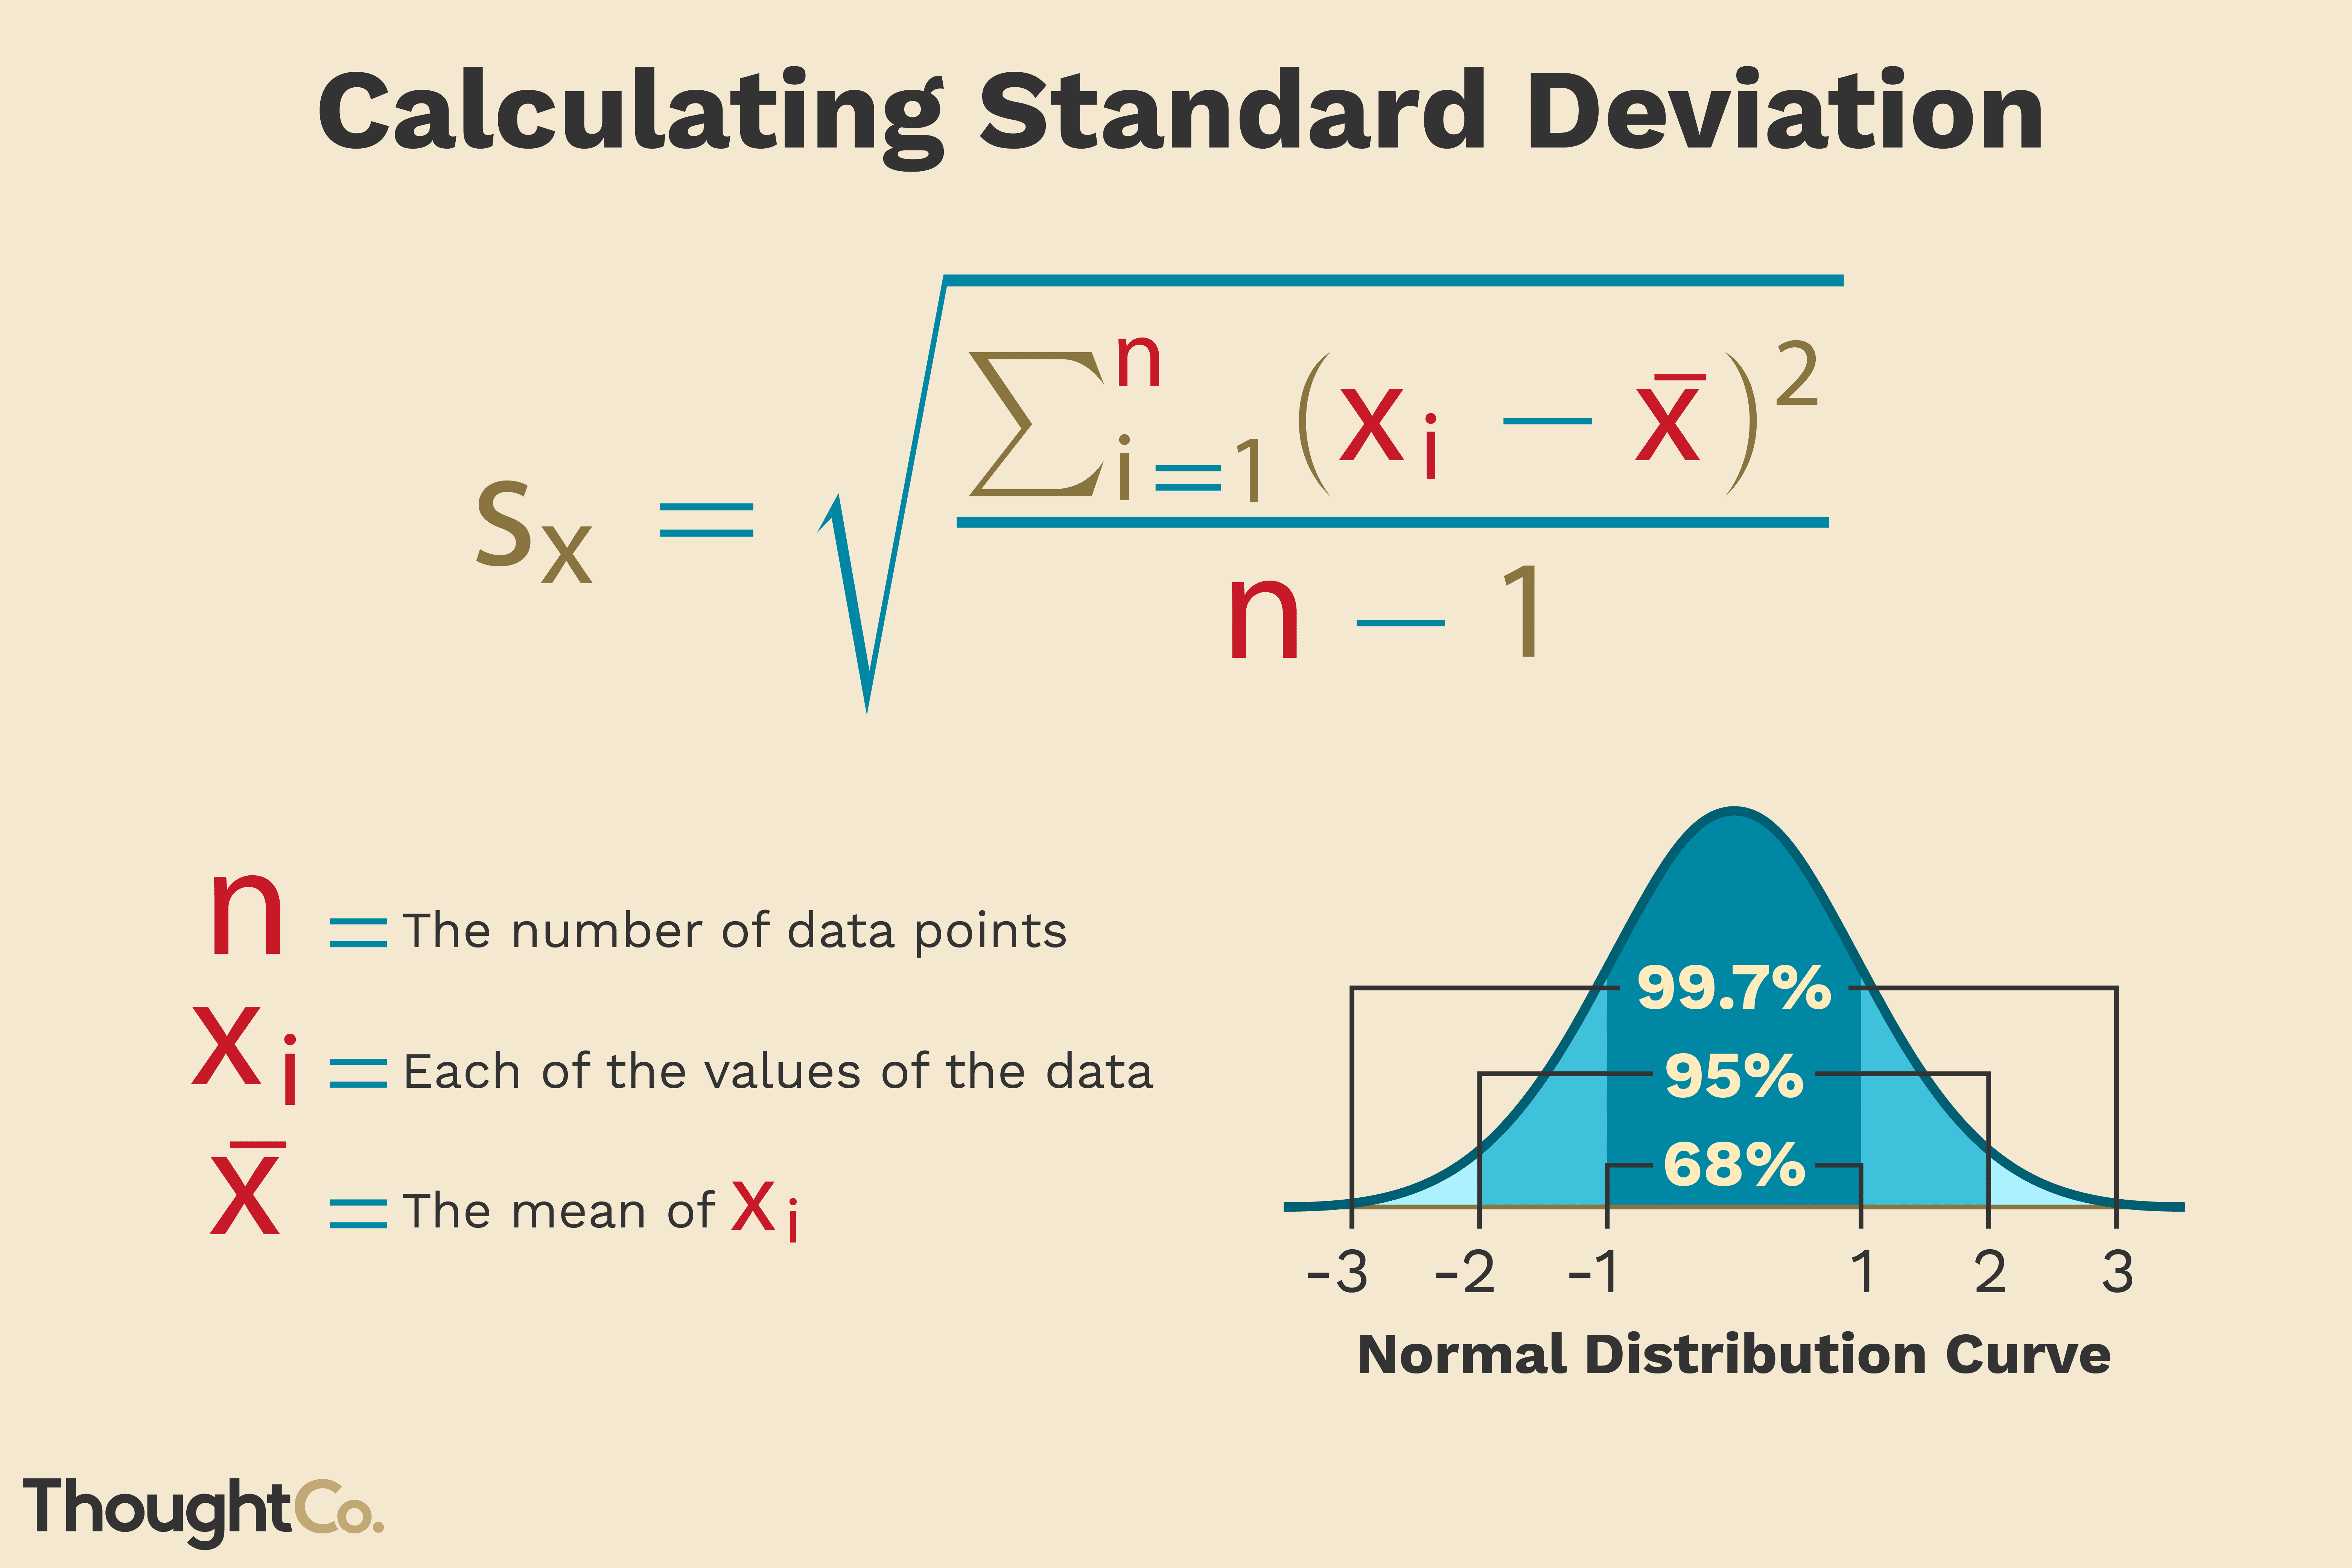
Define standard deviation.
a measure of s[read that depends on each number in the list; using the mean as the center of the data, the standard deviation takes into account how much each value differs from the mean and takes a type of average as these differences
The closer a datum is to the median, the __ the standard deviation.
smaller
How does one calculate the sample standard deviation of a datum?
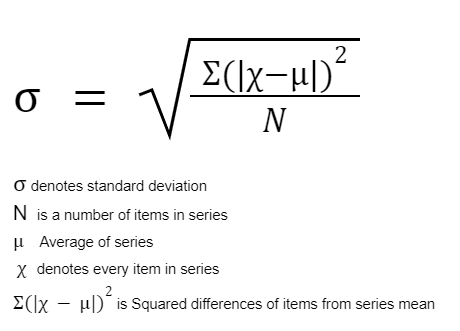
How does one calculate the population standard deviation of a datum?
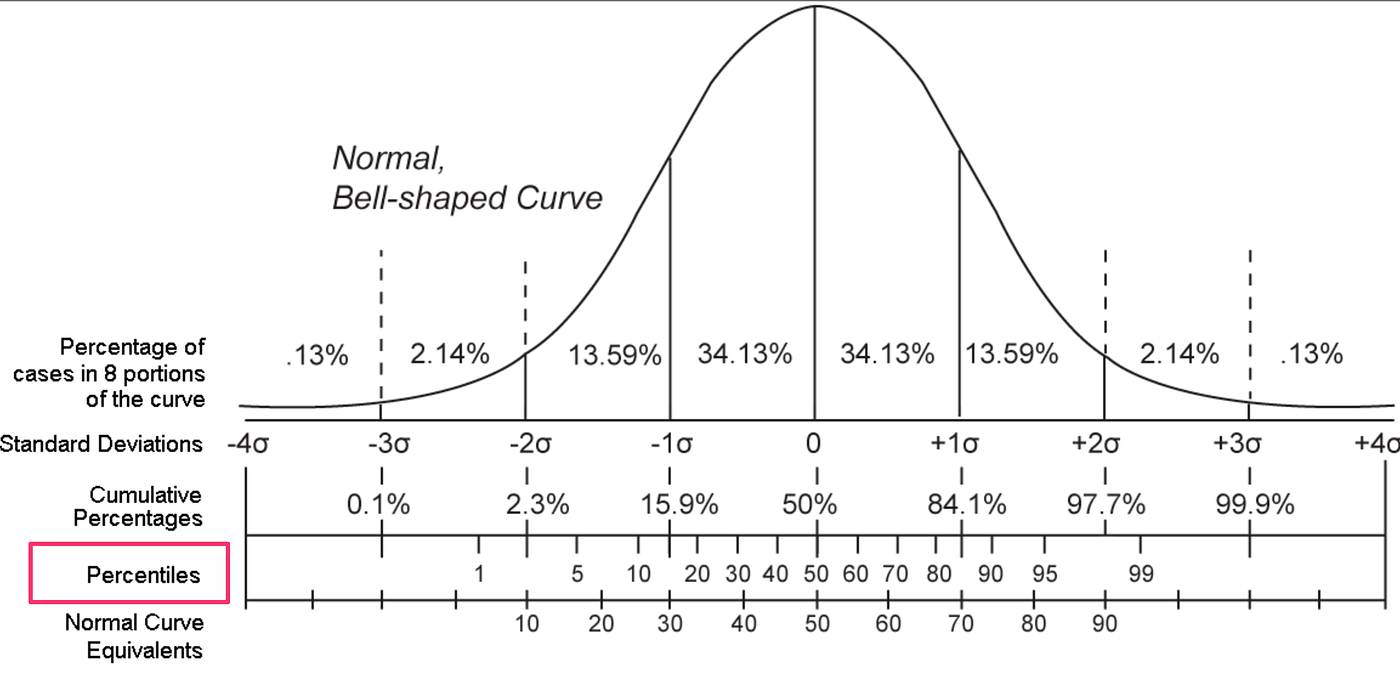
Define standardization.
subtracting the mean from each value and then dividing the result by the standard deviation; useful because for each data value, it provides the measure of position relative to the rest of the data independently of the variable for which the data was collected and the units of the variable; the process of transforming data into a consistent format, ensuring comparability and reliability across datasets, which is crucial for effective data analysis
True or False: In any group of data, most data values are found within 3 standard deviations of the mean.
true


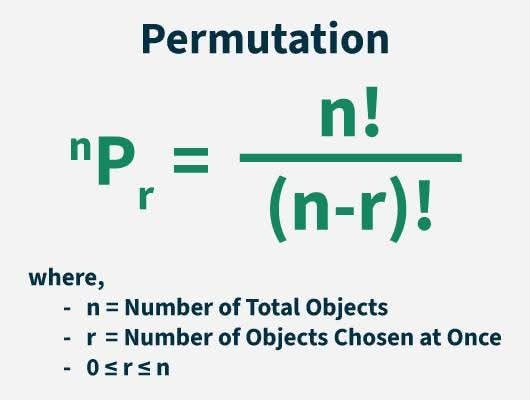
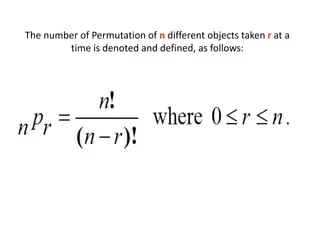
Define permutation.
a way, especially one of several possible variations, in which a set or number of things can be ordered or arranged
If there are n objects to be ordered from 1st to nth without repeating, how can you count the ways to order the objects without listing them out?
n(n - 1)(n - 2)…(3)(2)(1)
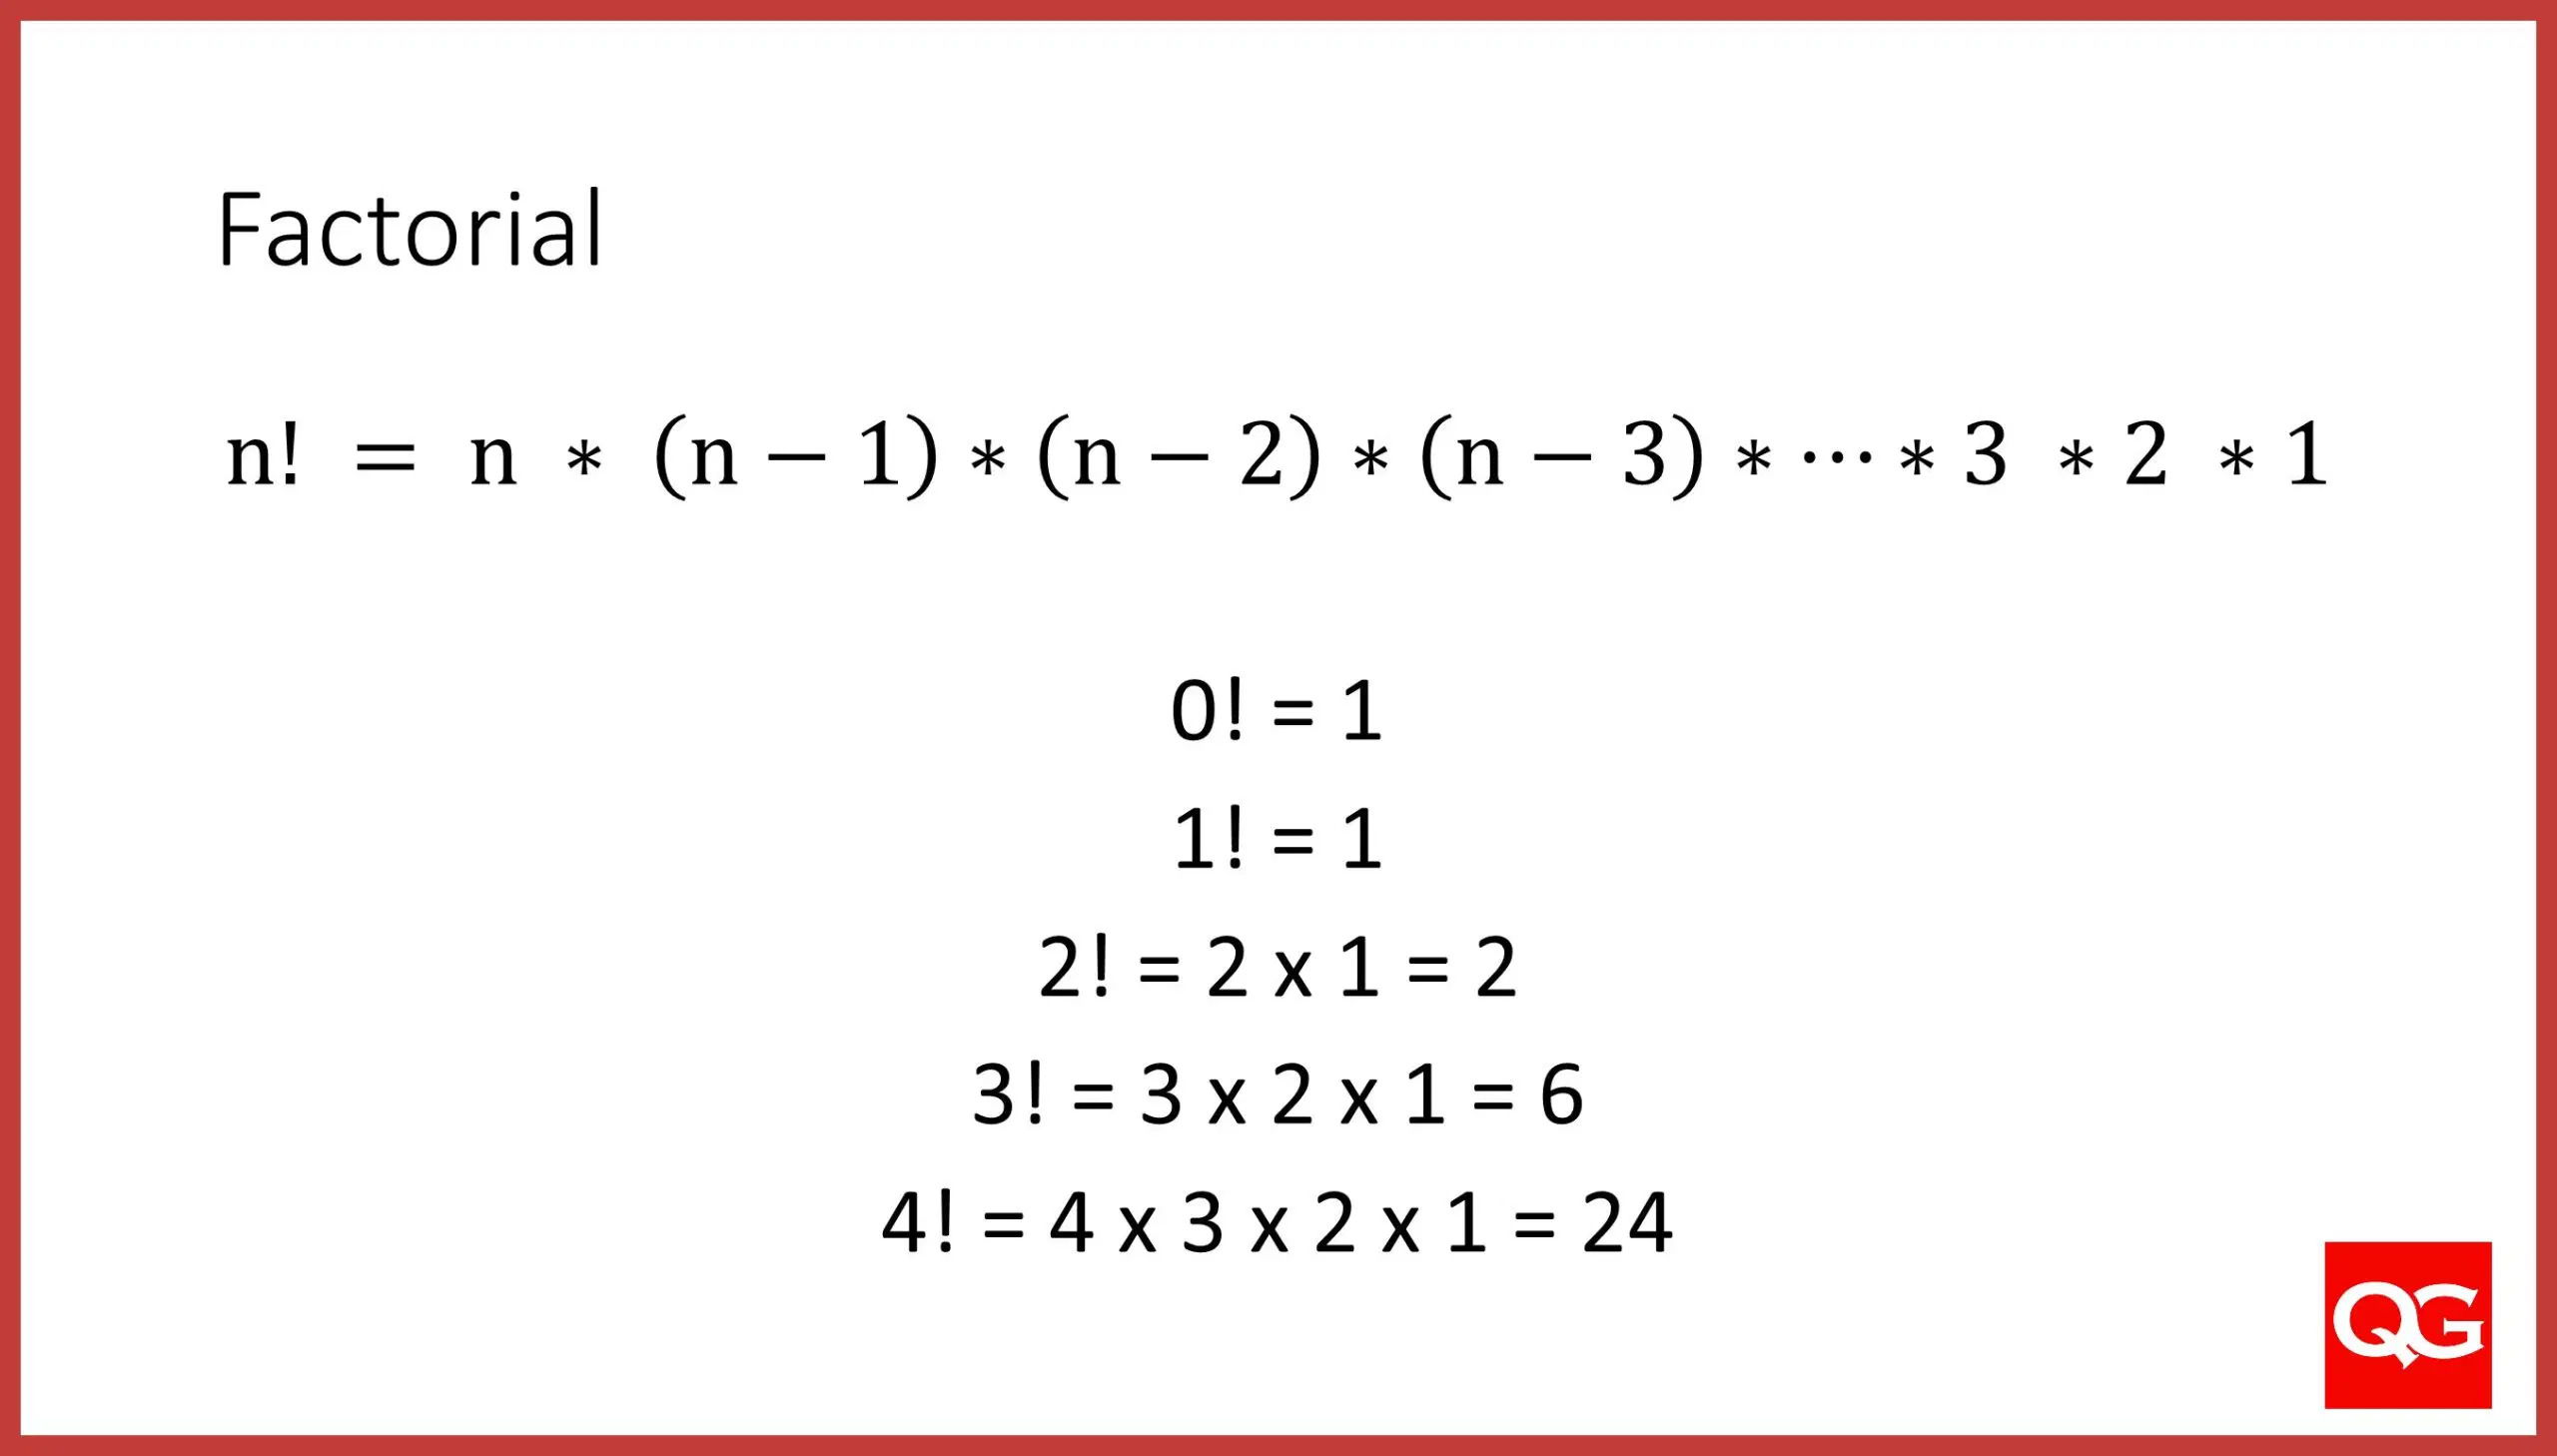
What is a factorial (n!)?
a mathematical operation, denoted by an exclamation mark (), that multiplies a positive integer () by every whole number below it down to 1
What is the formula for permutations when items are not repeated and order matters?
denoted as nPk
What is the expression 4! written out?
(4)(3)(2)(1)
How many five-digit positive integers can be formed using the digits 1, 2, 3, 4, 5, 6, and 7 if none of the digits can occur more than once in the integer?
There are (7)(6)(5)(4)(3) = 2,520 ways to do this which is equal to (7!)/(7 - 5)
(number of ways to select without order)(number of ways to order) =
(number of ways to select without order)(number of ways to order) = number of ways to select with order
(number of ways to select with order) ÷ (number of ways to order) =
(number of ways to select with order) ÷ (number of ways to order) = number of ways to select without order
Suppose you want to select a 3-person committee from a group of 9 students. How many ways are there to do this?
Students may not repeat, but order does not matter. Use the formula for the combination of 9 objects taken 3 at a time or “9 choose 3” to get (9!) ÷ (3![9 - 3]) = 84.