Looks like no one added any tags here yet for you.
Definition of the carbon cycle
The movement of carbon between different stores that have inputs, throughputs + outputs.
It is a closed system
It is a natural, physical system but is exaggerated by human activity (burning fossil fuels + deforestation)
What are the measures of carbon
Petagrams (Pt) + Gigatonnes (Gt)
Equal size and equivalent to 1 trillion kilograms or 1 billion tonnes
What are fluxes?
Movements of organic compounds e.g. those that contain carbon, through the ecosystem.
What is reservoir turnover
The rate at which carbon enters and leaves a store is measured by the mass of carbon in any store divided by exchange flux.
What stores is carbon present in
The atmosphere, as carbon dioxide and methane
The hydrosphere, as dissolved carbon dioxide
The biosphere, in living and dead organisms
The lithosphere, as carbonates in limestones and fossil fuels e.g. coal and natural gases
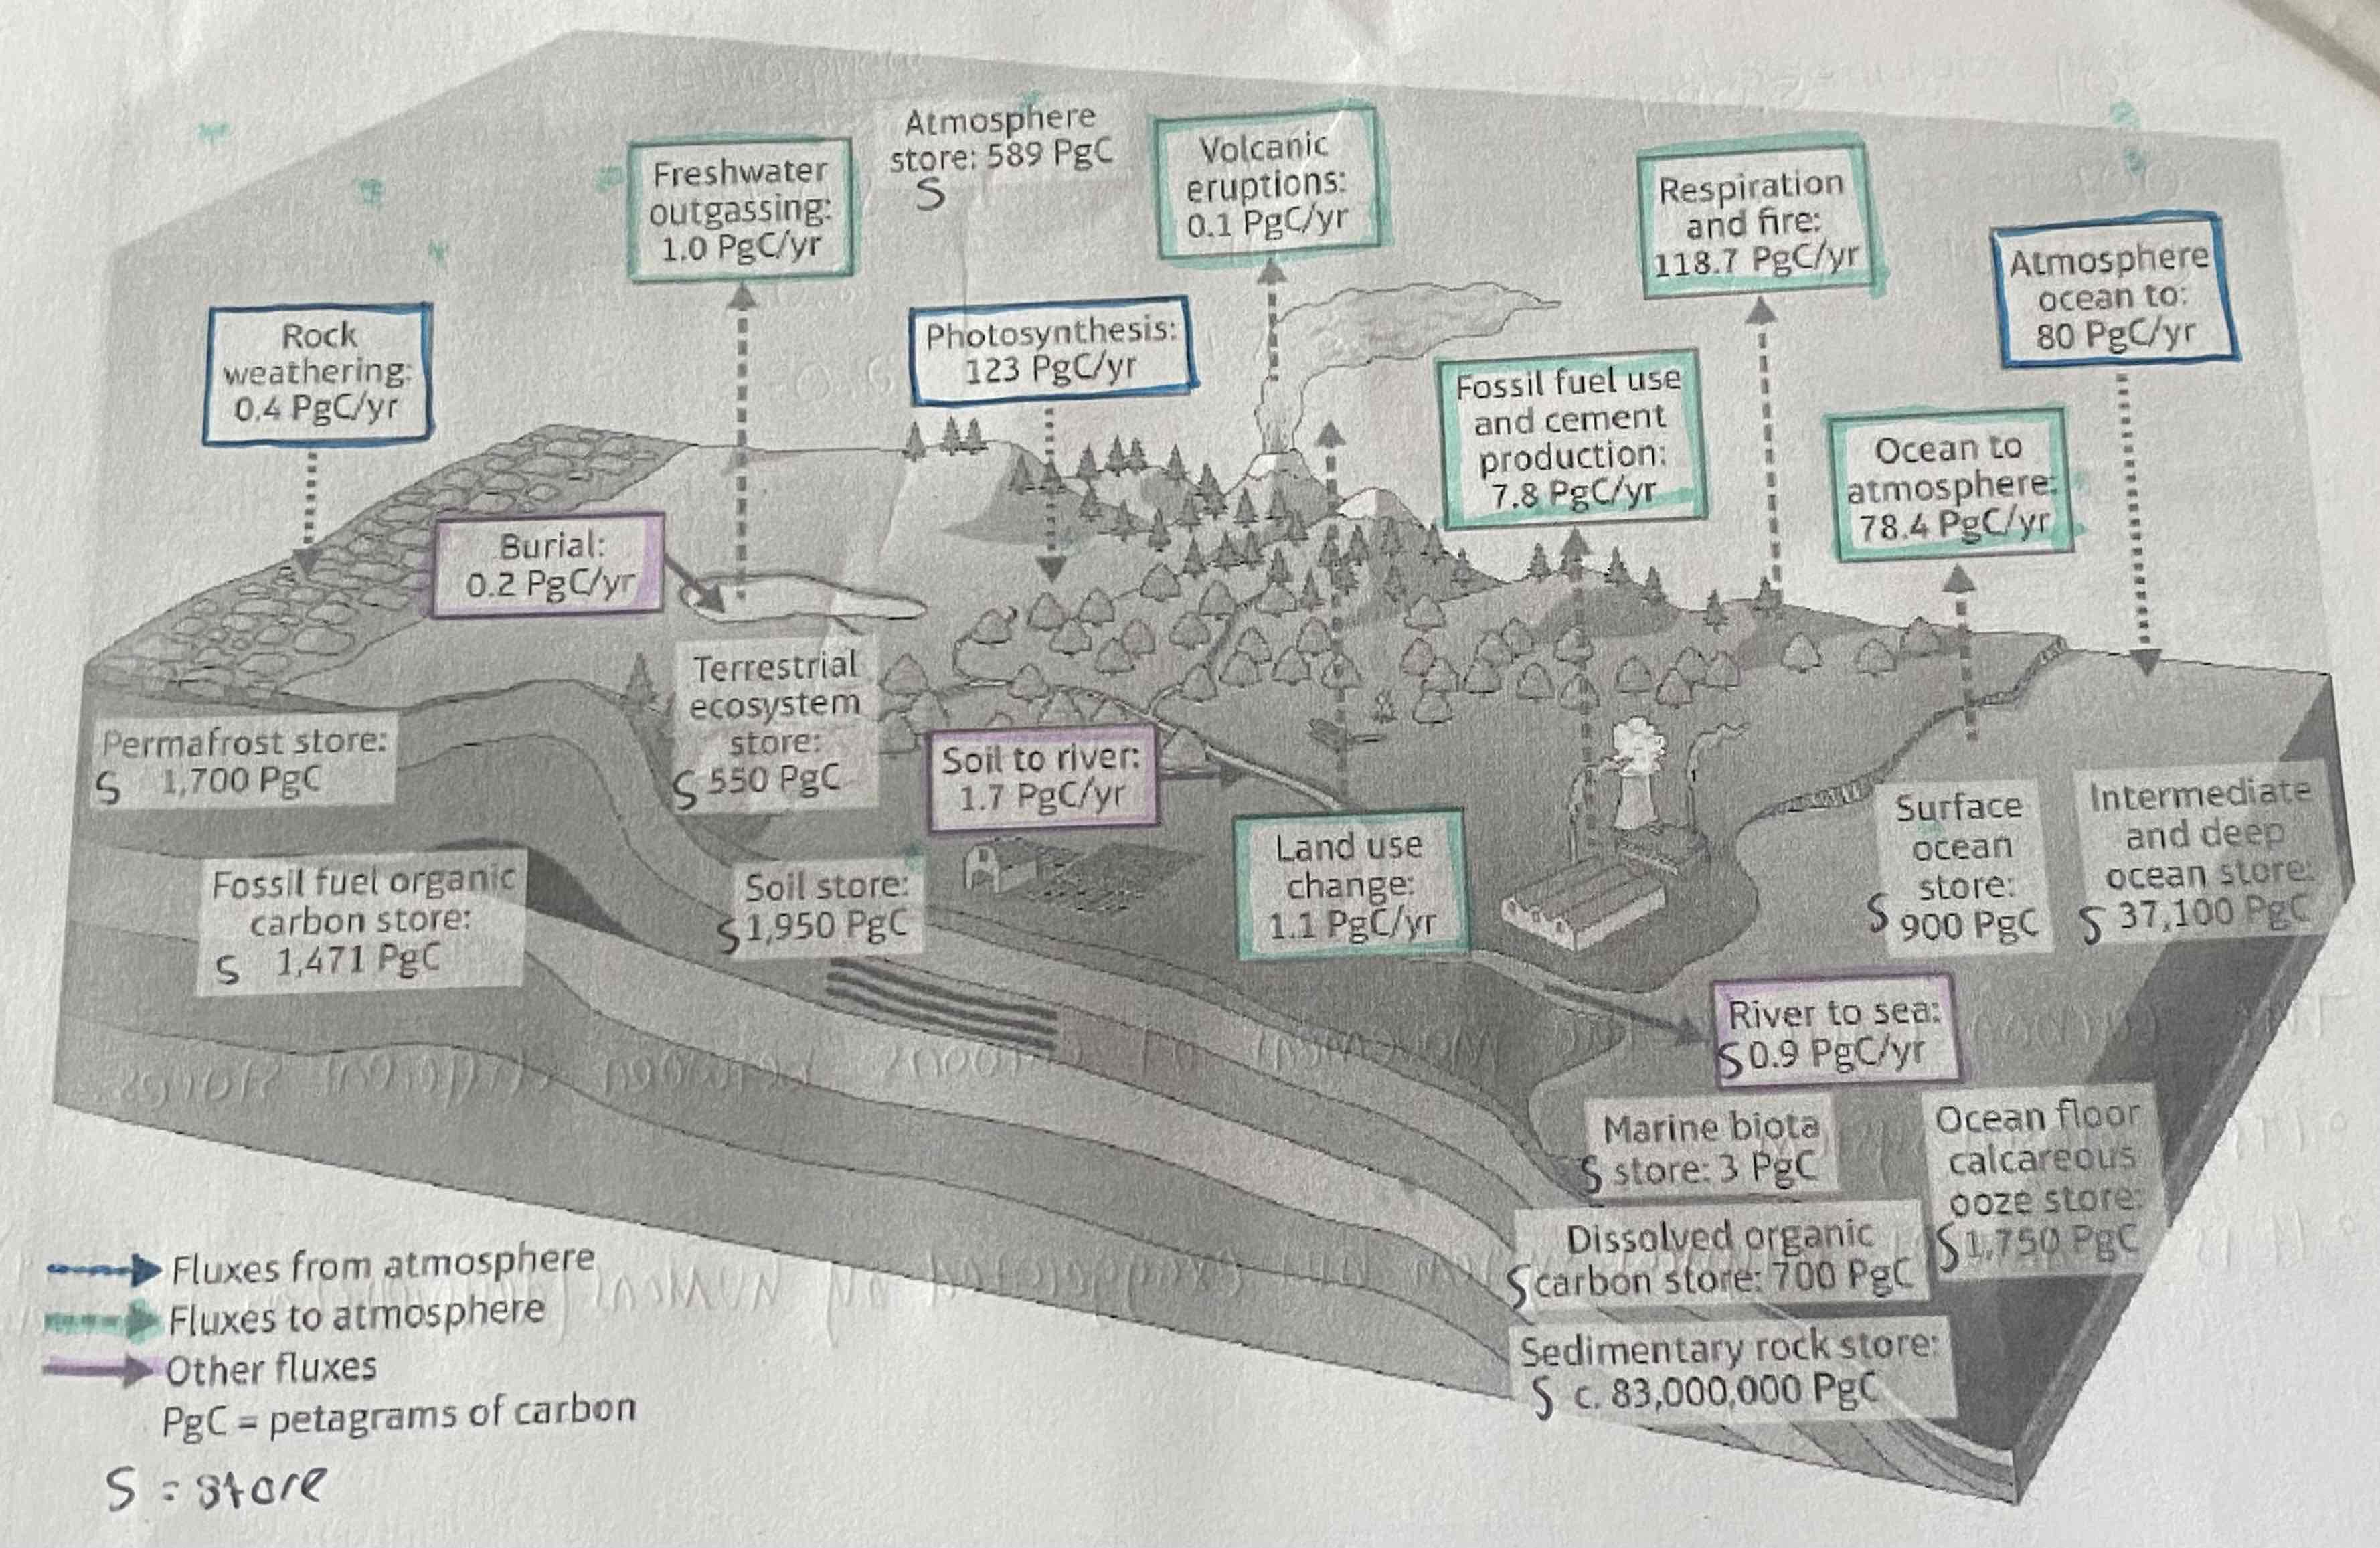
Diagram of global carbon system ( dont need to know just vibe)
rank the carbon stores from largest to smallest
Rank | Store | Terrestrial (T), Atmospheric (A), Oceanic (O) | PcG |
1 | Sedimentary rocks | T | 83,000,000 |
2 | Intermediate + deep ocean | O | 37,100 |
3 | Soil | T | 1,950 |
4 | Ocean floor calcareous ooze | O | 1,750 |
5 | Permafrost | T | 1,700 |
6 | Fossil Fuel organic carbon store | T | 1,471 |
7 | Surface ocean | O | 900 |
8 | Dissolved organic carbon | O | 700 |
9 | Atmosphere | A | 589 |
10 | Terrestrial ecosystem | T | 550 |
11 | Marine biota | O | 3 |
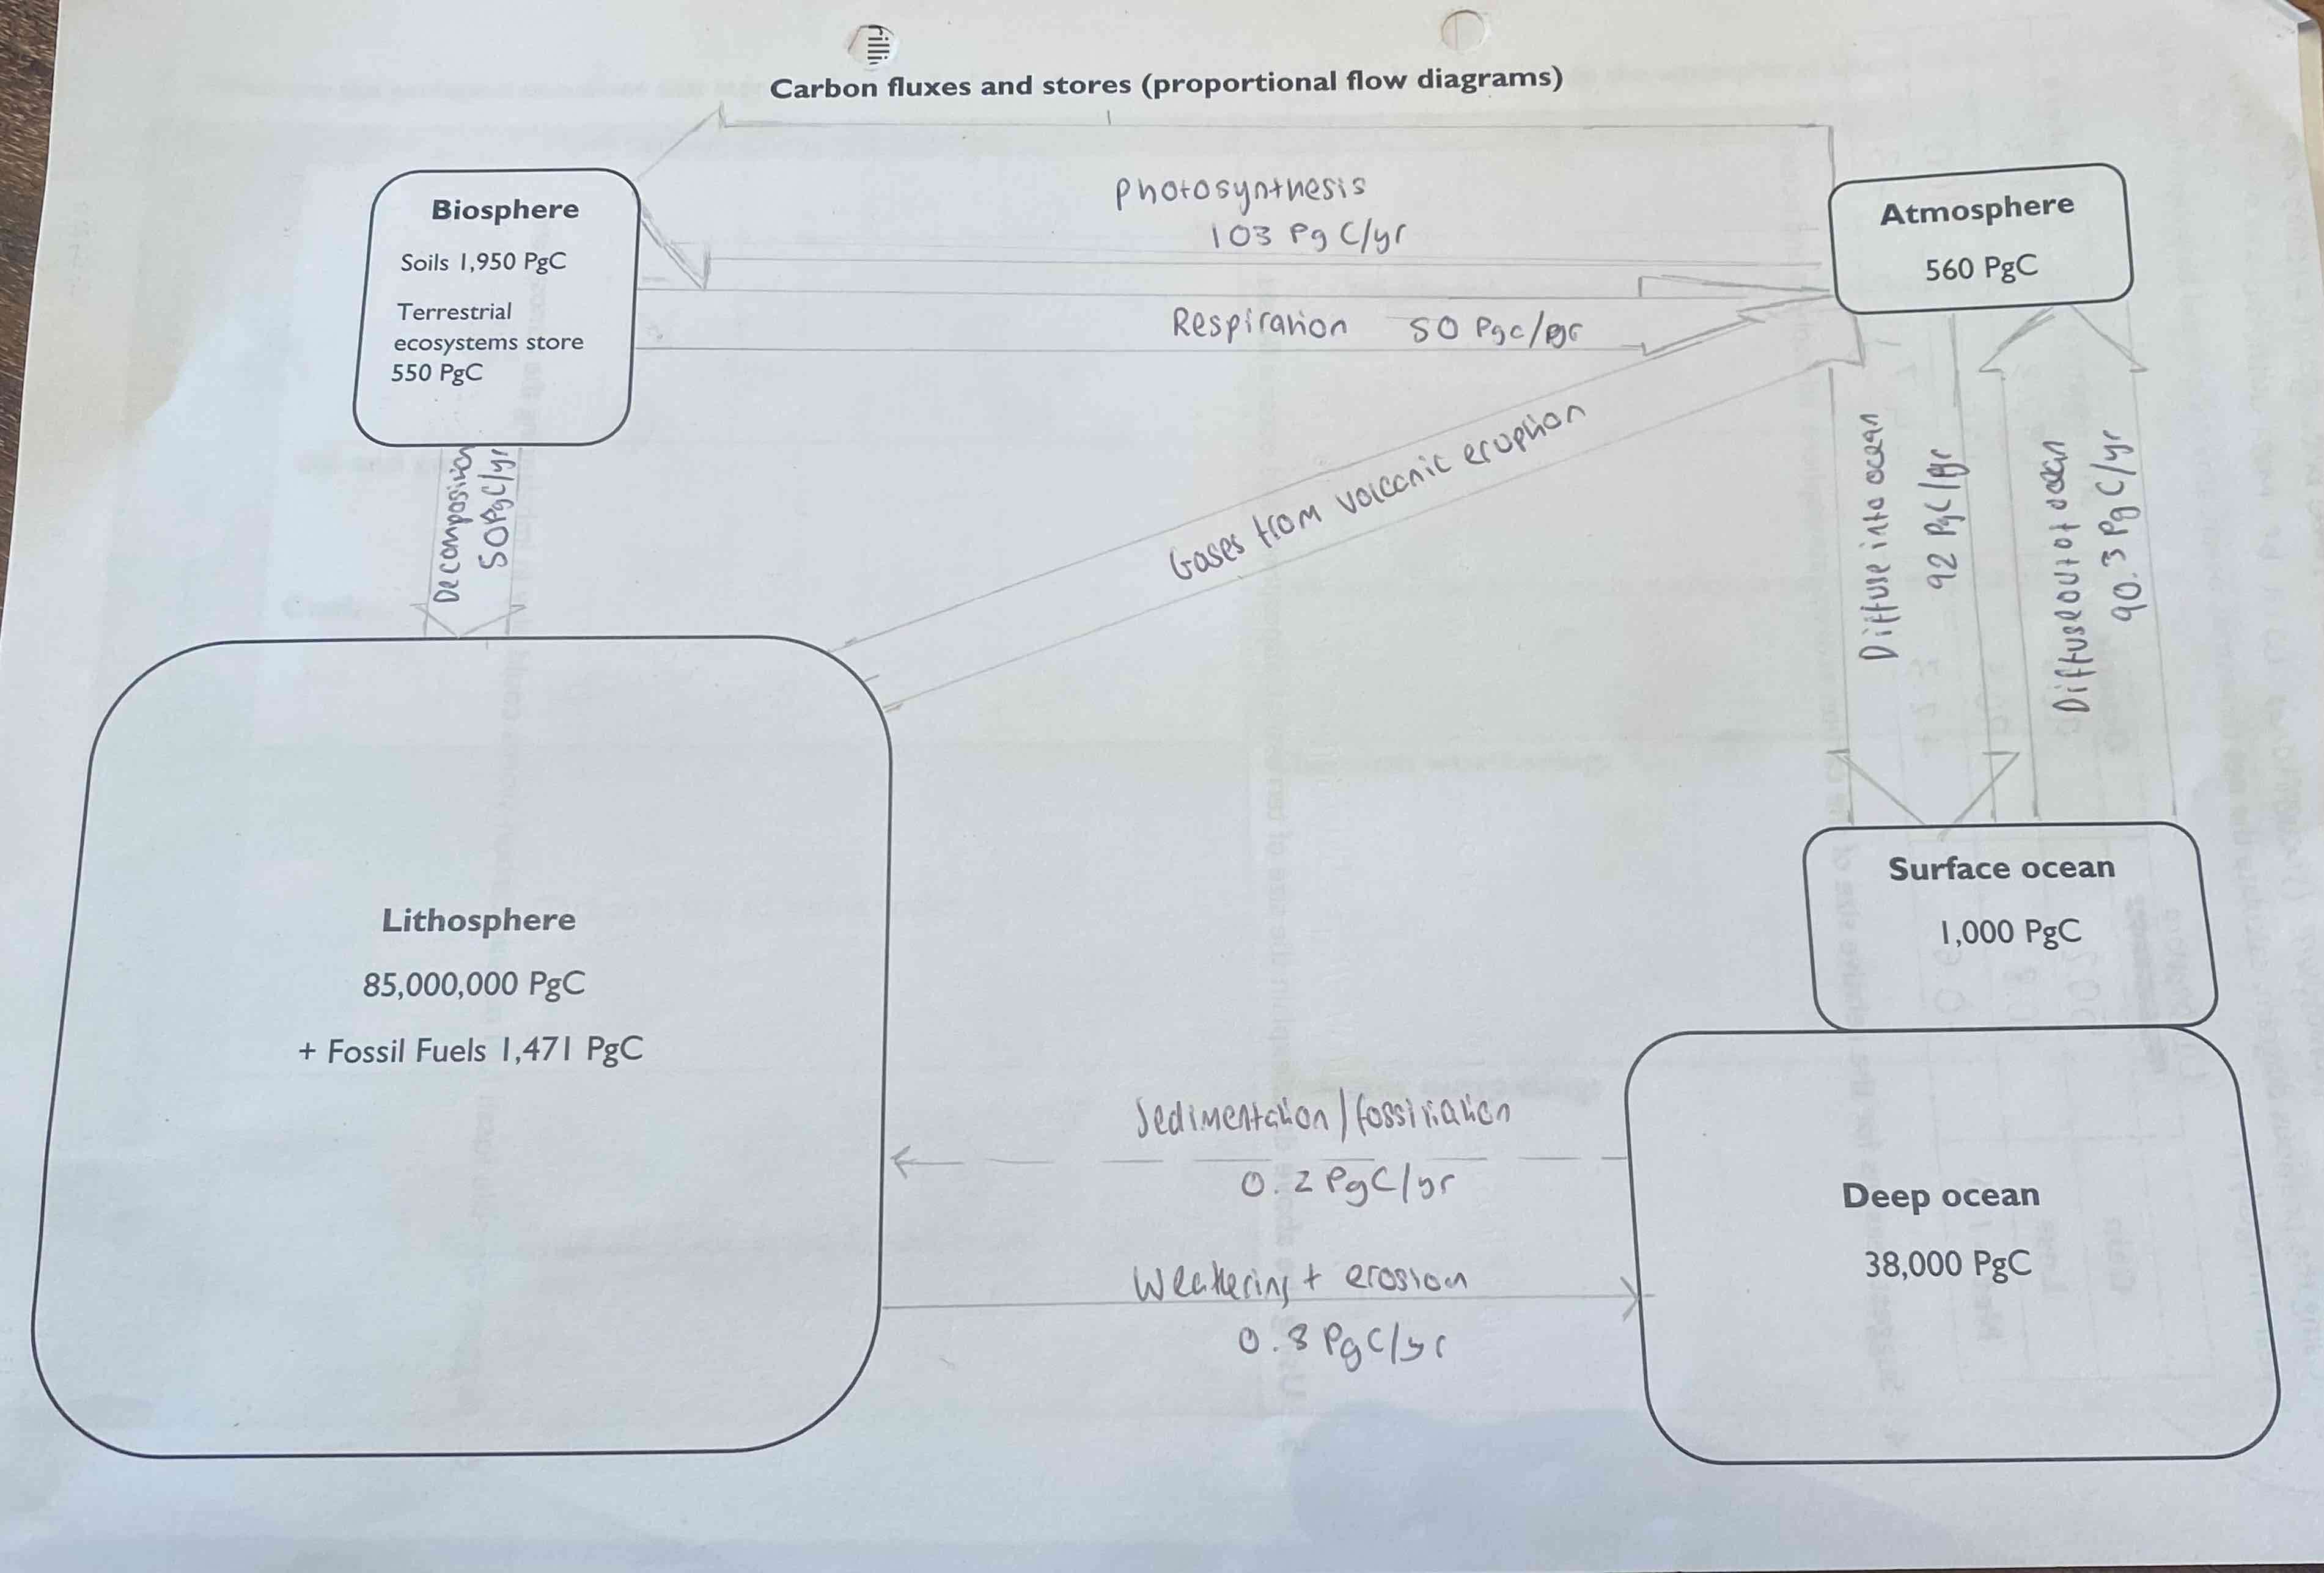
Carbon fluxes + stores (proportional flow diagram)
Net terrestrial, ocean, atmosphere and biosphere fluxes per year
| Lithosphere | Oceanic | Atmosphere | Biosphere |
Gain | 50.2 | 92.8 | 190.3 | 103 |
Loss | 50.8 | 90.5 | 195 | 100 |
Net +/- | -0.6 | +2.3 | -4.7 | +3 |
This shows us a net of 0 overall (closed system)
Relative to total size of each carbon store the gains + losses are small. However atmosphere (smallest store) will be the most vulnerable to significant change
Suggest reasons for the relative size of the carbon stores
The earths crust is the biggest volume (continental crust can be up to 70km deep) + large volume of earth is composed of sedimentary rocks = largest store. Lithosphere= most dense= hols most carbon.
Ocean covers 70% of earths surface, depth of several km + relatively dens ( 2nd largest)
Atmosphere= thin relative to others + much less dense= less CO2
Biosphere is thin but high density
ALL ABOUT VOLUME + DENSITY
Explain the size of terrestrial, atmospheric and oceanic fluxes
Largest fluxes associated with atmosphere :atmosphere- biosphere- via photosynthesis- rapid ongoing interchange takes mins/secs. Bio to atmosphere- respiration, atmosphere to ocean + vise versa- diffusion + biological process (plankton)
Smallest fluxes= lithosphere- Ocean to lithosphere- sedimentary rocks gain carbon very slowly through sedimentary + fossilisation, litho to oceans- weathering + erosion= slow process
About rate/ speed of process + scale of flux e.g. photosynthesis (global) outgasing (localised)
Suggest the role of fossil fuel organic carbon stores
Humans burn carbon from the lithosphere e.g. coal and the carbon is added to the atmosphere.
The atmosphere is the smallest store = most vulnerable to change
What are the geological processes that store carbon in the lithosphere
Carbon in limestone + shale
Carbon fossil fuels
Geological processes
Hoe does the carbon in limestone + shale store form?
sedimentary rocks start as oceanic sediments. 80% of which are derived from shell building (calcifying) organisms (corals) + plankton:
These sea floor layers are cemented together + Lithified (turned into rocks) into limestone. 20% contain organic carbon from organisms that have been embedded in layers of mud. Heat + pressure compressed mud + carbon into sed. rocks such as shale. These rocks folded up by mountain building e.g. Himalayans
How is carbon in limestone + shale released?
Weathered, eroded + transported back to the oceans
How does carbon fossil fuel stores form?
Oil + Gas- Formed from tiny aquatic creatures. Gas + oil occur is pockets + migrate up through crust until they meet an impermeable ‘cap rock’.
Coal: formed from remains of compressed veg (trees, fern + other plants) that have been prevented from decomposing
How is carbon from fossil fuels released
When burned by humans, carbon is released into atmosphere.
How carbons stores are formed from geological processes
Carbon is stored within rocks |
Pockets of CO2 exist in the earths crust |
How is carbon released from within rocks + the earths crust
Chemical weathering: Deposition + burial of calcite (CaCO3 ) from dead organisms turn into limestone. Later uplift of limestone through tectonic uplift can lead to limestone being exposed to chemical weathering processes- carbonation |
Volcanic outgassing: Subduction of limestone could also lead to pockets of CO2 becoming trapped in the crust. Volcanic eruptions or earthquakes may allow pulses (through more viscous andesitic magma) or more diffuse fluxes (through less vicious basaltic magma) of trapped CO into the atmosphere. Volcanoes currently emit 0.15 to 0.26 Gt/yr |
Definition of Sequestering/ sequestration
The storage of carbon by physical or biological processes.
What are the 2 long term stores of carbon + how long
Lithosphere + deep ocean
Centuries to Millions of years
How quick do Biological processes sequester carbon + examples
Typically they sequester carbon over a shorter timescale (Mins to Decades)
Most biological processes occur in shallow ocean or on land
Define carbon cycle pumps
The processes that help to move and store carbon around the shallow ocean
Name the 3 main oceanic biological processes that sequester carbon?
The biological pump (photosynthesis + respiration)
The carbonate pump (sedentation of marine shells)
The physical pump (transfer of water by ocean currents, driven by differences in temps + salinity)
Explanation of the biological pump
Phytoplankton float near ocean surface to get light for photosynthesis
Carbon is passed up food chain by consumer fish + zooplankton which releases CO2 back into the water + atmosphere via respiration, most is recycled in surface waters, only 0.1% reaches ocean floor after dead plankton sinks + decomposes or turns into sediment.
Explanation of carbonate pump
Organisms shells + skeletons made of CA CO3
Organisms die + sink
Shells dissolve before reaching floor
Carbon is part of deep ocean currents
Undissolved shells build up on sea floor, forming limestone sediment.
Explanation of physical pump
Based on oceanic circulation of water including upwelling + downwelling + thermohaline current.
Cold water= more potential for CO2 to be absorbed
Warm tropical waters release CO2 to atmosphere, whereas colder high latitude oceans take in CO2 from atmosphere.
What is thermohaline circulation
Refers to global ocean currents as a result of varying levels of salinity + temps.
Vital part of oceanic component of carbon cycle.
Mechanism that drives global oceanic currents so controls processes responsible for physical pump as well as elements of biological + carbonate pumps.
Cold water currents sink + associated with sequestration of carbon in deep ocean
Warm water currents rise + associated with release of carbon into shallow ocean + atmosphere
Take approx. 10,000 years for a cubic metre of water to cycle around system
Explain the terrestrial biological processes that sequester carbon (with diagram)
plants sequester carbon (in carbon dioxide form) from atmosphere through atmosphere.
CO2 may then be re-released by plant as it respires
Plants are eaten by consumer animals, carbon is passed through the animals fats + proteins + passed further up food chain (eaten)
Plant + animal waste matter is eaten by detritus feeders (e.g. microorganism + beetles)
after plant/animal dies decomposition of dead matter can occur + CO2 is released back into atompshere
The role of soil in carbon cycle
Soil is upper level of earth in which plants grow + contains 2 abundant forms of carbon:
Organic carbon- comprising of living organism in sol + decomposed remains of dead organisms e.g. humus
In organic carbon- comprising of rock particles containing carbon as part of their chemical composition e.g. calcite from limestone
Soil contains 20-30% of global carbon. The rate that carbon is cycled into soil affected by wide range of different factors + processes seen in Gersmehl’s model
4 factors that affect soil’s ability to store carbon
climate
soil type
human management + usage
Climate change
How does climate affect the soil’s ability to store carbon
Dictates plant growth + decompositions
Higher temps + water logged conditions= higher decomposition
Higher rainfall increases soils potential to store carbon
How does soil type affect the soil’s ability to store carbon
Clay rich soils= higher carbon content than sandy soils
As clay protects carbon from decomposition
How does human management + use affect the soil’s ability to store carbon
Since 1850s globally 40-90 billion tonnes of carbon loss through cultivation + disturbance.
Land use change relates to 0.8 billion tonnes of carbon loss
How does climate change affect the soil’s ability to store carbon
Rising CO2 Levels has indirect effect on stability of soil by affecting veg + stores + flows
Stats on soil
Humus soil contains 60% carbon + are important for sequestration + water storage
Stabilised carbon (longer turnover times) located in deep soils
What is the greenhouse effect, examples + what is its role
It is earth’s natural temp control system
E.g. Carbon Dioxide + Methane
Plays an important role in preventing sun’s energy escaping from the atmosphere.
Brief description of global variation in temp
temp decreases with distance from equator (some localised factors (e.g. altitude) add complexities
Higher concentration of solar radiation at ITCZ
Lower concentration of solar radiation with distance from ITCZ
This is due to the angle of the sun relative to the earth’s surface
Brief description of global precipitation variation
The variation in temp with latitude helps drive variation in precip levels globally
ITCZ is heated= experiences convection= band of low air pressure + high precip
Alternating high + low precip with distance from ITCZ forms 3 convection cells
Process of greenhouse effect
Earth’s climate is driven by incoming short wave solar radiation
Concentration of carbon (CO2+CH4) strongly influence natural greenhouse effect
Natural temp control system that relies on greenhouse gases
96% of sun’s energy is absorbed, almost 50% of this absorbed at Earth’s surface (especially by oceans)
Approx. 31% of sun’s energy is reflected by clouds, aerosols + gases in atmosphere
Large % of long wave radiation that has been radiated from Earth’s surface is re-radiated back to surface by clouds + greenhouse gases
69% of energy absorbed by earth’s surface is re-radiated to space as longwave radiation
Trapping of longwave radiation is what gives Earth a life supporting average of 15 degrees- the natural greenhouse effect
DIAGRAM
What has scientific investigations of past climate records showed us
A strong correlation between atmospheric CO2 and global temp
What is the greenhouse effect described as
Self regulating
Up to 1750 natural processes kept atmospheric CO2 levels stable through processes of photosynthesis + respiration.
How do photosynthesis and respiration balance atmospheric CO2
Increase in CO2 in oceans or atmosphere encourages more photosynthesis + carbon is then transferred to biosphere
When CO2 levels drop reverse happens (respiration)
How has human activity altered soil health
Soil heath depends on amount of organic carbon stored in soil. This depends on inputs + outputs (pic of Gersmehl's model)
Carbon is main component of soil’s organic matter + helps soil to retain moisture- needed for plant growth.
Organic Carbon found at greatest concentration in top layer of soil- easily eroded by veg removal (deforestation) or unsustainable farming practice.
How has human activity- Fossil fuel consumption altered climate, ecosystems + hydrological cycle
Industrial revolution (human combustion of FF) has led to acceleration in exchange from lithosphere stores to atmosphere (naturally slow flux). Consequently, atmospheric CO2 has risen from below 300ppm to above 400ppm.
Natural forcers of climate include Milankovitch cycle, sun spots + volcanic activity- not powerful enough to account for recent global warming trends.
IPCC reports have identified a clear correlation between fluctuating CO2 levels + global temp (enhanced greenhouse effect)
Suggest reasons for gains + loses of these stores: atmosphere, veg, FF, land (rocks + soils), oceans
Store | Rate of loss/gain per year (PgC/yr) | Suggested reasons |
Atmosphere | +240 | Burning of fossil fuels Destruction of land + ocean ecosystems |
Vegetation | -30 | Deforestation: direct (logging, agriculture + mining) |
Fossil fuels | -365 | Burnt so carbon is in atmosphere (extraction + combustion) |
Land (rocks + soils) | +2.6 | Stable relative to size (mining + farming) |
Ocean | +155 | High atmospheric CO2 : more diffusion into oceans Human induced climate change warms ocean + stimulates higher ocean productivity
|
Table shows estimates of human influence on carbon cycle stores
Enhanced greenhouse effect on climate change
Antarctic shelves will melt
Temperate + tropical zones may experience strong storm activity as result of more heat energy + moisture in the atmosphere, including more intense tropical cyclones + stronger mid-latitude westerly winds
Precipitation will increase in higher lats + decrease in lower lats
The Sahel, Mediterranean, South Africa + South Asia will become drier, with drought more common
Nu of cold days decrease + hot increase
Enhanced greenhouse effect on Ecosystems
Habitat changes will bean 10% of land species with limited adaptability will face extinction
Rates of extinction could rise 15-40% in all species
In N Brazil, Central-S Africa, lower rainfall + soil moisture will cause changes o soil + oxygen, will reduce biodiversity
About 80% of coral reefs could be bleached
Enhanced greenhouse effect on Hydrological cycle
Rivers will dry up in regions where precip is reduced
A shift of subtropical high-pressure areas northwards will cause a 20-30% decrease in water availability
Small glaciers will disappear
Humidity levels in atmosphere will increase
Flash floods because of period of heavy precip
Permafrost areas will thaw
3 main types of energy sources
Fossil Fuels (non renewables)
Recyclables
Renewables
What are subsections of fossil fuels
Coal- Lignite (least pure)/Anthracite(hard coal-purest)
Natural gas- Conventional/Shale gas- unconventional
Crude oil- Conventional/unconventional (tar sands)
Subsections of recyclables
Nuclear- Fission/fusion?
Subsections of renewables
Tidal, Wave, Hydro-electric, Wind, Solar, Geothermal, Biomass (Cow dung/Biogas/Wood/Biofuel)
What is the energy mix of a country
The proportion of each primary resource it uses each year, can be produced within country (domestic) or imported (foreign)
Primary energy definition
Natural energy sources that haven’t been converted into another energy form, included FF, nuclear + renewables.
Secondary energy definition
What the primary source has been converted into (usually electricity)
What does power generation mix refer to
The combo of energy sources used to create electricity
How does energy consumption vary globally- energy use per capita
Highest: Iceland, USA, Canada, Saudi Arabia, Oman, AUS
Lowest: Central +S Africa, Mongolia, India, Equatorial Guinea, S+ SE Asia
Reasons for high and low energy use per capita
High reasons: Economic wealth (USA,AUS), Availability (Saudi Arabia, Iceland), Industrialisation (explains the emerging countries high use), Climate (Canada, Iceland), Energy efficiency
Low reasons: No money to invest in tech + not industrialised= needs less
Example: Iceland- highly developed= high whereas Eq. Guinea isn’t developed= lower
How does energy consumption vary globally- GDP per unit of energy use
n indication of energy efficiency/ dependency in the economy
-Much of Europe has high GDP per unit of energy- Tertiary economic activates + efficient use
-Many developing countries have agricultural economies + low energy use so GDP per unit is higher
Example: Iceland- very wealthy but very high energy consumers- climate and cheaper geothermal
Eq. Guinea- low use but relative wealth (from oil exports)
How does the energy mix vary- global energy use + mix over time
Global energy use has increased rapidly since 1950s.
Before 1950s manly (traditional biofuels, coal-easily accessible) + some crude oil
Crude oil, natural gas= need machinery only invented later on + only used in economically advanced countries
Renewable energy= only recently due to new tech + research- hydropower= most popular. Affluence + climate change= more dev countries put in effort as environmental priorities are now top
Traditional biofuels- still used in less dev. countries
Pop growth- steady till 1980s then spike follows graph
Industrialisation- coal, oil= foundation for industrial revolution
How odes the energy mix vary- Domestic/ foreign energy mic for selected countries
Ethiopia= low GDP not able to import + low overall energy use (can’t be seen on map) + reliant on small scale biofuels
USA= lots of natural resources so don’t need imports (Alaska- oil + Shale gas= Recent fracking)
India + UK= some coal reserves in India + some natural gas in England, UK north sea, oil + natural gas + renewable= offshore wind farms
Japan= little natural resources + High GDP
Primary energy mix for selected countries
Ethiopia= low levels of dev= less tech so use of biofuels
UK- lots of gas + oil= more efficient + cleaner than coal + some renewables cos developed
Japan- Coal, gas, oil (biggest= oil)
USA- ¾ coal, gas, oil (biggest =oil)
India- nearly half coal + ¼ biofuels
Primary energy mix of UK over time
Name the factors affecting access to and consumption of energy resources (6 of them)
Tech, Cost, Physical availability, environmental priorities, level of economic dev, public perceptions
How does technology affect access to and consumption of energy resources
Tech influences consumption e.g. almost all nuclear producing countries= emerging + developing (it requires high tech reactors)
Also influence access e.g. US- fracking- involves unconventional, high cost extractions
How does Cost affect access to and consumption of energy resources
WIND- Higher initial cost than fossil fuel plants
NUCLEAR-France + Japan provide some of cheapest relative energy in Europe e.g. many countries develop their own energy resources to avoid important taxes.
High cost of OIL+ potentially unreliable supply= countries invest in other sources e.g. Solar in Morocco
How does Physical availability affect access to and consumption of energy resources
OIL + GAS- Most gas in Iran + Russia, most oil in Venezuela + Saudi Arabia
SOLAR- West coast S.America + Africa highest solar irradiance
WIND- Can’t be stored or transported= consumed close to supply- UK, US + China= big on wind
Middle east (e.g. Saudi) = largely dependant on oil due to its vast reserves- 66% of worlds total
PA= Strongly influences access + consumption to some extent e.g. Coal- Russia, USA, China, India, Germany, S. Africa all dominant in reserves + consumptions
Morocco= currently building worlds largest Concentrated solar power (CSP) plant due to very high solar irradiance
Lack of access is also important e.g. Nuclear in France + Japan due to lack of Fossil Fuels
How does environmental priorities affect access to and consumption of energy resources
influences consumption e.g. EU moves away from coal fuel to it being worst polluting FF
Germany + France= banned fracking whereas UK (halted) + US= not banned (NY state it is)
COAL- emits more CO2 than every other FF + deadly toxins= responsible for over 20,000 deaths
How does public perceptions affect access to and consumption of energy resources
OIL + GAS- Fracking- shale gas banned in France, UK, Germany + New York
URANIUM/ NUCLEAR- Renewable but dangerous
Influences access + strongly influences consumption e.g. Japan reduced electricity from nuclear after Fukushima accident due to protests
How does levels of economic dev affect access to and consumption of energy resources
WIND- generally set up as countries become more developed due to high initial cost
Strongly influences consumption e.g. all energy types are used most in developed + emerging economies e.g. rapid growth of Chinas coal use
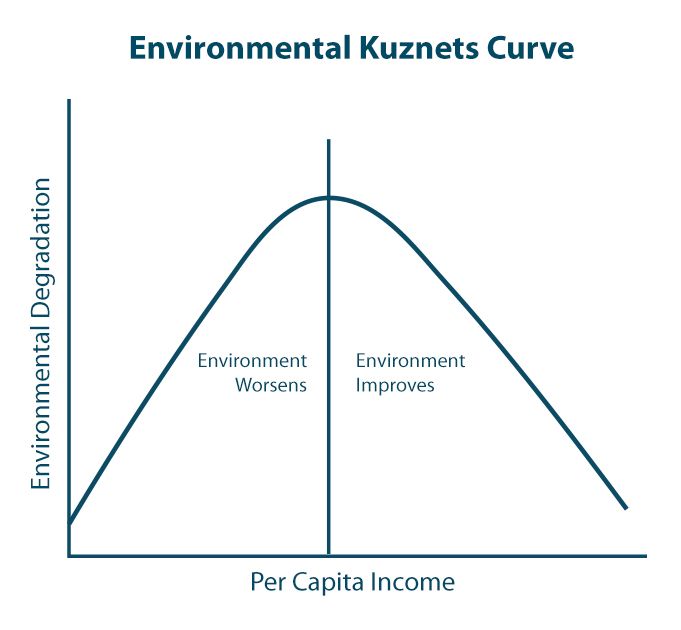
QU on access to ad consumption of energy resources always link to..
Kuznets curve of wealth + environmental degradation
Who are the energy players- Virunga national park- pre 2013
DR Congo Gov | Total- Oil + Gas TNC | Soco International Oil + Gas- TNC | WFF- world wide fund for nature | UNSECO- UN educational, scientific + cultural organisation | Western gov, other NGOS, indigenous groups | EQX biome- US investment firm | Uganda gov |
Provides concessions to oil companies | Pays for + holds a concession | Pays for + holds a concession |
| Gives Virunga world heritage status- 1979 |
|
| Discovers oil in 2006 |
Who are the energy players- Virunga national park- 2013
DR Congo Gov | Total- Oil + Gas TNC | Soco International Oil + Gas- TNC | WFF- world wide fund for nature | UNSECO- UN educational, scientific + cultural organisation | Western gov, other NGOS, indigenous groups | EQX biome- US investment firm | Uganda gov |
Authorise oil surveys in Virunga | Agreed to respect Virunga park currents boundaries (in light of WWF, UNESCO + Western gov pressure) | Did ariel survey to find oil -Claims area of interest is nowhere near gorilla habitat (endangered) | Campaign- Draw the line, against exploitation of park | Called for cancelation of all Virunga oil permits | UK expressed opposition to drilling inside park |
|
|
Who are the energy players- Virunga national park-2014
DR Congo Gov | Total- Oil + Gas TNC | Soco International Oil + Gas- TNC | WFF- world wide fund for nature | UNSECO- UN educational, scientific + cultural organisation | Western gov, other NGOS, indigenous groups | EQX biome- US investment firm | Uganda gov |
|
| Stopped exploiting Virunga world heritage site in DRC for oil | Said park could support 45,000 people if peaceful industries (hydropower, fishing, ecotourism) were developed= economic drive for locals | Claims Success in Persuading SOCO to agree not to drill- calls on DRC to cancel all oil concessions (WWF too) |
|
| Plans to exploit oil in Lake Edward- extends into Virunga |
Who are the energy players- Virunga national park-2023
DR Congo Gov | Total- Oil + Gas TNC | Soco International Oil + Gas- TNC | WFF- world wide fund for nature | UNSECO- UN educational, scientific + cultural organisation | Western gov, other NGOS, indigenous groups | EQX biome- US investment firm | Uganda gov |
Original concessions remain, 27 more marketed in 2022 | Still holds concession | Still holds concession | Continuing campaigning | Continuing campaigning | One forest summit- French, African govs, NGOs + Indigenous groups discuss Congo conservation | Expressed interest to |DRC for 27 oil concessions (would buy them to stop oil being exploited + protect environent) |
|
What are the benefits of dev new conventional oil in DRC
Some social investments in region from oil companies- road upgrades, medical programmes, mobile phone masts
Support path from low- middle income country status
Self-reliance in funding investments such as energy + transport infrastructure
Uganda= pot. to become top 50 oil producers- enough oil to support strong export economy= pot. to earn over $2b per yr
What are the costs of dev new conventional oil in DRC
½ worlds remaining mountain gorillas (480)= threatened
Other species-elephants, hippos, crocs, chimps= threatened
One of world’s most fragile ecosystems- damage by deforestation + oil infrastructure= irreparable
Concern for oil spills- Lake Edward- 200,000 people rely on lake for food supply + livelihood
Long term treat to prosperity of local though ecotourism
Could further destabilise region + further increase threats- DRC= corrupt + civil war already
Virunga- future?
Oil companies still hold concessions- could change mind about drilling in park
Soco has said it won’t drill in park but has been accused of lobbying DRC to move boundaries
Uganda seems intent on exporting its oil= route to middle income status
Uncertain future
What are the roles of energy TNCs + state owned energy companies in securing pathway + supplies
Play huge role in exploring + transporting FF + refining
producing chemicals
Oil companies have significant lobbying power + can influence gov energy + environmental policies
Many energy TNCs have been accused of being involved in neo-colonialism (often operate in developing/ emerging countries)
e.g. BP + Gazprom
What are the role consumers securing pathway + supplies
Most influential consumers= transport, industry + domestic users
Largely passive players when it comes to fixing energy prices
Can influence gov policies, as recently seen with move towards sources of energy that emit less carbon ( especially in developed countries)
However, it’s likely that the main driver in shifting towards greener energy will be affordability
What are the role of energy supply companies securing pathway + supplies
they convert primary energy into electricity + then distribute to consumers
Have considerable influence when it comes to setting consumer prices
Buy wholesale power, pay distributing network + gov policies costs + then charge consumers for supply of their electricity or gas
Been accusations of these companies profiteering
What are the role of national govs in securing pathway + supplies
fundamental role in deciding a country’s energy policy, especially their energy mix
Govs must strike balance between economic growth, social+ environmental sustainability
Aim to ensure country’s energy security, through developing domestic energy sources + importing reliable sources of energy, free from geopolitical conflict
Play role in influencing global energy strategies (e.g. Paris Agreement with UN framework convention on climate change)
Also influence energy supply of other countries (e.g. Russia is building EPSO pipeline with view of supplying Japan + China with oil
State owned energy companies exert considerable influence on behalf of countries
What is OPEC
Organisation of Petroleum exporting countries
inter- gov organisations with 12 member countries
member countries contain 78% of worlds oil reserves + produce 45% of worlds crude oil + 18% of natural gas
Many of these countries gas/oil is their main export + vital to their economy
Aim to co-ordinate petroleum policies amongst members, to ensure fair + stable prices for producers + an efficient, economic + regular supply of to consumer nations
They set oil quotas for member countries in response to economic growth rates + supply/demand conditions
If demand rises, OPEC can increase production to prevent sharp price rise + if demand falls oil production can be reduced to maintain price
OPEC= accused of acting as cartel- aiming to monopolise the global oil + gas industry + holding back production in order to drive up prices
Is their a mismatch between oil production + consumption?
Saudi Arabia= largest exporter of oil but relatively low usage- 22.3% of world oil
Most of supply comes from Middle East- most exported to EU, SE Asia, China, Japan, USA
USA= 11th ranked in resources but demand= highest in world (largest consumer= net imports of oil)- manufacturing demand
2nd largest user= China but low supply- pop + manufacturing demand
Largest demand countries tend to have small supplies
IMBALANCE
Top 5= 60% of world oil reserves + all in middle east
Is their a mismatch between coal production + consumption?
Biggest exporters tend to be developing apart from the exceptions of Australia.
Indonesia= x2 larger than net exporter (AUS)
EU= net importer= cheaper to ger from abroad
China + India= importers- manufacturing + pop
Japan, Korea, Taiwan= lack of fossil fuels resources
IMBALANCE
Definition of energy pathways
A energy pathway is the route taken by any form of energy from its sources to its point of consumption. The routes involve different forms of transport, such as tanker ships, pipelines and electricity transmission grids
Why are energy pathways important? Example
Russia to China/Japan
The east Siberia- Pacific ocean oil pipeline (ESPO)
What is ESPO
Russian oil pipeline to transport oil from central Russia to its Pacific ocean coastline to export to Japan + into China
Advantages of ESPO for China
It needs increasing amounts of energy to fuel rapid economic growth + large pop to maintain stability of China’s community party
Existing supplies are vulnerable- run through strait of Malacca (pirates) so needs more options- widen energy supply options
China + Russia have joint political interests regarding US military presence in middle east
Advantages of ESPO for Japan
Almost no oil resources of its own
3rd largest oil consumer
Most Japan’s oil comes from Middle east (76% in early 2000s) = ESPO reduces their reliance on Middle east
Would allow Japan to engage with Russia + increase its economic + political influence
Adv + Dis for Russia of ESPO
Advantages
Less reliant on Europe for oil export income by expanding to China + Japan
Dis
Had to re-route away from Lake Baikal (UNESCO site)= increase in cost massively
Logistical, safety, environmental issue= building problematic + protection of Lake + Amur leopard habitats
Ways how energy pathways are prone to disruption
Natural disasters, terrorism, piracy, war/conflict,
How do Natural Disasters disrupt energy pathways
2005- Hurricane Katrina= affected oil production in Gulf of Mexico- result= oil + petrol prices rose and 10 days later production only at 42%
2013= storm damaged an import gas pipeline in UK, resulting in short term reduction in supply
How does terrorism disrupt energy pathways
Extremist group ‘Islamic state’ have captured oil industry in Syria= making them 1 of world’s wealthiest terror group- around $3m a day on illegal oil trade
How does piracy disrupt energy pathways
significant threat to oil tanker pathways, particularly around narrow channels
Large chokepoints around Strait of Hormuz + Strait of Malacca.
Gulf of Guinea, off coast of Nigeria= now worst area for oil tanker piracy- around ½ mill barrels a day
How does war/conflict disrupt energy pathways
Recent Russia invasion of Ukraine= considerable disruption to energy pathways
complicate situation- USA, Europe supporting Ukraine but import Russia’s oil + gas= benefiting Russia.
Attempt have been made to reduce energy pathways from Russia- EU banned all Russian coal + Oil + US + UK= all gas + oil banned
EU can’t ban Russian gas as it relies on it for around 40% of EU supply
Russia have been using this as advantage + significantly reducing gas supply in pipelines to Europe = global energy pathways altered + prices soared.
Russia’s oil exports to China + Russia have significantly increased since invasion of Ukraine = may help with their dev + China’s fight for superpower
Conventional oil + gas resources ‘definition’
Established technologies that have been used for many decades
The use of large rigs to drill for easily accessible quantities of oil or gas from within underlying rocks
Unconventional oil + gas resources ‘definition’
New technologies where the impacts may not be fully understood
The use of smaller rigs (gas) or open-cast mining (oil) to extract less accessible quantities of oil or gas trapped in thin layers between rock
Risk + uncertainty due to new tech
Floating deep oil rig= also unconventional as deeper oceans than conventional continental shelf rigs