2.2 Creating Frequency Distribution Practice
1/18
There's no tags or description
Looks like no tags are added yet.
Name | Mastery | Learn | Test | Matching | Spaced | Call with Kai |
|---|
No analytics yet
Send a link to your students to track their progress
19 Terms
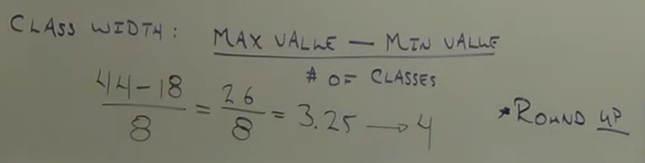
Find the class width if:
Max value = 44
Min value = 18
Number of classes = 8

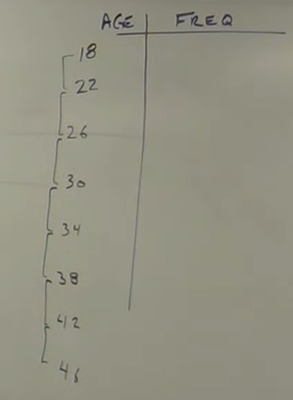
Plot lower class limits into the table if:
Range begins at = 18
Class width = 4

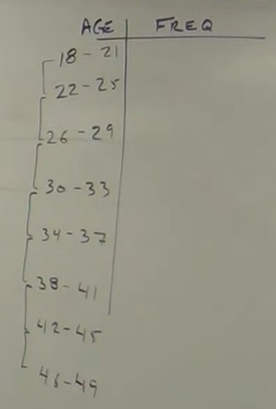
Find the intervals, plot upper class limits into the table, given the lower class limits.

What are the lower class limits? How many should there be?
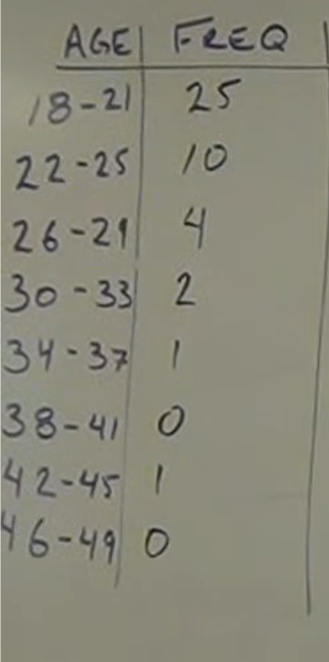
What are the lower class limits? 18, 22, 26, 30, 34, 38, 42, 46
How many class limits? 8 discrete class limits.
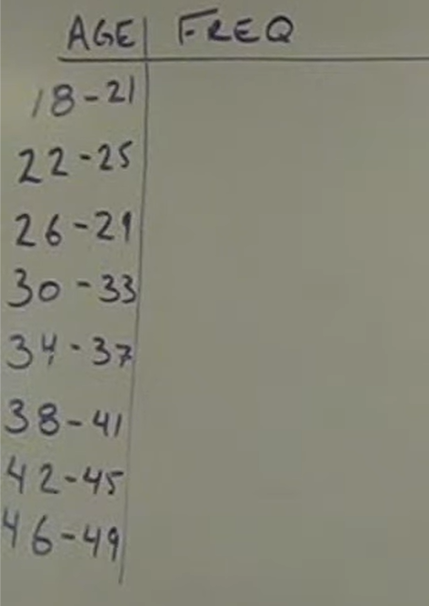
What are the upper class limits? How many should there be?
What are the lower class limits? 21, 25, 29, 33, 37, 41, 45, 49
How many class limits? 8 discrete class limits.

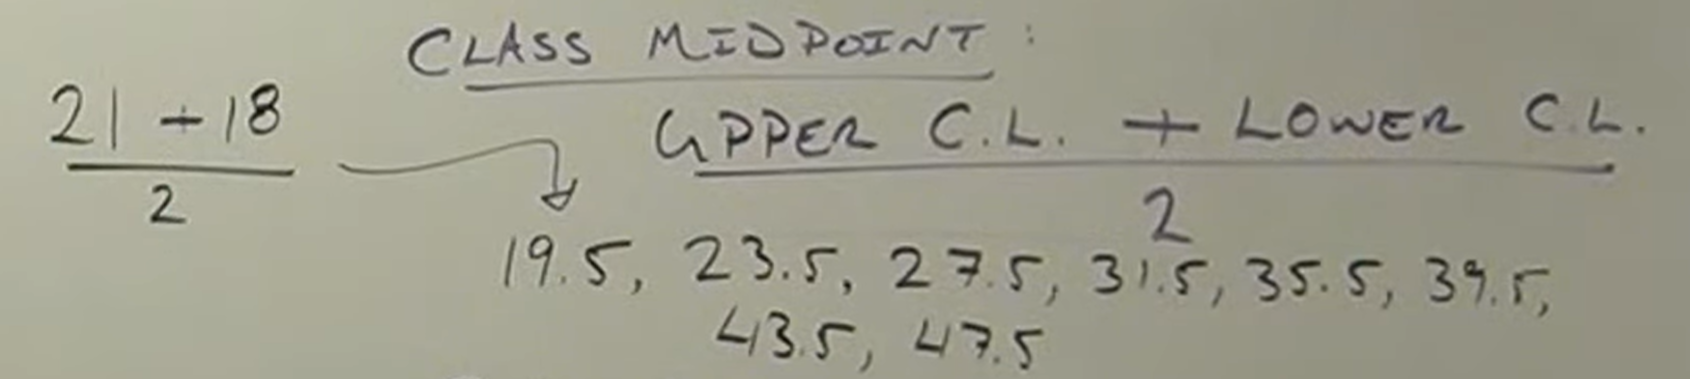
Determine the class midpoints if given the classes. What is the class width? How many midpoints should there be?
What is the class width? 4
How many class midpoints? 8 discrete class midpoints.

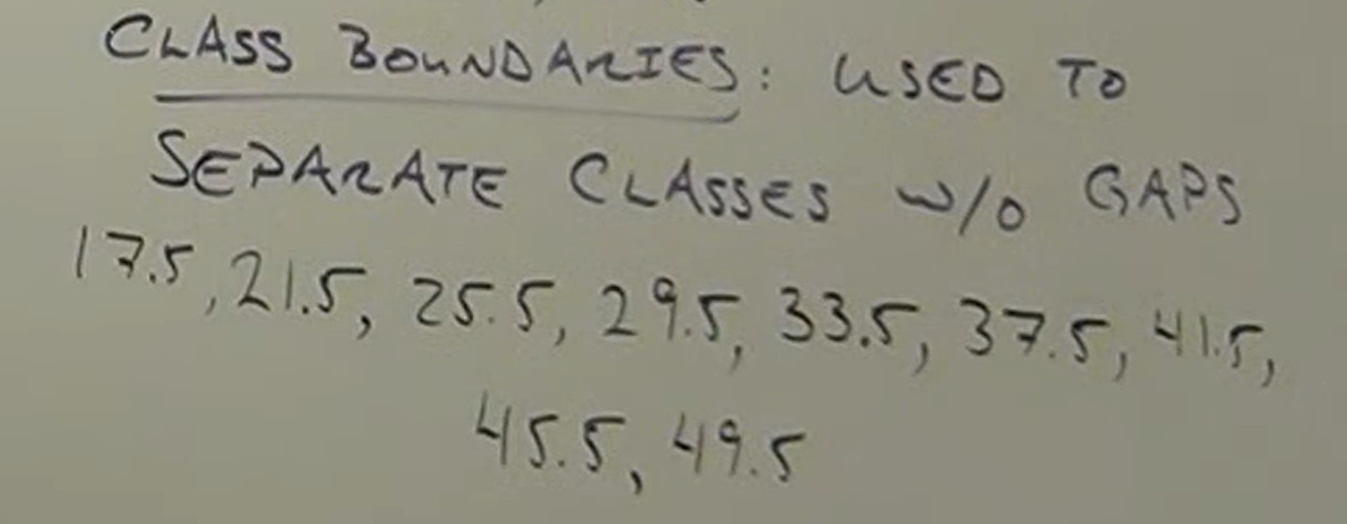
Determine the class boundaries if given the classes. What is the class width? How many class boundaries should there be?
What is the class width? 4
How many class boundaries? 9 discrete class boundaries.
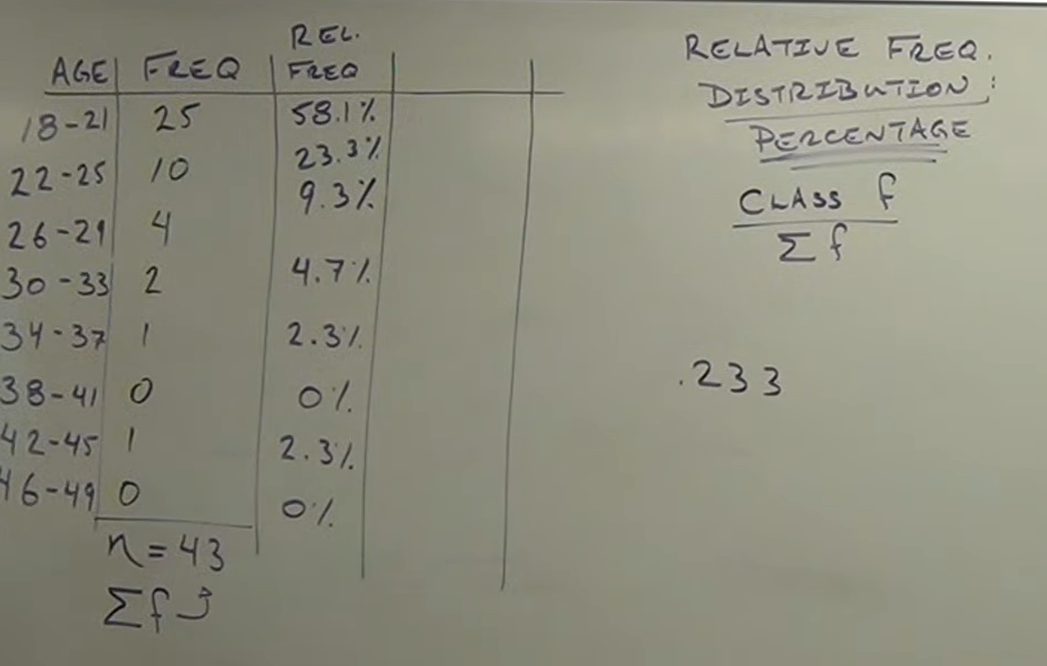
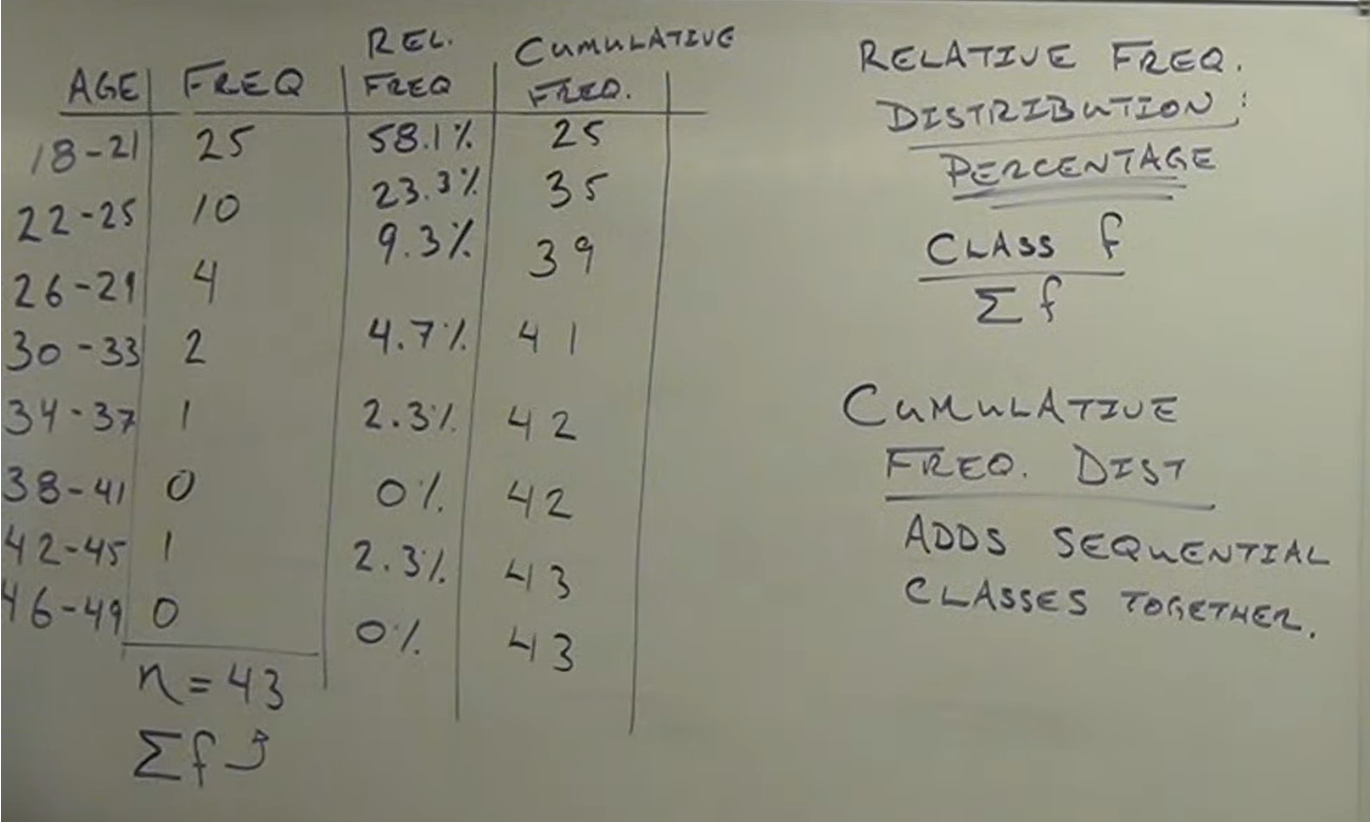
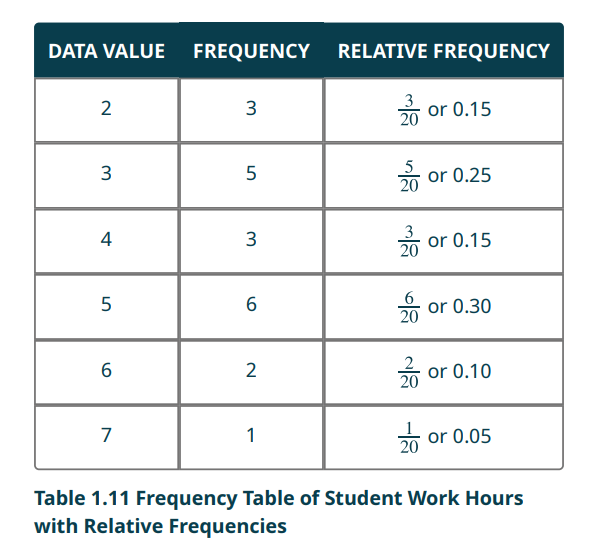
Determine the relative frequency distribution.
Total number of classes = 43
1 decimal place, always round up.
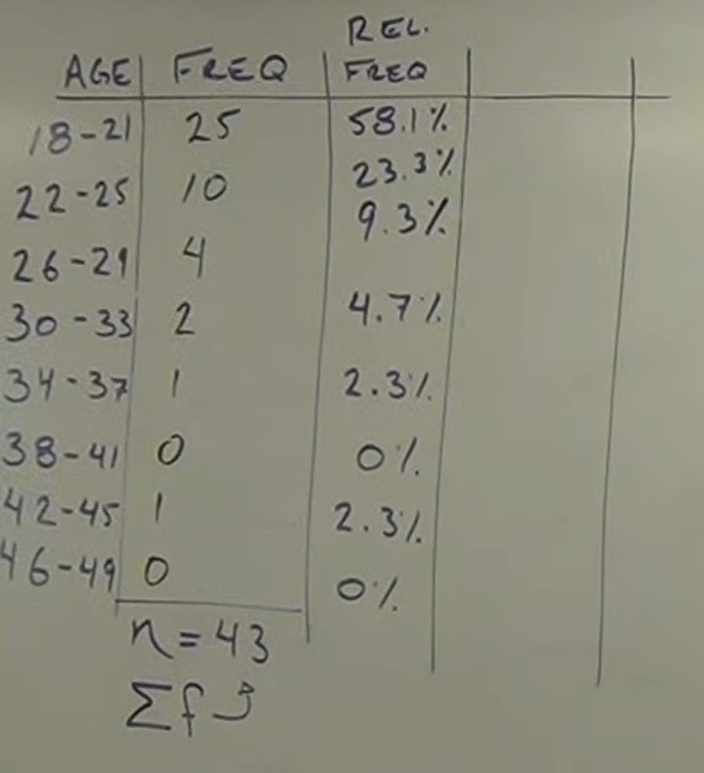
Determine the cumulative frequency distribution.


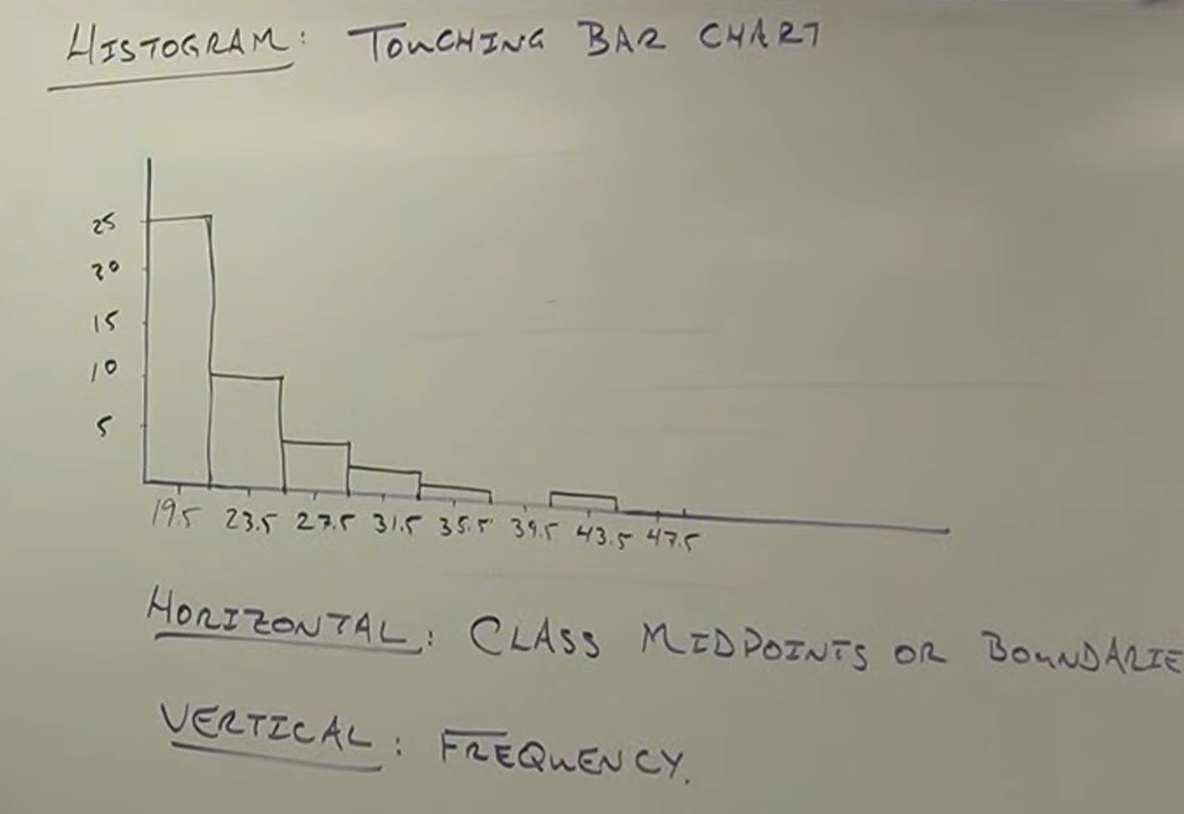
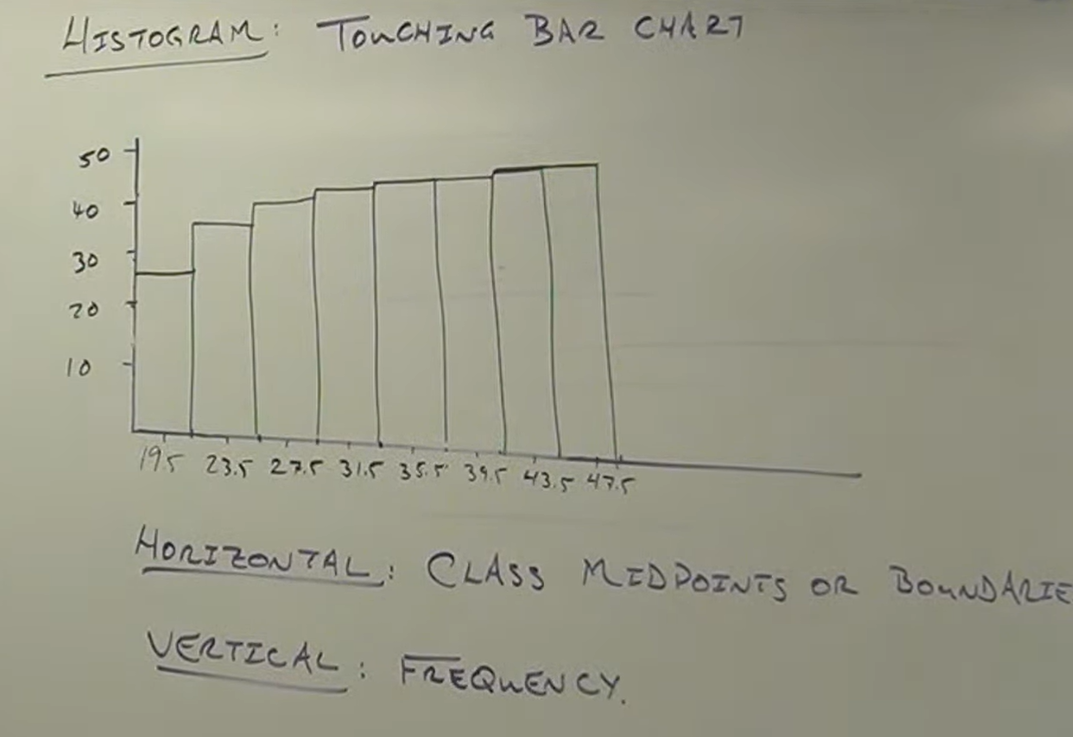
Create a histogram using this table using class boundaries and frequencies.
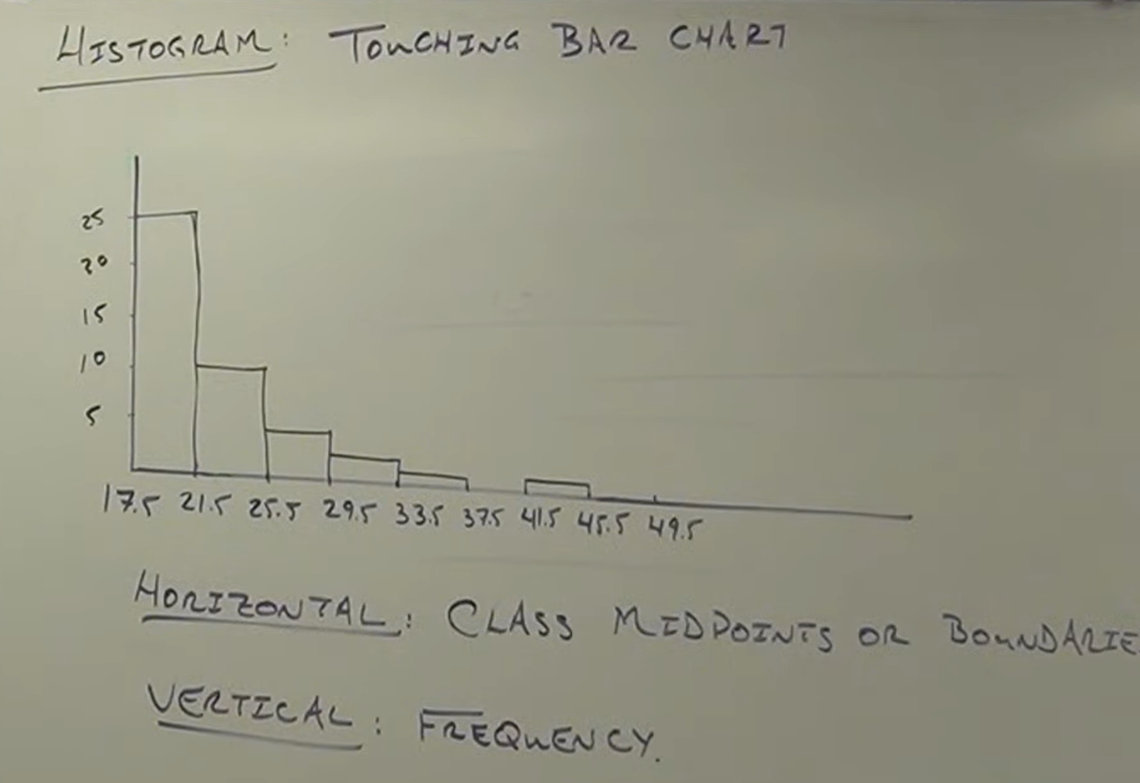

Create a histogram using this table using class midpoints and frequencies.
Create a histogram using this table using class midpoints and relative frequencies.
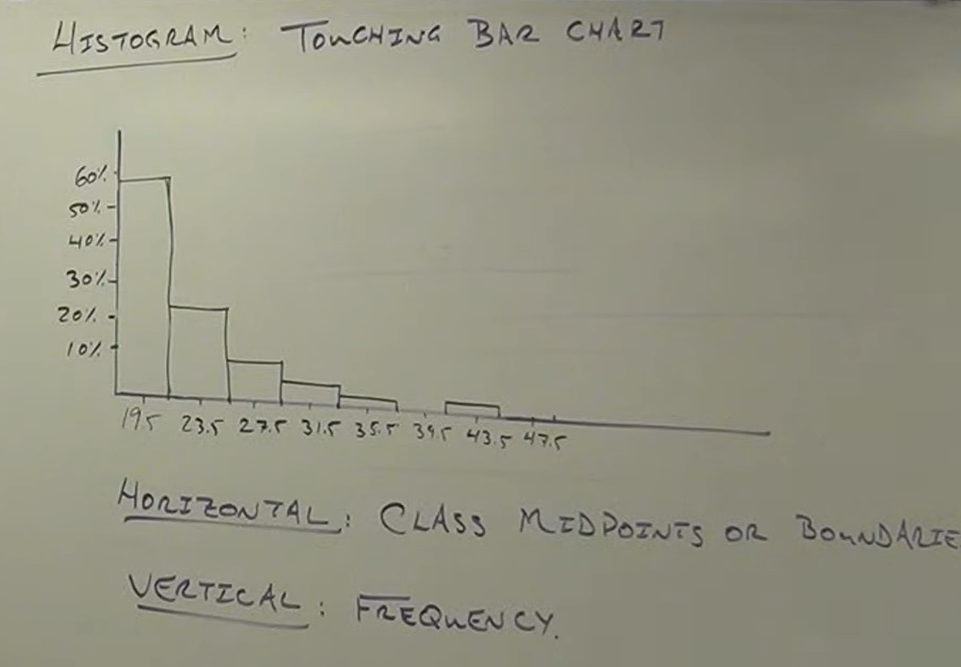

Create a histogram using this table using class midpoints and cumulative frequencies.
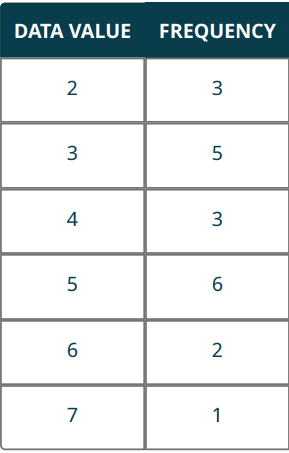
Find the relative frequency if given this table.

Find the cumulative frequency based on the relative frequency given this table.

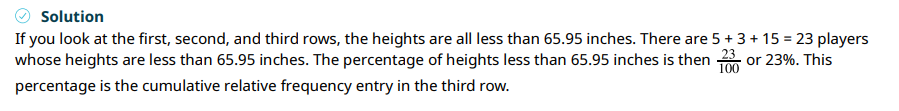
From Table 1.13, find the percentage of heights that are less than 65.95 inches.
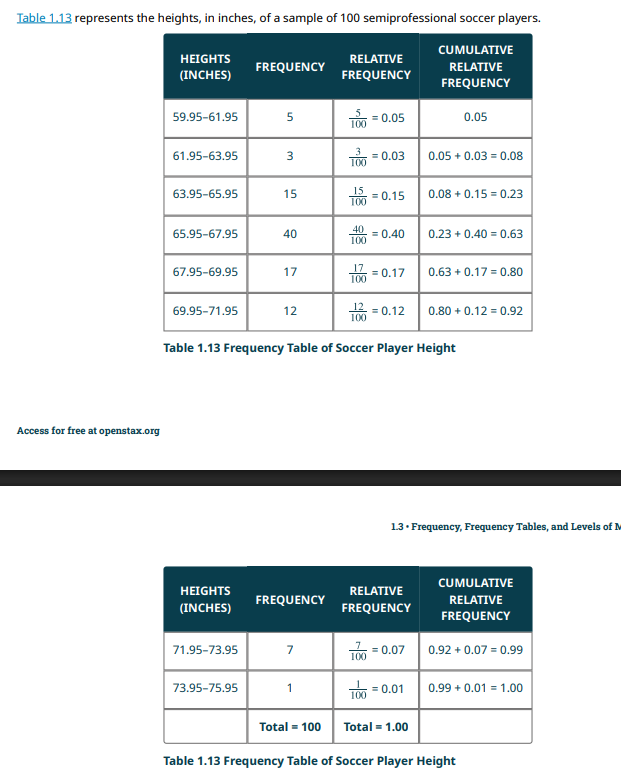
From Table 1.13, find the percentage of heights that fall between 61.95 and 65.95 inches.
Solution: Add the relative frequencies in the second and third rows: 0.03 + 0.15 = 0.18 or 18%.

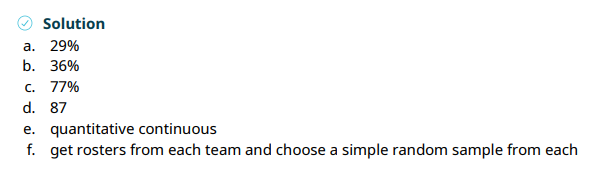
Use the heights of the 100 semiprofessional soccer players in Table 1.13. Fill in the blanks and check your answers.
a. The percentage of heights that are from 67.95 to 71.95 inches is: ____.
b. The percentage of heights that are from 67.95 to 73.95 inches is: ____.
c. The percentage of heights that are more than 65.95 inches is: ____.
d. The number of players in the sample who are between 61.95 and 71.95 inches tall is: ____.
e. What kind of data are the heights?
f. Describe how you could gather this data (the heights) so that the data are characteristic of all semiprofessional soccer players.
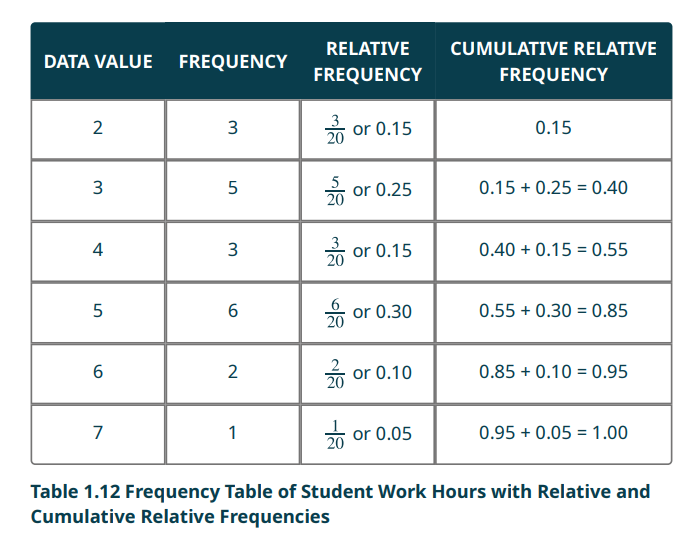
Remember, you count frequencies. To find the relative frequency, divide the frequency by the total number of data values. To find the cumulative relative frequency, add all of the previous relative frequencies to the relative frequency for the current row.
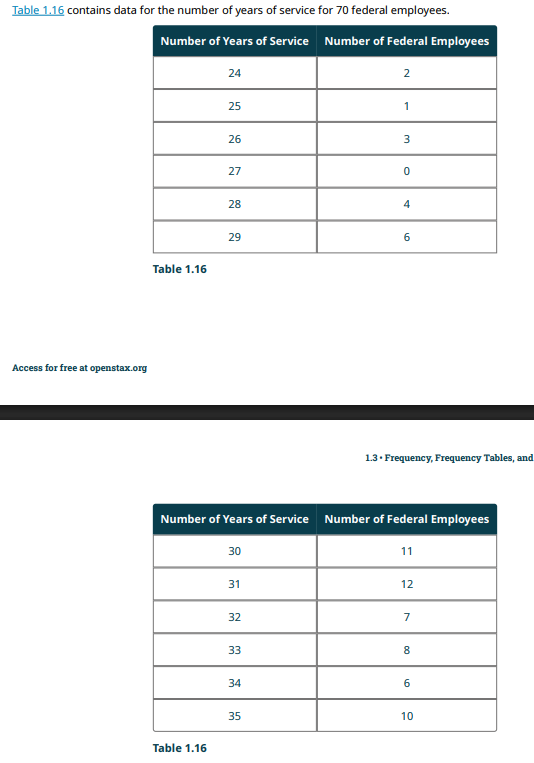
Answer the following questions.
a. What is the cumulative frequency for years of service between 30 and 35 (inclusive)?
b. What is the relative frequency for 30 years of service?
c. What is the relative frequency for 30 years of service or less?
d. What is the relative frequency for 25 years of service or more?
a. Cumulative frequency is 54.
b. 11/70 or 0.157 or 15.7%
c. 27/70 or 0.386 or 38.6%
d. 68/70 or 0.971 or 97.1%