Theme 3A - Market failure ugh
1/24
Earn XP
Description and Tags
AE + Externalities
Name | Mastery | Learn | Test | Matching | Spaced | Call with Kai |
|---|
No analytics yet
Send a link to your students to track their progress
25 Terms
State when AE is achieved
Marginal Social Benefits (MSB) = Marginal Social Costs (MSC)
Sum of consumer and producer surplus is maximised
Define price mechanism
Interaction of market demand (reflecting consumers’ decisions) and market supply (reflecting producers’ decisions) which determines the price to be charged and output to be produced for different goods and services.
Describe the incentive + signalling role of prices
Consumer sovereignty: consumers determine which goods and services are produced by firms by signalling to producers the goods they are willing and able to pay for
Consumers ‘vote’ for what they want firms to produce through purchases.
Through the use of ‘dollar votes’, consumers decide ‘what to produce’
Firms respond by producing only those goods using scarce resources
Consumers also determine ‘how much to produce’ by signalling to producers their preference for a particular good through the price they are willing and able to pay for it
High preference, higher price
For example:
When income increase, demand for car increase -> upward pressure on price and price increase -> higher price signaled to producers there is shortage and incentive profit-motivated producers to increase Qs
The higher price is a signal and incentive for consumers as it signals cars are now more expensive, reduce Qd
Profit-maximising producers are incentivised to produce using the least-cost factor combination in their production process (Eg. When supply of labour increases, wages for workers decrease and signal and incentivise firms to hire more workers)
Describe the incentive role of prices
Incentive |
| How to produce? *Firms want to maximise profits, NOT TR |
Describe the rationing role of prices
Solve problem of ‘for whom to produce’
As price of cars increase, some consumers realise they are unwilling or unable to pay the price
Consumers with fewer dollar votes will decrease consumption -> Qd falls
This continues until shortage is eliminated
Function ensures that limited cars produced using limited resources are rationed out only to those who are most willing and able to pay for it
Society’s welfare is maximised under what assumptions
Private good market
Absence of externalities
Perfectly competitive markets (perfect information, perfect factor mobility, no market power)
NO market failure -> shortage or surplus is temporary and can be cleared overtime
Explain how consumers allocate resources in a free market
Demand curve = maximum price that consumers are willing and able to pay for various quantities of the good
In the pursuit of self-interest, a rational consumer will seek to maximise the net total private benefit from buying and consuming a good/service given his limited income.
He will buy an additional unit of a good as long as the marginal private benefit (MPB) of consuming it exceeds its marginal private cost (MPC).
The MPB is the additional utility/satisfaction derived from consuming an additional unit of the good
The MPC is the additional cost of consuming one more unit of the good, which is equivalent to the price consumers pay for the good
Maximum price that a consumer would be willing to pay for one more unit of a good = marginal utility that he derives from consuming that additional unit
Demand curve = MPB curve for consumers
Explain how producers allocate resources in a free market
Supply curve = minimum price that producers are willing and able to accept for various quantities of the good
In the pursuit of self-interest, a rational producer seeks to maximise the total profits from producing and selling a good/service
He will be willing to sell an additional unit of a good as long as the marginal private benefit (MPB) of producing it exceeds its marginal private cost (MPC)
The MPB is the additional revenue derived from selling an additional unit of the good (marginal revenue) = price consumers pay for the good in a perfectly competitive market
The MPC is the additional cost of producing one more unit of the good (MCOP)
Minimum price that a producer would be willing to accept to produce one more unit of a good = marginal cost that he incurs from producing that additional unit
Supply curve = MPC curve for producers
What happens if market output is less than Qe
For units Q1 to Qe, MSB is greater than the MSC
For every additional unit of output from Q1 to Qe, the additional benefit to society is greater than the additional cost incurred.
TSB = area beQeQ1, TSC = area ceQeQ1
There will be a net increase in society’s welfare of area bec that could be gained if society is to produce and consume Q1 to Qe units.
Any market output less than Qe, society’s welfare is not maximised due to under-production/consumption -> not allocatively efficient

Explain what happens when market output is more than Qe
For units Qe to Q2, the MSC is greater than MSB.
TSB = area eyQ2Qe, TSC = area exQ2 Qe
There is a net loss in society’s welfare of area exy that is incurred
Any markey output more than Qe, society’s welfare is not maximised due to over-production/consumption -> not allocatively efficient
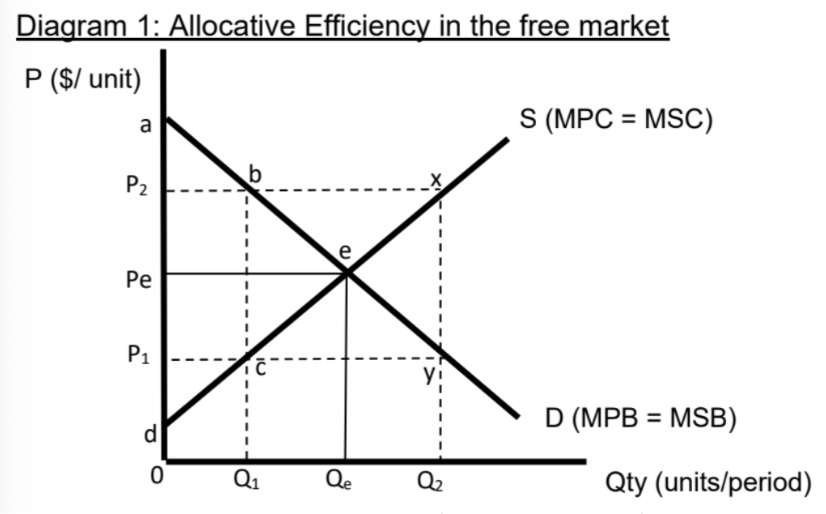
Explain AE using CS and PS
At Qe, the sum of consumer surplus and producer surplus is maximised -> society’s welfare is maximized and allocative efficiency is achieved
State when market failure occurs
Occurs when free markets, operating without any government intervention, fail to allocate scarce resources efficiently and hence society’s welfare is not maximised
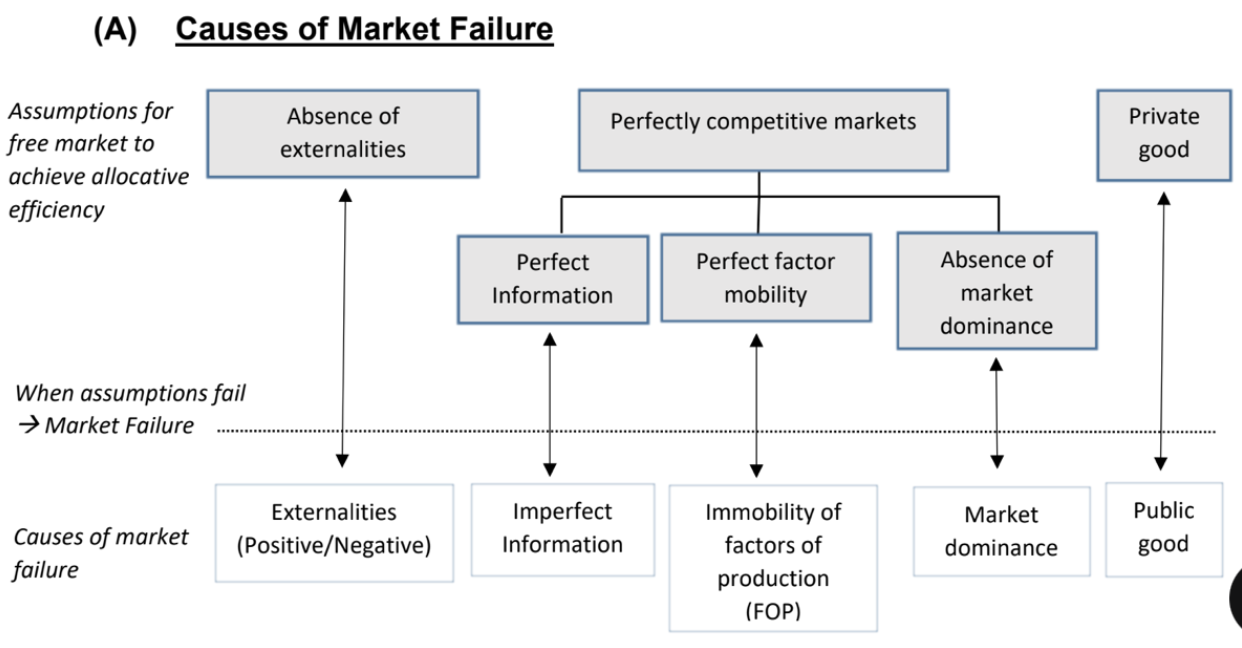
State the causes of market failure
NOTE:
There is underconsumption due to individual consumers disregarding the external benefits generated by education, not because of the lack of awareness of these external benefits
Define externalities
Refers to a positive or negative impact on a third party not directly involved in the consumption or production of a good or service, may be generated from the consumption or production of a good or service
Describe positive externality
Positive externality |
Beneficial impact on a third party not directly involved in the economic transaction |
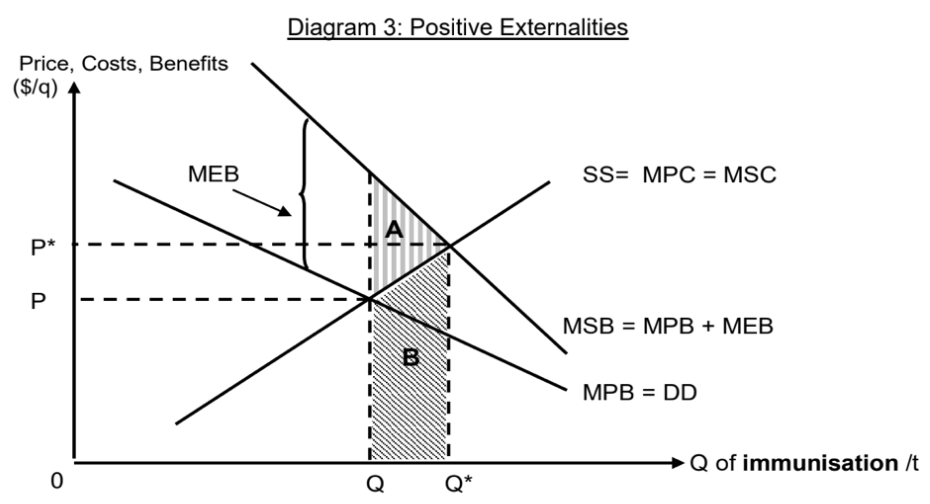
Total social benefit = Total private benefit + Total external benefit Marginal social benefit (MSB) = Marginal private benefit (MPB) + Marginal external benefit (MEB)
|
Describe negative externality
Negative externality |
Adverse impact on a third party not directly involved in the economic transaction |
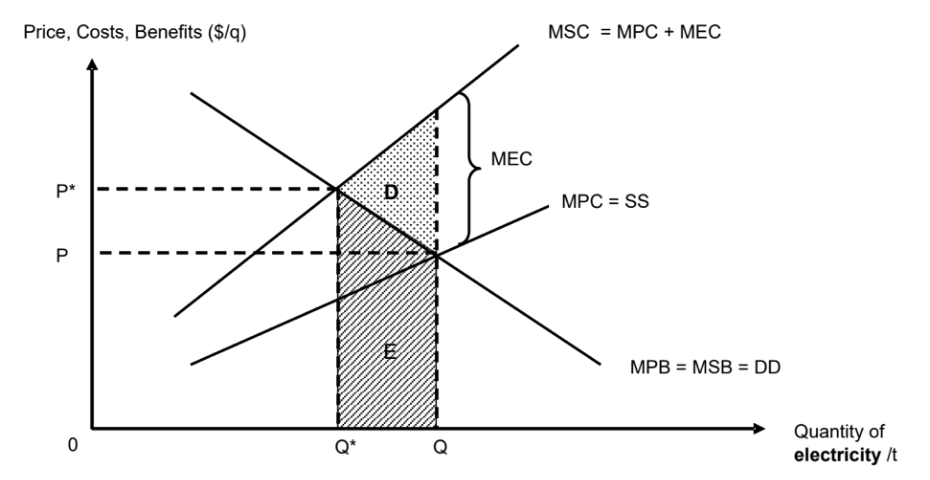
Total social cost = Total private cost + Total external cost Marginal social cost (MSC) = Marginal private cost (MPC) + Marginal external cost (MEC)
|
Describe the effects of positive externalities
Marginal social benefits greater than marginal private benefits, by the amount of the marginal external benefits
Underproduction / underconsumption of goods in the market result in the under-allocation of resources -> leads to welfare loss to society -> free market has failed to achieve allocative efficiency
State some examples of positive externalities from consumption and production
From consumption | From production |
|
|
Explain how positive externality leads to market failure (Eg. Immunisation)
Describe problem |
|
Explain market outcome |
Impt part:
|
Explain socially optimal outcome |
|
Explain welfare loss and allocative inefficiency | Therefore, the free market has failed to achieve allocative efficiency as society’s welfare is not maximised |
Draw graph of how positive externality leads to market failure (Eg. Immunisation)
Describe the effects of negative externalities
Social costs being greater than private costs, by the amount of the external costs.
Overproduction and overconsumption of goods in the market result in the over-allocation of resources -> welfare loss to society -> free market has failed to achieve allocative efficiency
State some examples of negative externalities from consumption and production
From consumption | From production |
|
|
Explain how negative externality leads to market failure (Eg. Coal-fired electricity generation)
Describe problem |
|
Explain market outcome |
Impt part:
|
Explain socially optimal outcome |
|
Explain welfare loss and allocative inefficiency |
|
Draw graph to explain how negative externality leads to market failure (Eg. Coal-fired electricity generation)