Math 200 Midterm
1/45
There's no tags or description
Looks like no tags are added yet.
Name | Mastery | Learn | Test | Matching | Spaced |
|---|
No study sessions yet.
46 Terms
Systematic Sample
Sample members from a large population are selected according to random starting point but with fixed periodic interval
Simple Random Sample
A subset of a statistical population in which each member has an equal probability of being chosen
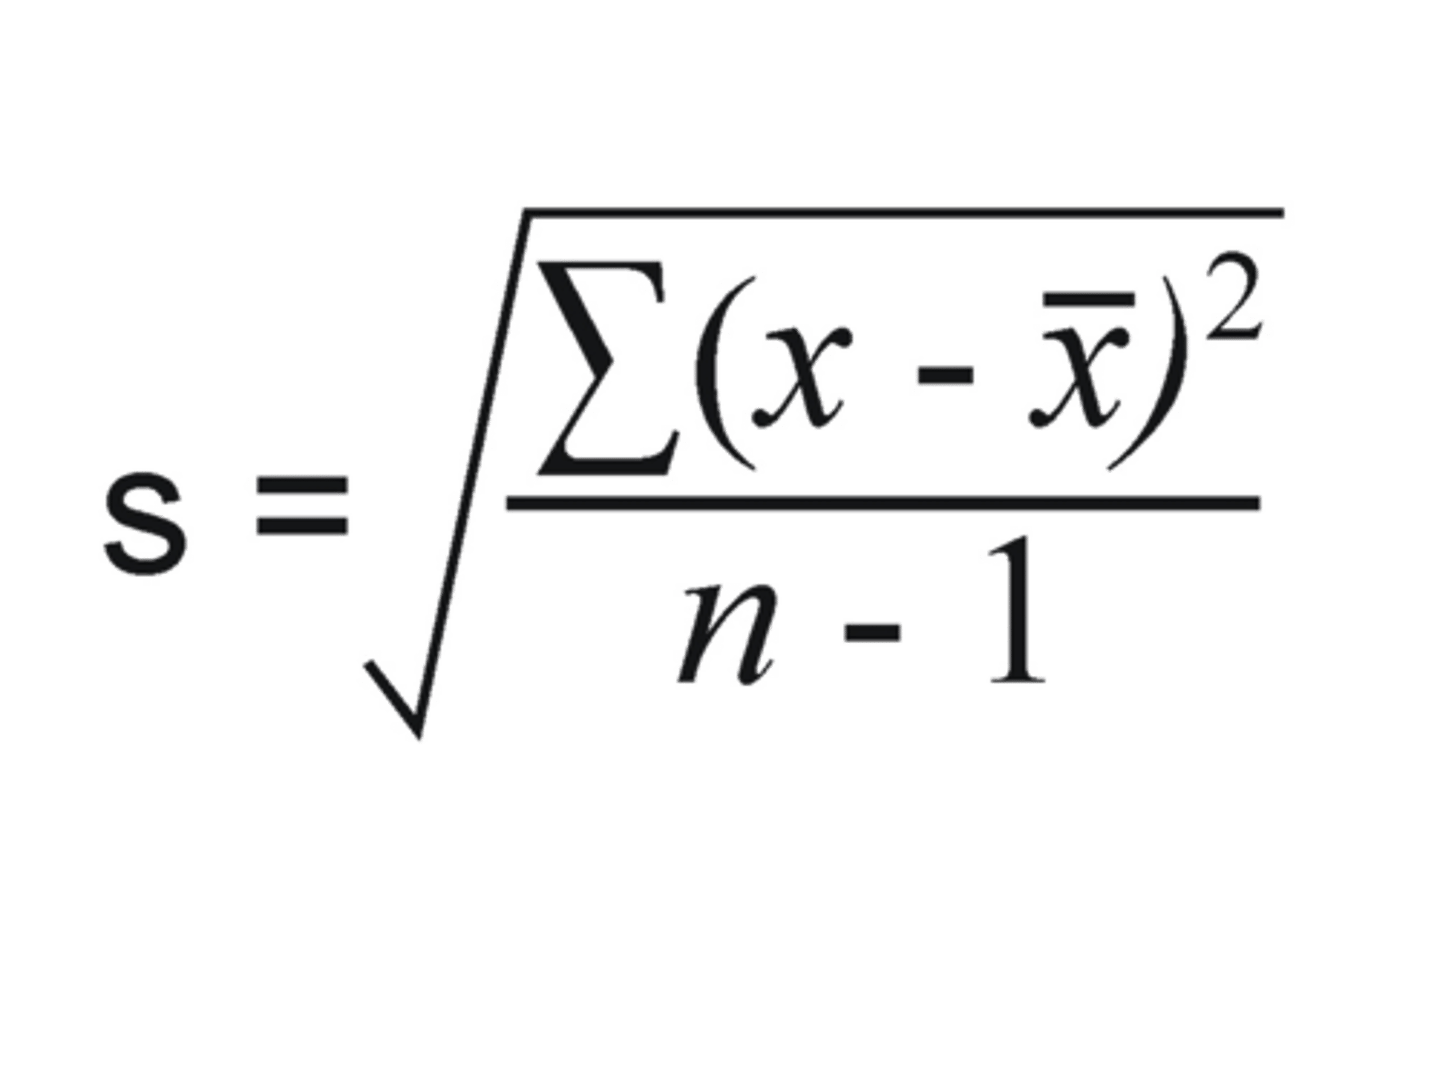
How do you find the standard deviation of a probability distribution
Square root of the sum of x minus the mean squared divided by n minus 1
What sampling methods do you know?
Stratefied Sample, Cluster Sample, Random Sample, Simple Random Sample, Systematic Sample
What types of data can you collect?
Categorial(qualitative), Numerical(quantitative), Continuous, Discrete
Categorical
Qualitative
Numerical
Quantitative
Continuous
You can't list up; Area=probability
Discrete
Binomial distribution
How can you measure the center of the distribution?
Mean, Median, Mode, Midrange
Median
M=P50 (can resist outlier)
Mode
Center by frequency
Midrange
Xmax+Xmin divided by 2
How can you measure the variation(Spread)?
Range, Standard Deviation, Variance
Range
Xmax-Xmin
Variance
Before square root of standard deviation (same as standard deviation but squared
Normal Distribution
Mean is 0 and Standard Deviation is 1
What does it mean by 2 events are independent?
No affect on one another
How do you find the mean of a probability distribution?
X(bar) = Sum of X divided by N
Do you know how to count systematically?
5!, 25C5, 25P5
Mean
Sample = x, Population = u (Sum(x) divided by sample size)9affected by an outlier)
Standard Deviation
Sample= S, Population = squiggly
How can you measure the relative standing within the distribution?
Z Score, Percentile, Box-Plot = 5 number summary
What fact do you know about probability?
In between 0 and 1, Sum is 1, P(A) + P(complementA) = 1
What does it mean by 2 events are disjoint?
P(AnB) = 0
P(AnB)
P(A given B)
P(AuB)
P(A) + P(B)
What kind of probability do you remember?
P(A), P(AuB), P(AnB), P(A/B)
In order to find probability, we need:
Experiment outcomes
Empirical Rule
68, 95, 99.7
How do you describe distribution?
Center, Variation, Gap, Outlier
Probability histogram is the probability bar graph for ------- variable.
Discrete
Binomial Mean:
u = NP
Binomial Standard deviation:
Square root of NPQ
What determines the binomial distribution?
n and p
Random Sample
Selection is based on chance and everyone has a non zero probability of being selected
Cluster Sample
Researcher divides the population into separate groups and a sample of clusters is selected
Stratefied Sample
Researcher divides the population into separate groups and a sample is drawn from each group
Combination
Order does not matter, n!/r!(n-r)
Permutation
order matters
n!/(n-r)!
Continuous Variable
Obtained by measuring
Discrete Variable
Obtained by counting
What is the standard normal distribution?
mean of 0 and standard deviation of 1
What determines the normal distribution
Mean and standard deviation
What is the binomial experiment?
N is finite, P stays the same, only 2 outcomes, each trial is independent
What is X in a pay off table?
Random Variable