Economics- macro
1/350
There's no tags or description
Looks like no tags are added yet.
Name | Mastery | Learn | Test | Matching | Spaced | Call with Kai |
|---|
No analytics yet
Send a link to your students to track their progress
351 Terms
Economic growth
The growth in the value of a country measured by GDP
GDP (Gross Domestic Product)
the total value of all the goods and services produced by a country in one year
What is GDP a measure of?
The wealth of an economy
What happens if the value of goods/services increase?
Incomes will increase
How to calculate GDP
Rate of growth = change in GDP/original GDP x 100
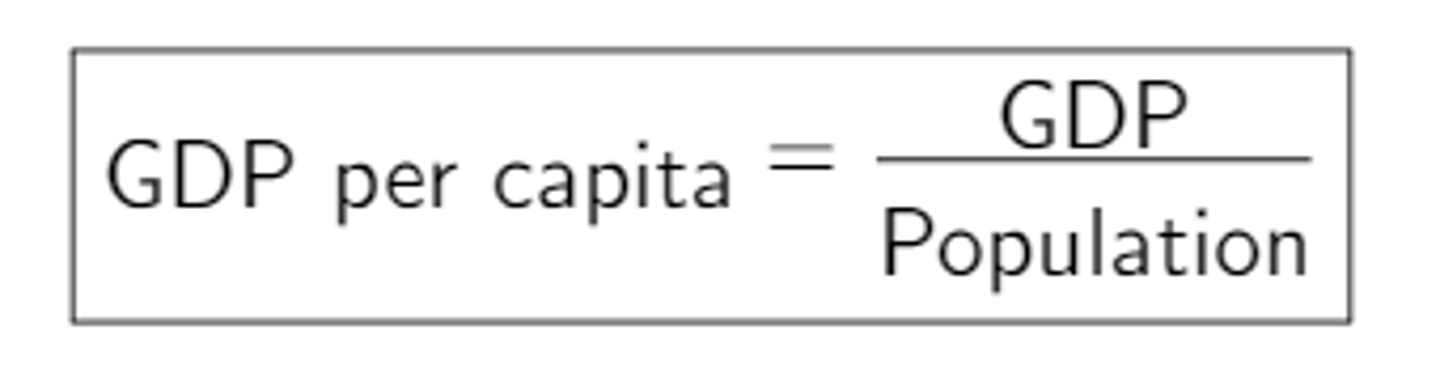
How do you calculate GDP per capita?
GDP divided by population.
What is GDP per capita a measure of?
A measure of the average income of each person in the country
Standard of living
The degree of wealth and material comfort available to people
Calculating GDP per capita
GDP/population
Recession
A period where the country's GDP falls for two or more consecutive quarters
What is a boom in an economy?
A period of high economic activity and high levels of employment
What is a slump in an economy?
A period of drastic economic decline (the lowest point of a recession)
Recovery
A rise in economic growth after a recession.
What are the 7 determinants of economic growth?
(determinants change the quality/quantity of the FoP- CELL)
Investment
Changes in technology
Education and training
Labour productivity
Size of workforce
Natural resources
Government policies
Investment
Buying more capital goods such as machinery and premises allows more production
Changes in technology
improved technology means improved quality of goods and increased production of goods/ services
Education and training
better quality and quantity of work
Labour productivity
(ontput per worker) higher productivity allows for economic growth. It requires investment, technology and education
Size of workforce
the more people there are, the more labour. This can also grow due to immigration.
Natural resources
If a country has resources such as oil, this can increase production and growth
Government policies
spending on infrastructure (roads, rails) will improve economic growth.
What are the 4 benefits of economic growth?
1) A rise in the standard of living
2) Reduction in poverty
3) Rise in welfare of population
4) Fall in unemployment
A rise in the standard of living
more output available to buy and more income to spend.
Reduction in poverty
government earn more tax from workers and businesses and can ensure living standards of those on benefits are improved
How can a budget deficit lead to the rise in welfare of the population?
Better heath, education, quality of life. Government increase spending on heathcare and education. A more educated population leads to further econcmic growth.
The results in a fall in unemployment (3)
Rise in number of people with jobs
less claiming benefits
and more paying tax
What are the 7 costs of economic growth?
1) Environmental
2) Global warming
3) Congestion/overcrowding
4) Loss of non-renewables
5) Lower quality of life
6) Inequalities of income and wealth
7) Inflation
Environmental
Damage to land
Air and noise pollution
Global warming
E.g. rising sea levels leading to flooding
Congestion and overcrowding
Lowers quality of life.
Longer waiting times for NHS, less choice for schools.
Loss of non-renewables
e.g. oil, natural gas, damage to natural environment e.g rainforests
Lowers quality of life
Longer working hours, repetitive jobs, less exercise
Inequalities of income and wealth
gap between rich and poor widens
Inflation
Increase in prices due to higher demand
Employment
The use of labour in the economy to produce goods and services
Unemployment
When people of working age are both able and willing to work at the current wage rates but cannot find employment
What are unemployed people apart of?
The labour force that are not currently in work
Pensioners, students and those who stay at home to look after children are...
inactive NOT unemployed
Why is low unemployment an economic objective?
-People who work are paid wages which they can then spend in the economy, increasing demand and therefore output (increasing GDP)
-The employed also pay tax to the government
-Those who are unemployed don't pay tax, don't have as much income to spend, and may be paid benefits by the government
How is unemployment measured?
Claimant count
Claimant count
A way of measuring unemployment according to the number of people who are claiming unemployment-related benefits
Level of unemployment
The number of people in the working population who are unemployed.
Rate of unemployment
The percentage of the country's workforce that is unemployed
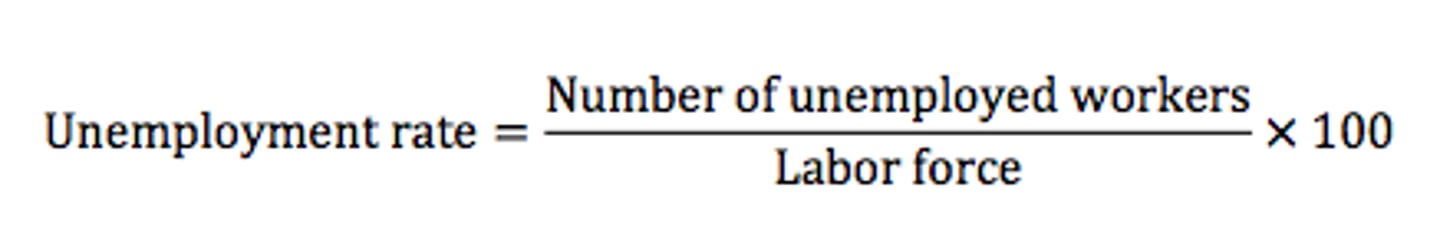
How to calculate unemployment rate
number of unemployed/ workforce x 100
What are the 4 types of unemployment?
frictional, structural, cyclical, seasonal
Seasonal unemployment
When seasonal workers are not employed out of season
Frictional unemployment
Workers leave their job but do not start their new job straight away (short term)
Structural unemployment
When there's a decline in an industry, so demand for products fall (long term)
Cyclical unemployment
Fall in total (aggregate) demand in the economy.
What does cyclical unemployment lead to?
Leads to fewer workers required to produce goods.
Unemployed people have less income to spend on goods, therefore lower demand for goods and increased unemployment
Costs of unemployment for workers/individuals
Lower living standards
Loss of status and low self esteem
Excluded workers
Costs to taxpayers
What can lower living standards lead to for workers?
Workers lose their jobs and therefore their income
Excluded workers
Can't get a job as they've been out of work for too long
Costs to taxpayers
Taxes are used to pay benefits
Costs of unemployment for the government
Labour resources are wasted
Unemployment leads to more unemployment
Budget deficit
Labour resources are wasted
The economy isn't producing as many goods/services as it can
Budget deficit
The government spends more than it receives
Costs of unemployment for regions
Unemployment leads to some areas of the country to go into decline
They become 'depressed areas'
Property values decline and the area may become crime ridden
The benefits of unemployment
Frictional unemployment occurs because of changes in types of jobs required, expanding the skills of workers in various fields
Wages stay low which benefits businesses and gives them more choice of workers
Low wages lower costs for a business and increases competition which benefits consumers
How does unemployment impact the supply curve?
Supply of Labour increases from S to S1, Wages decrease from W-W1 and quantity of workers supplied increase from Q-Q1
Distribution of income
How the total income of the economy is shared out among people
Inequality of income
Some people have high incomes, some people have low incomes
What are the 5 types of income?
-Wages
-Profit
-Rent
-Interest
-State benefits
Where do you get wages from
jobs
who earns a profit?
business owners
where do you earn interest?
from savings in the bank
how do you earn money from rent?
if you have a property to rent out
Examples of state benefits
-Pensions
-Unemployment benefit
-Job seekers allowance
Income
The flow of money over time.
(e.g wages from hourly work, monthly salary, interest on savings or rent from a property)
Wealth
The value of stocks, assets and material possessions at a certain point in time.
Income vs wealth
Income is how much one earns, wealth is how much one owns such as houses, cars, personal belongings
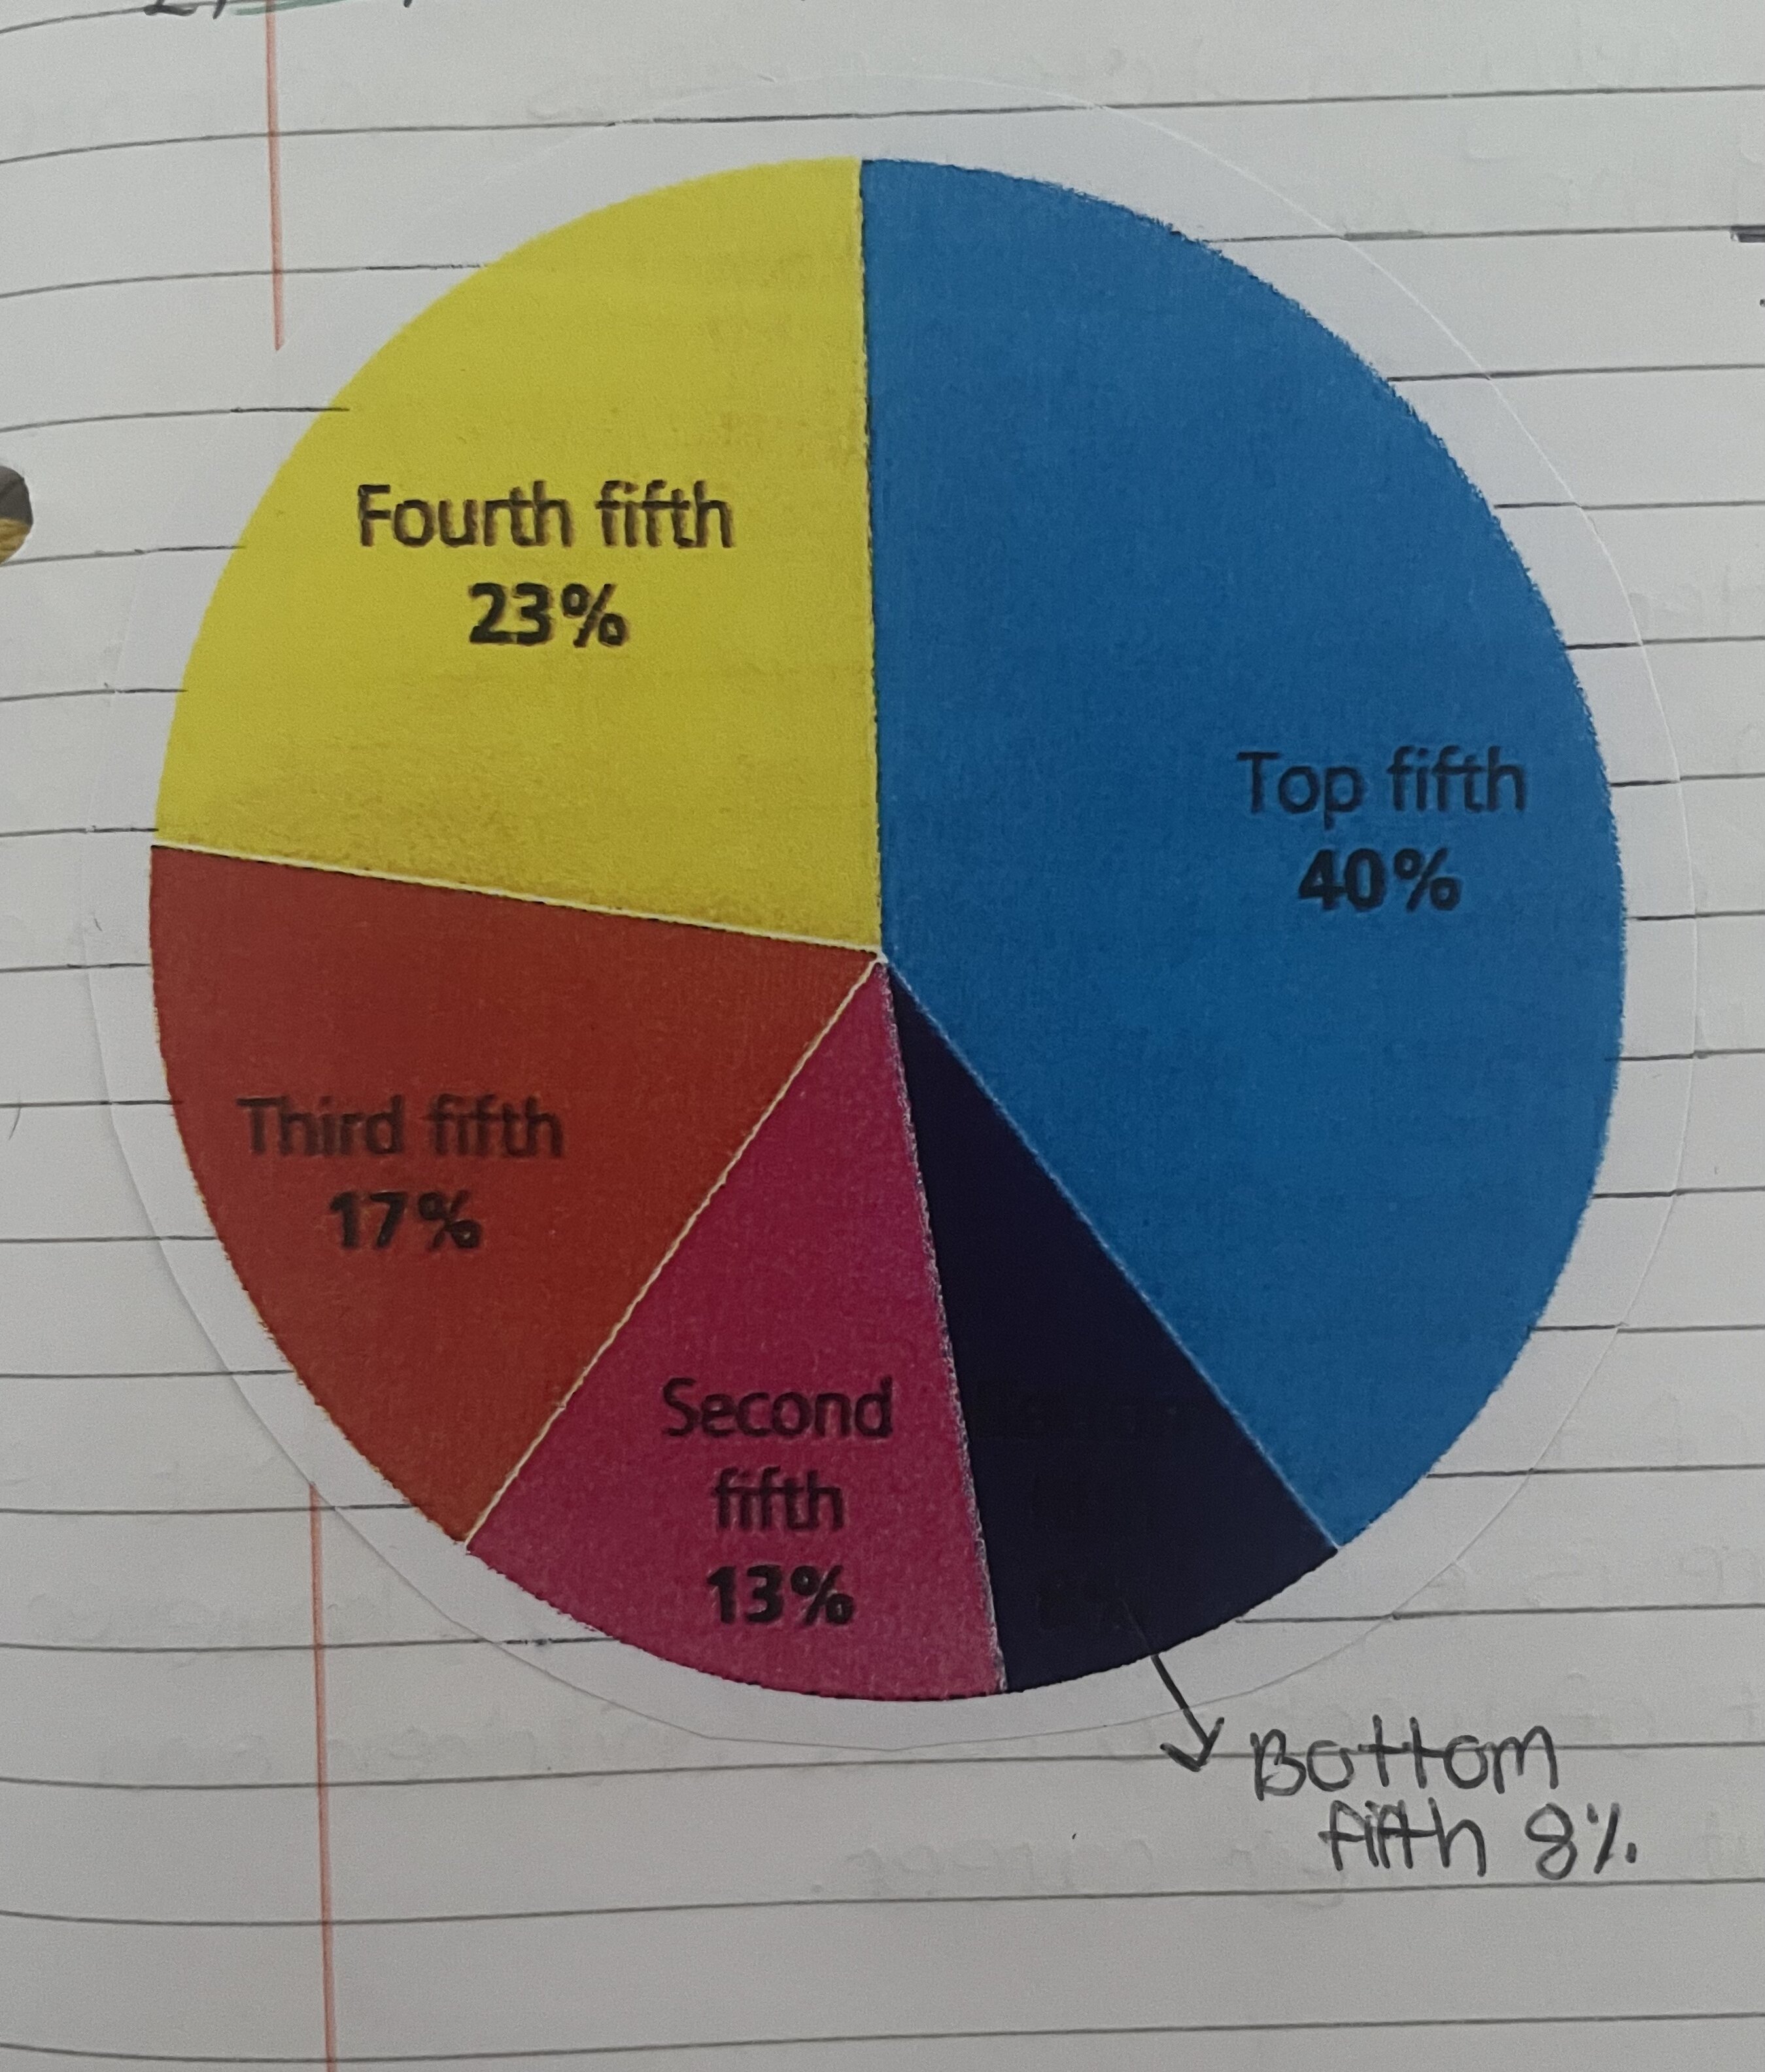
Unequal distribution of income
In the UK, the average gross income of the richest 10% is our 27 times higher than that of the poorest 10%.
What are 5 reasons why income is unevenly distributed?
1) Income earning assets are distributed unevenly
2) Difference in wages
3) Reliance on benefits
4) Age
5) Gender
Income earning assets are distributed unevenly
There are different ways to earn income but not all people can an income through these ways. Assets such as property, money in the bank and company shares generate rent, interest and income. More assets = higher income
Difference in wages
Most people in the UK sell their labour for wages. Different jobs pay different wages. High labour demand and low labour supply = higher wages. Some people in the UK are paid the national minumum wage
Reliance on benefits
Some people receive no income. These are the poorest households and they rely on state benefits which are generally lower than the average wage
Age
The younger and older age groups have lower average incomes than those in the middle. Young people have not had time to gain experience and older groups have often retired from working
Gender
The average income of females is lower than that of males. In the UK, there is equal pay by law, however women often come out of work to raise children and therefore take time out of their career.
How wealth is shared in the UK
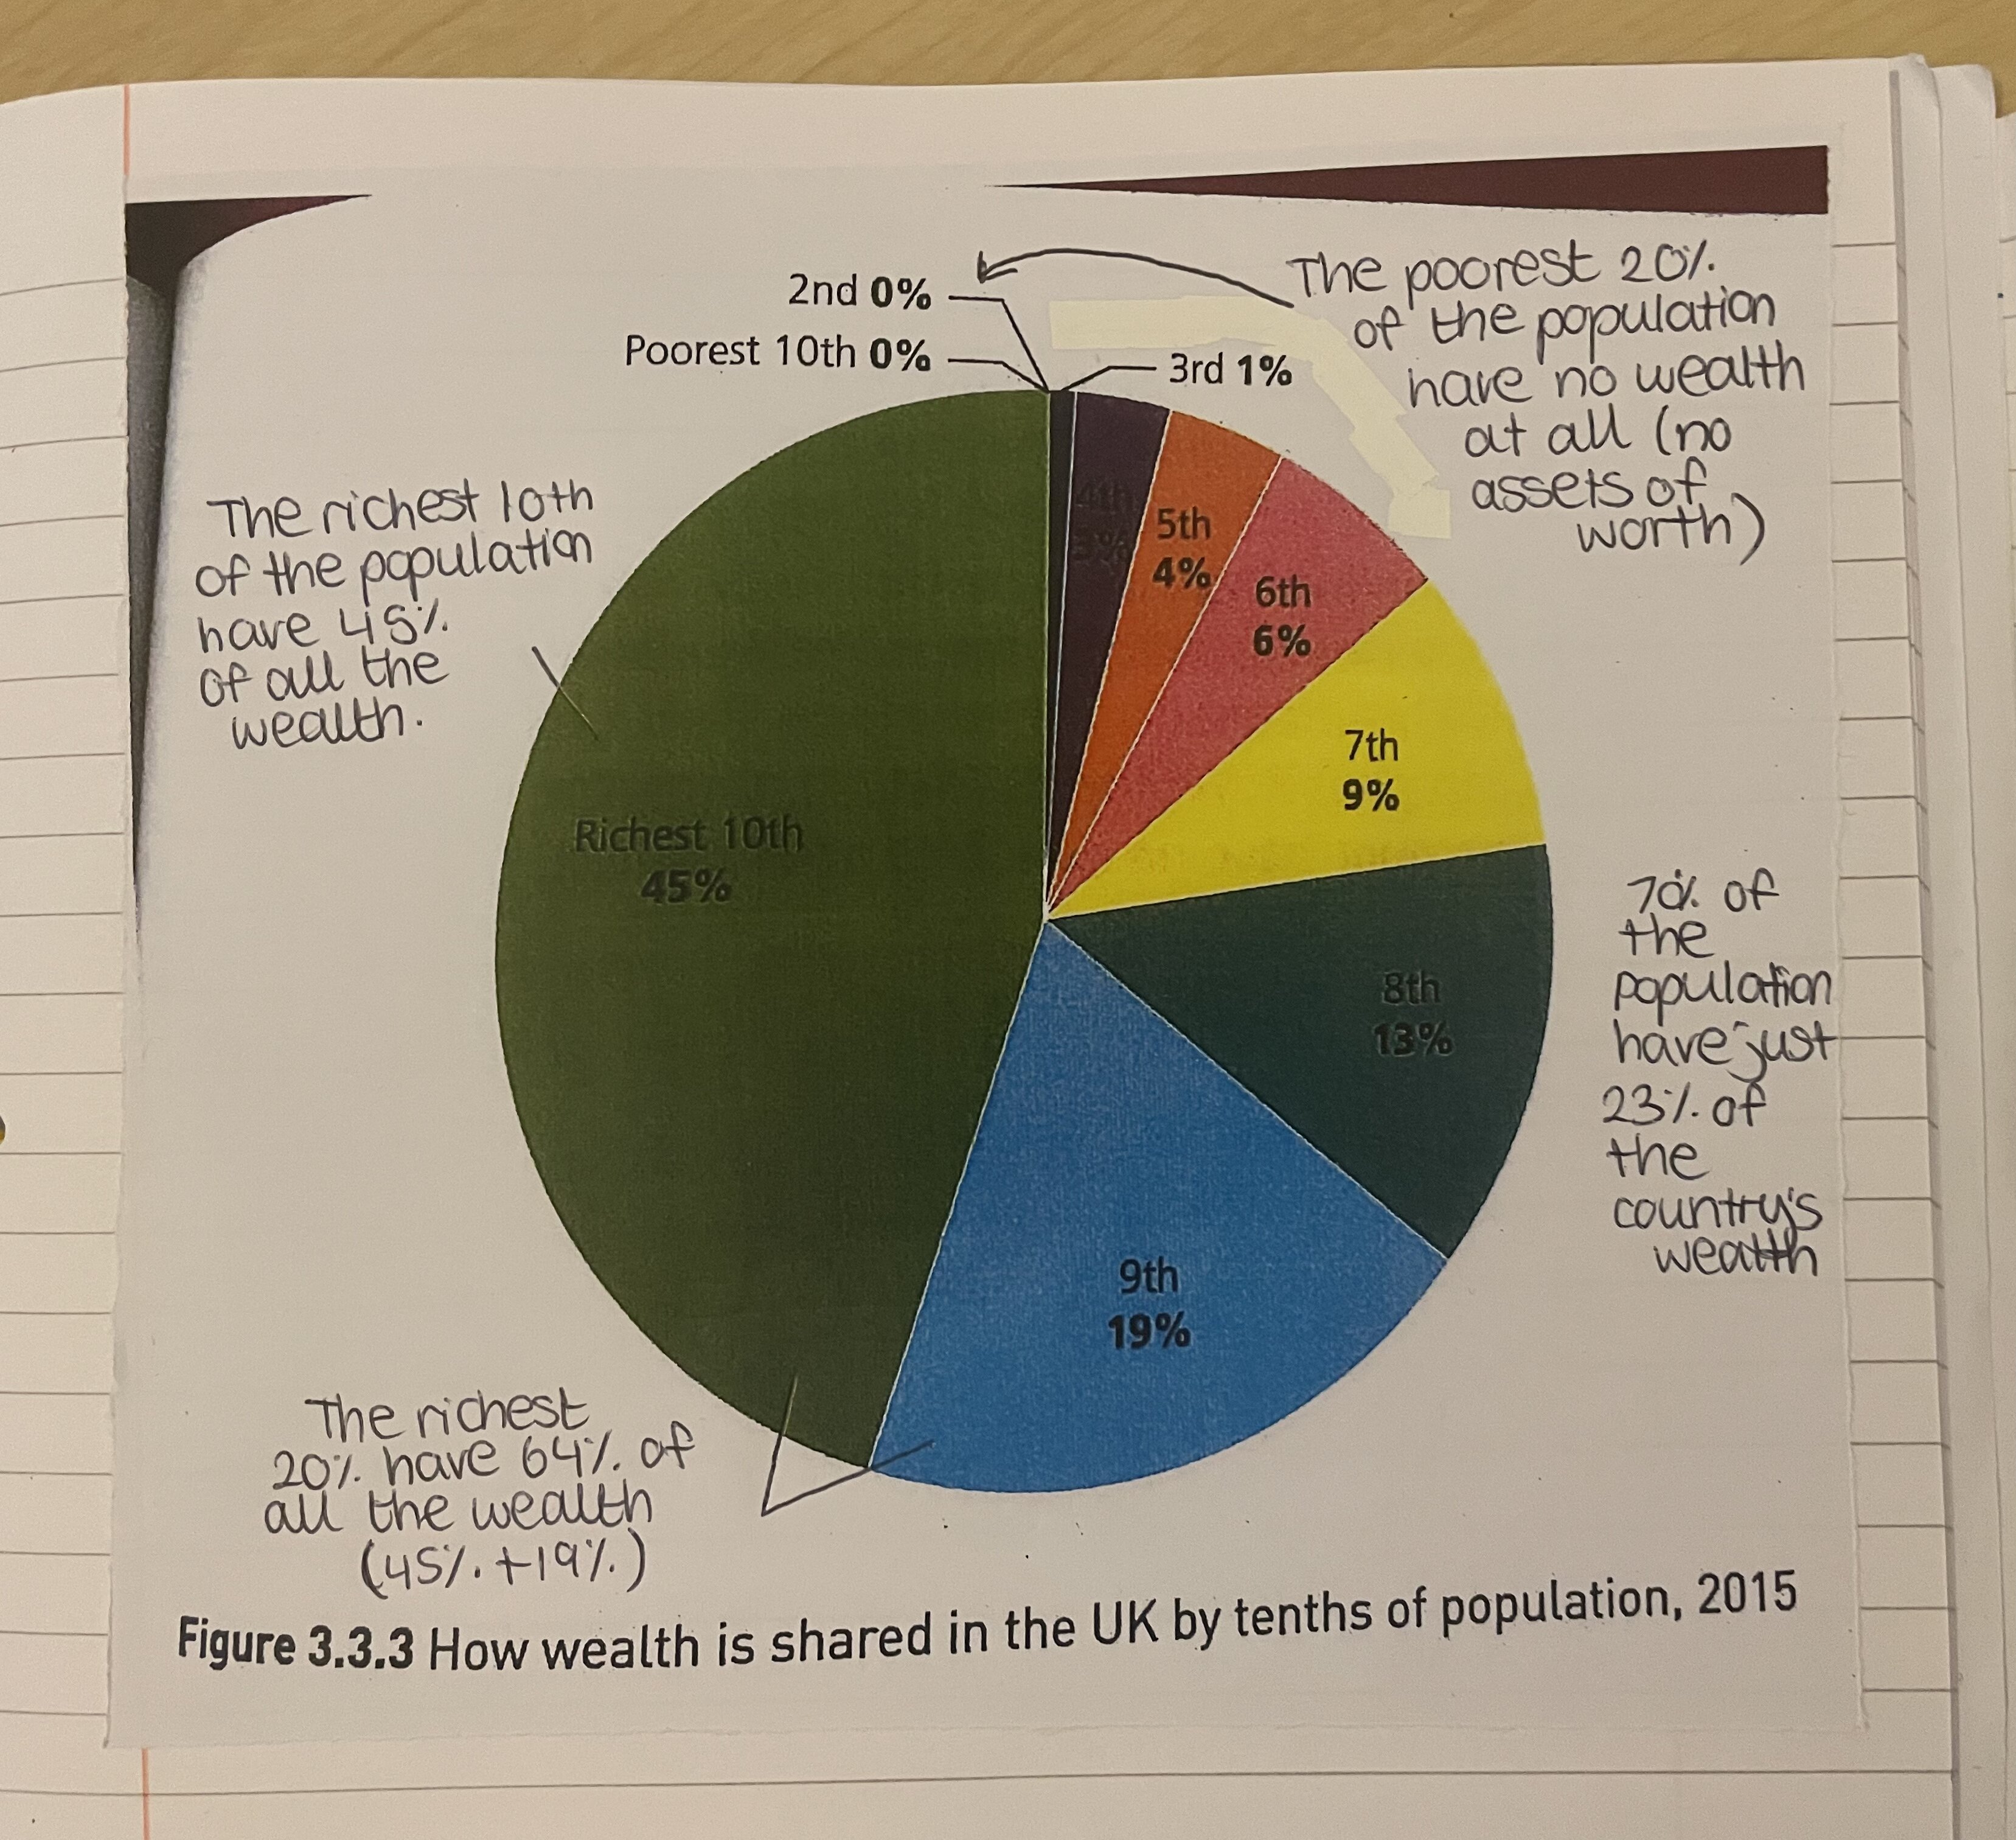
What are the 4 reasons why wealth is unevenly distributed?
1) Inheritance
2) Savings
3) Purchase of property
4) Enterprise
Inheritance
Some families have assets that they pass on to the next generation. The poor have no assets to pass on
Savings
Savings can earn interest, which can in turn be added to savings and build up wealth.
Purchase of property
Property can earn income for owners (rent). Shares in a company are also a type of property. Shares can increase in value and therefore increase wealth. People who own their own property also increase their wealth.
Enterprise
Some people own their own business which if successful can increase wealth through profits and value.
What are the 4 consequences of differences in income and wealth for an economy?
1) Poverty and deprivation
2) Poor housing
3) Poor health
4) Inequality of opportunity
Poverty and deprivation
Some people may be very poor, or homeless. Relative poverty is what a particular society considers to be poor. In developing countries, the poorest often suffer from deprivation with no access to clean water, toilets and electricity.
Poor housing
Some people live in mansions
Middle income people can afford to buy their own homes
Low income people may have to rent accommodation which may be of a poor standard.
In developing countries, the poor may live in shanty towns
What can poor health lead to for poorer people?
Poor people are more likely to suffer ill health, and have a lower life expectancy due to a less healthy diet/lifestyle
Inequality of opportunity
The poorest in society live in areas where the standard of services (e.g education) is lower than average. If poor families receive a substandard education, they are likely to remain poor, making it difficult to leave the cycle of poverty.
What is inflation?
A sustained rise in the general price level over time
What is general price level?
the measure of overall prices of goods and services in an economy at a particular point in time. W
What is general price level expressed as?
As an index
What is price stability?
When the general level of prices stay constant over time or grows at an incredibly low rate.
What happens to consumer money as the prices of goods and services rise?
Consumer money will not purchase as much as before
What causes a fall in the purchasing power of money? And why?
Inflation because it costs more to buy the same goods/services as before
What does inflation do to the cost of living?
Increase it
What is the rate of inflation?
The percentage rise in the general level of prices overtime.
What is the rate of inflation expressed as?
It is expressed as an annual rate of inflation.
What is deflation?
Negative inflation (very rare) which means prices are falling
What is nominal value?
The value of a good in terms of money