Human Populations
1/13
There's no tags or description
Looks like no tags are added yet.
Name | Mastery | Learn | Test | Matching | Spaced | Call with Kai |
|---|
No analytics yet
Send a link to your students to track their progress
14 Terms
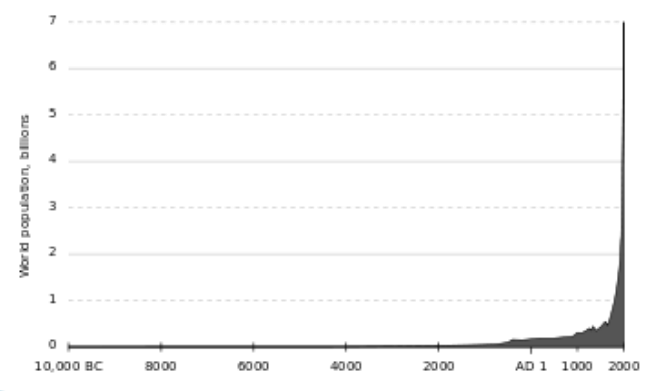
what does the dip in this graph between 1000 and 2000 represent?
black plague

why do developing countries have a higher population than industrialized countries?
higher birth rates driven by economic needs: child labour
limited access to family planning and contraception
cultural values
high mortality rates → higher births to ensure survival
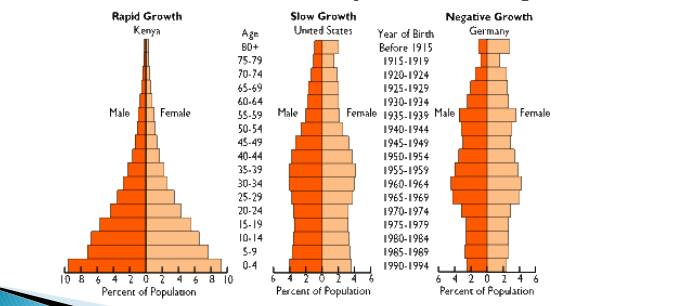
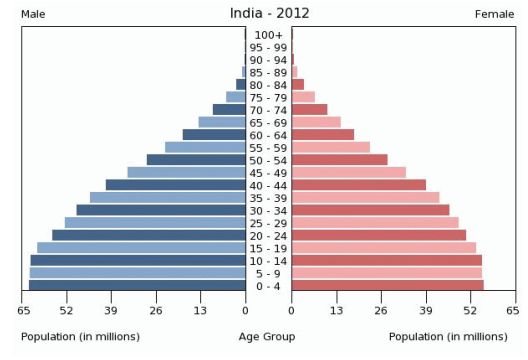
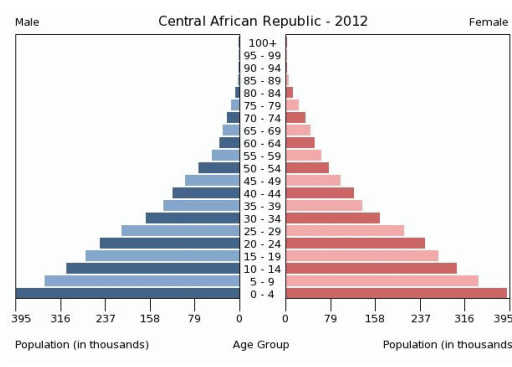
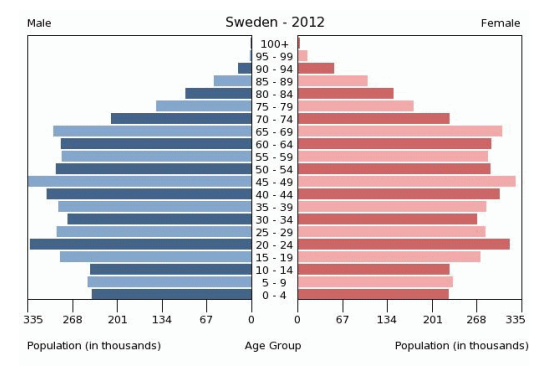
population pyramids
bar graphs used to predict countries potential growth
focus on female pop → reproduction to determine future pop
types of population pyramids
rapid growth: pop continues to increase due to many females that are at age of reproduction
slow growth: pop will grow slowly since moderate amount of females who can reproduce
negative growth: pop will continue to decrease since fewer females to reproduce, lower future pop

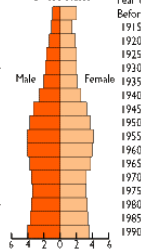
what population graph is this?
negative growth
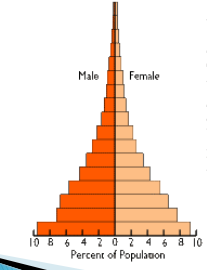
what population graph is this?
rapid growth
what population graph is this?
slow growth
why are population graphs significant
show trends in birth and death rates
allow prediction of future population
can predict and prepare for economic and resource changes
ex. possible need for retirement infrastructure and more healthcare resources if large senior population

predict what would happen to this population in the future
future population sizes will decrease
population should be declining in canada, is not due to immigration
largest population is seniors, large amount of resources needed
predict what would happen to this population in the future
population would continue to increase
rapid growth → many females of reproductive age
predict what would happen to this population in the future
population would continue to increase
rapid growth → many females of reproductive age
predict what would happen to this population in the future
population will decrease since less females of reproductive age
why is child mortality decrease a success?
decreased due to vaccines
signifies advances in health and technology
ensures children survive to adulthood
has the world reached carrying capacity (answer like a test)?
carrying capacity: the maximum amount of species that an environment can support with available resources over a long period of time
we have not reached out carrying capacity
Declining birth rates imply less use of resources
technological advances such as vaccines allow for longer life expectancy → meaning enough resources available for long lifespan
however, we are very close to it as seen through
resources are diminishing: less freshwater, food, land available
climate change, habitat loss, biodiversity loss
overconsumption, pollution, not enough available for poor countries
carrying capacity is dynamic and changing, so we can increase it through medical advancements, renewable energy, etc.