PSYC*4290: Psychological Measurements
1/71
Earn XP
Description and Tags
Lecture 1
Name | Mastery | Learn | Test | Matching | Spaced | Call with Kai |
|---|
No study sessions yet.
72 Terms
In 2200 BCE, what type of test was used
The Chinese Civil Service Tests
Darwin, Galton, Cattell & individual differences “Wherever you can, count.” Took place in the
1800’s
1905 was when
Alfred Binet and the Intelligence Tests was created, making it the first intelligence test
Personality tests are all the rage. So are achievement tests and standardized school testing which took place in the
1930’s & 40’s
A vocational test assesses
an individual’s interests and helps classify those interests as they relate to a job or career
An intelligence tests measures
potential to solve problems, adapt to changing circumstances, profit from experience
Personality tests look at the unique
and stable set of characteristics, traits or
attitudes
Neuropsychological tests assesses
the functioning of the brain as it relates to
everyday behaviors
An aptitude test measures the
potential for acquiring a specific skill
An achievement test measures the
previous learning and knowledge
A variable is anything that can
take on more than one value
Anything that can be different/can change either within a person or between people
Variables
Assignment of a “label” to a variable or an outcome is called a
Measurement
• Height - tall vs short
• Height - in feet and inches
These are used in
Precision
In Precision
The more precisely we measure,
the more information we have
Variables can be measured in different ways and the way we chose to measure them determines
the level of measurement being used.
In the properties of the different levels of measurement, the magnitude is the
Moreness More, less, equal
Height, age, weight
In the properties of the different levels of measurement, the Equal Intervals is the
difference between two points on a scale means the same as it
would on a different part of the scale.
Think of a roler
In the properties of the different levels of measurement, the absolute zero is the
total absence of
something
Speed, hair.... your pulse
A nominal scale has
none of these properties
and so are not really scales
Nominal scales are used for
qualitative data
⚬ Political Party, gender etc.
The ordinal scale has the property of
Magnitude
Ordinal scale allows for the
ranking, or ordering
⚬ Arranging a class by height
(without numbers)
Most scales we use are
Ordinal
Interval scales have both
magnitude and equal
intervals
⚬ Most common is temperature
⚬ Time of day on a 12 hr clock
Interval scaling
Ratio scales are
Rarely seen in social sciences
• Has all of the properties of scales
⚬ Speed of travel
⚬ Number of dogs my parents
have
Ratio scaling
Continuous is a
scale that allows for fractional amounts so decimals make sense
⚬ Height, time, distance, and age are examples of a
Continuous scale
Discrete scale is a
fixed amount which cannot be broken into smaller amounts
make sense
⚬ number of kids, people in this class, heart beats are all examples of a
Discrete scale
The more precise our measurements, the greater
our ability to use
statistics
The more precisely we measure, the less
error we have
The more complex the variable, the higher the
degree of precision we
can use in measuring
Each level has the properties of the one
before and something extra
Another name for the raw score is the
observed score
The definition for a raw score is the
The “untransformed” score before any type of operation is
performed on it.
Percentile ranks are the
Points in a distribution of scores below which
a given percentage of scores fall.
In the 45th Percentile (P45) = the score below which
45% of the other scores fall
The lower the percentile, the lower a
person’s rank within the group
What is the formula to turn a percentage rank into a raw score
Pr = (B/N) X 100
Your percentile rank is 42.5 meaning that 42.5% of students
had scores lower than yours.
What are the measures of central tendency?
The Mean, Median, and the Mode
The Mean is the
The average of the
numbers
Add the numbers together
Divide by how many
numbers were added
This is talking about the mean
The Median is the
middle number of a
sequence
Arrange the numbers in order
and find the middle
If you have an even amount
of numbers, add the middle
two together and divide by 2
This is talking about the median
The mode is the
number that occurs
most often
Find the number that occurs
most often.
This is talking about the mode
Can there be more then one mode
yes
On a perfect normal distribution, all three measures
of central tendency are located at the
same score.
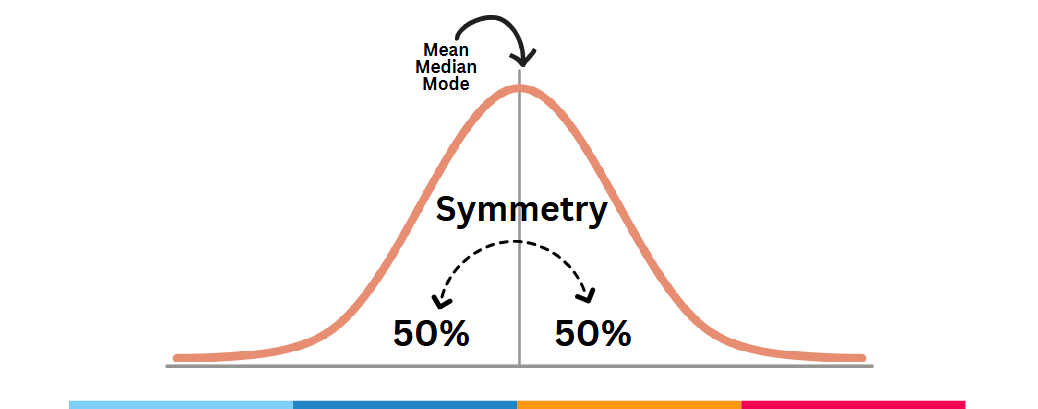
A negative skew goes by
Mean, Median, Mode
A positive skew goes by
Mode, Median, and Mean
What are the measures of Variability
Consistency, Accuracy, Spread
With a small variability, scores are
1: Consistent
2:Closer to the mean
3: Less distance between scores
With a large variability, scores are
1: Inconsistent
2: Farther away from the mean
3: Greater distance between the scores
How do we measure variability
1: Range
2: Variance
3: Standard deviation
Variance and Standard Deviation indicate
how much the scores are spread out
around the mean.
When the mean is the appropriate measure of
central tendency, we compute the variance and
the standard deviation to describe
Variability
the mean is the appropriate measure
of central tendency for
normally distributed
interval or ratio scores
The standard deviation is the
approximate average deviation around the mean
The variation or how spread out or bunched up the scores are
The standard deviation
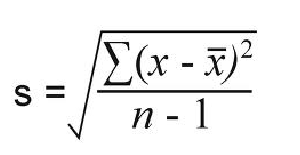
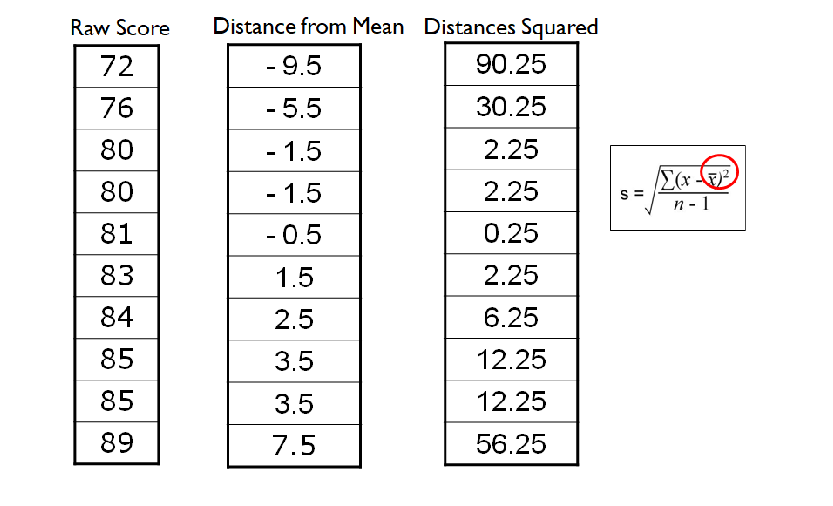
In calculating the standard deviation, the s in the formula is the
square root of the sum of the squared
differences between the observed value and the
mean, divided by the number of observations
minus one.
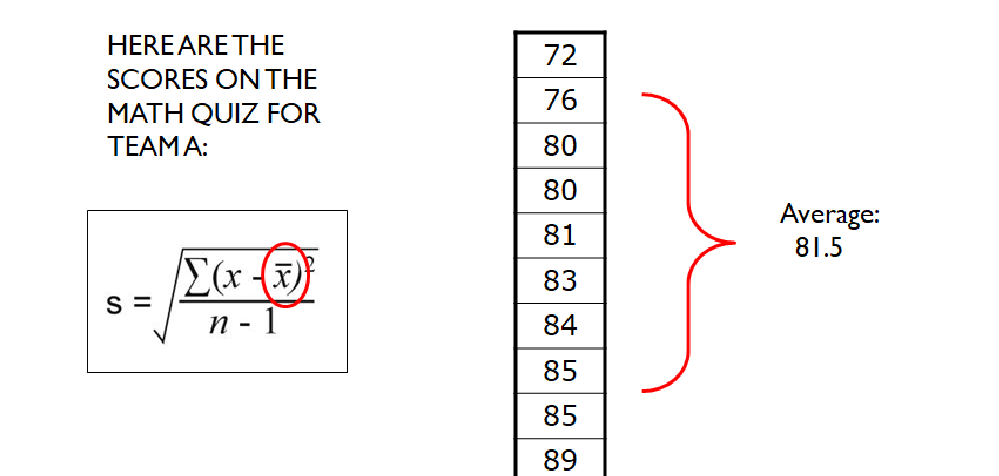
What is the first step one in finding the standard deviation
To find the mean of all the raw scores.
-Add them up and divide them by the total number of raw scores.
What is step two in finding the standard deviation
To take the mean of the raw scores and minus it by each of the raw scores
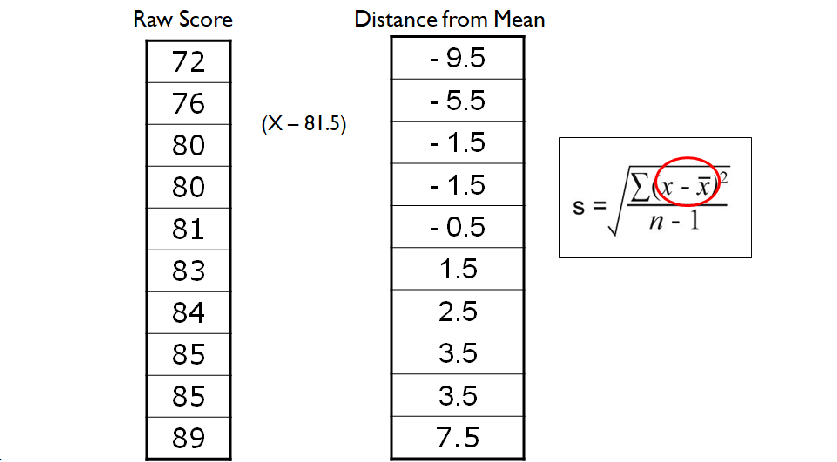
What is step three in finding the standard deviation
To take the scores after being minused by the mean and times them by themselves
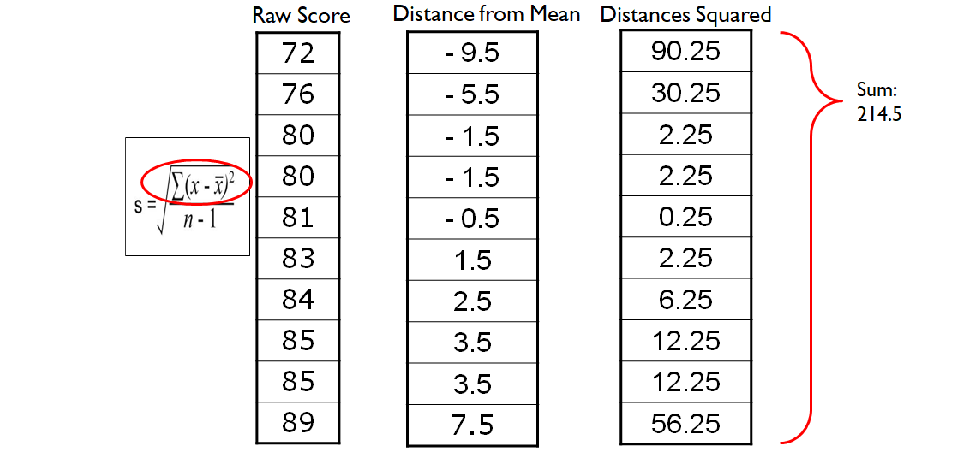
What is step four in finding the standard deviation
To find the sum/mean of the squared scores
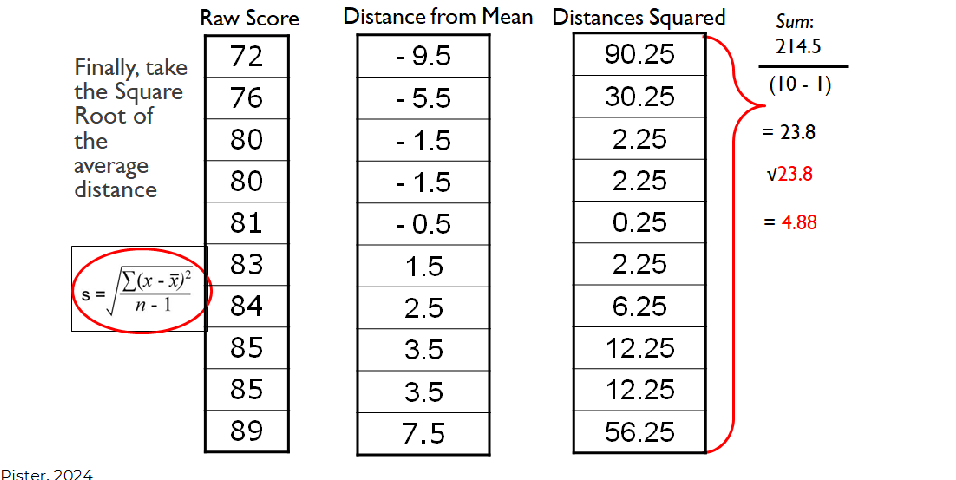
What is step five in finding the standard deviation
After taking the sum/mean of the squared units, we divided it by the degrees of which is typically n - 1.
-After we achieve the variance, we square root it to get the SD
The variance is simply the
standard
deviation squared.
The standard deviation is the
square root of
the variance
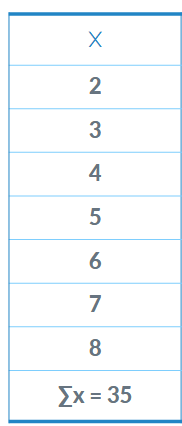
Find the sd for this with a sample size of 7
2.16