Gen Eco Unit Test 2
1/67
There's no tags or description
Looks like no tags are added yet.
Name | Mastery | Learn | Test | Matching | Spaced | Call with Kai |
|---|
No analytics yet
Send a link to your students to track their progress
68 Terms
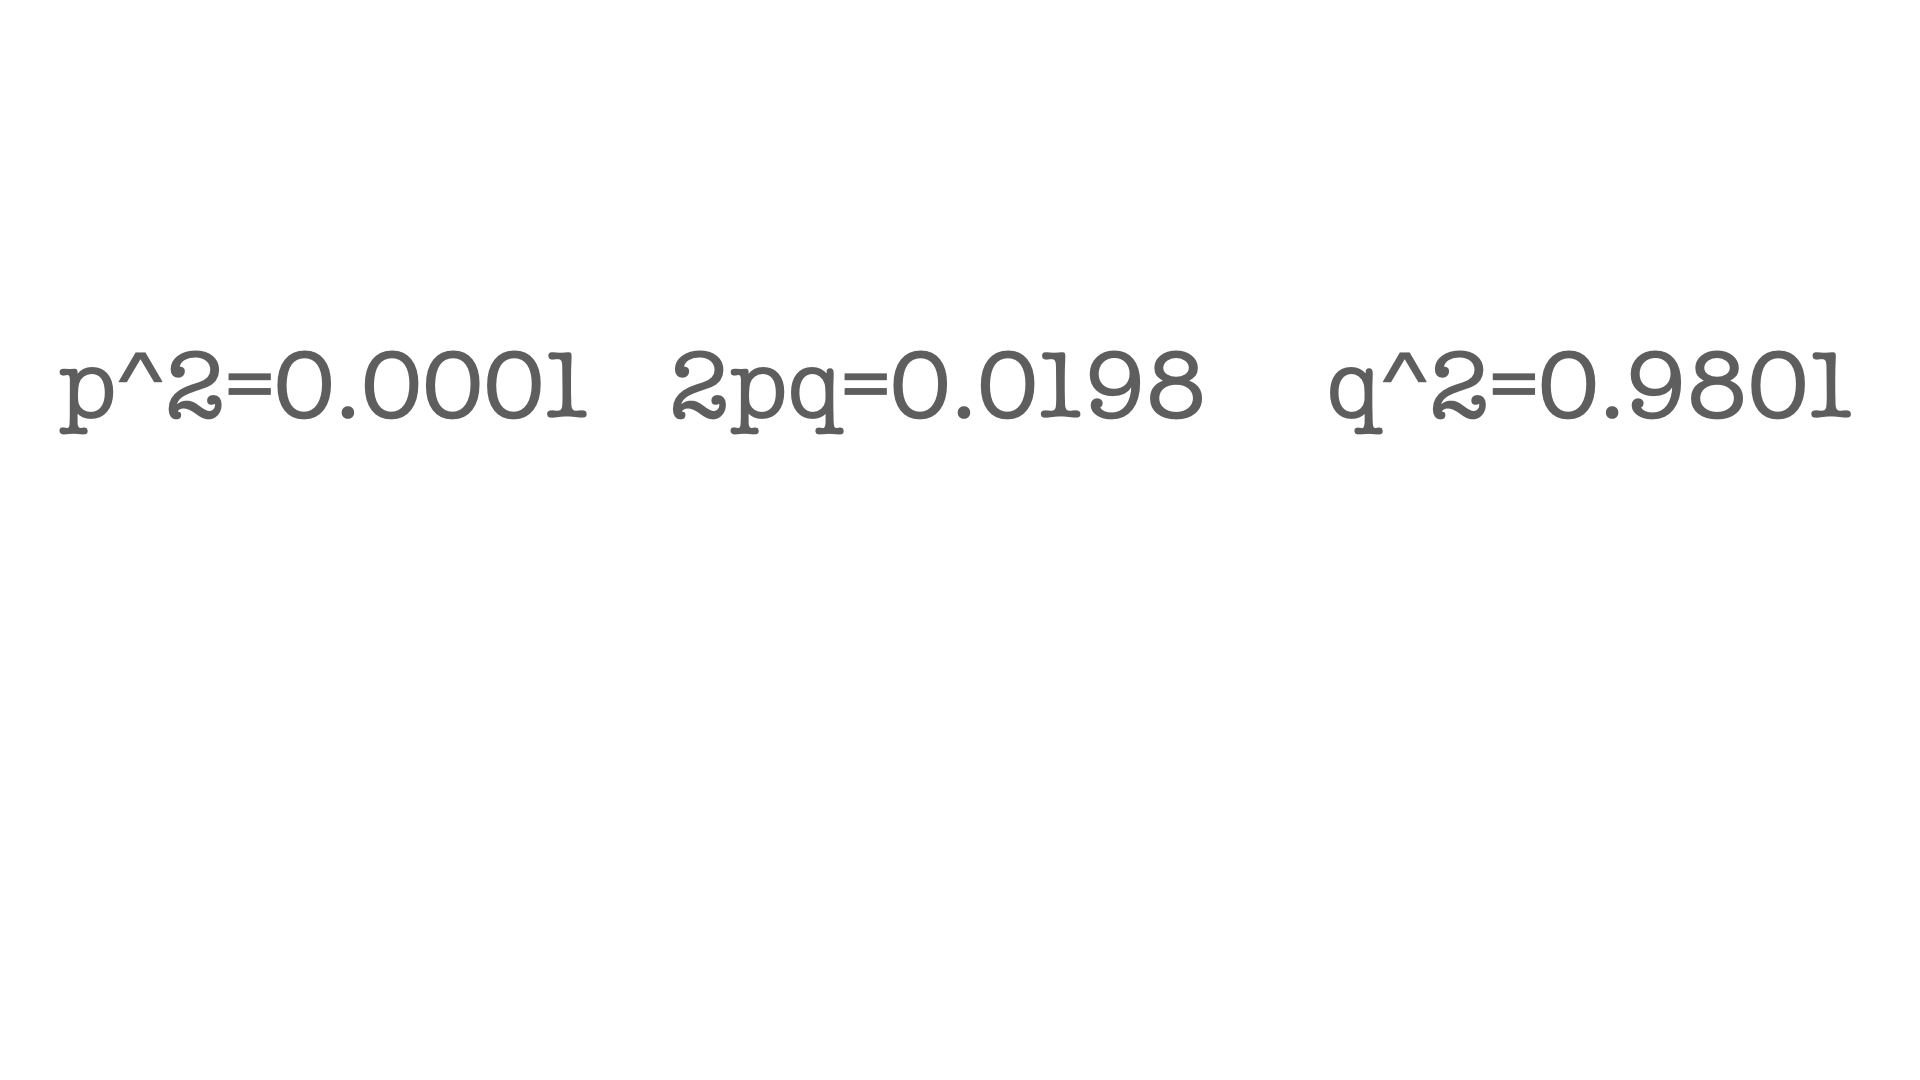
What are the the allele frequencies that would lead to the following genotype frequencies shown above, assuming all the conditions of Hardy Weinberg are in fact true?
p=0.01; q=0.99
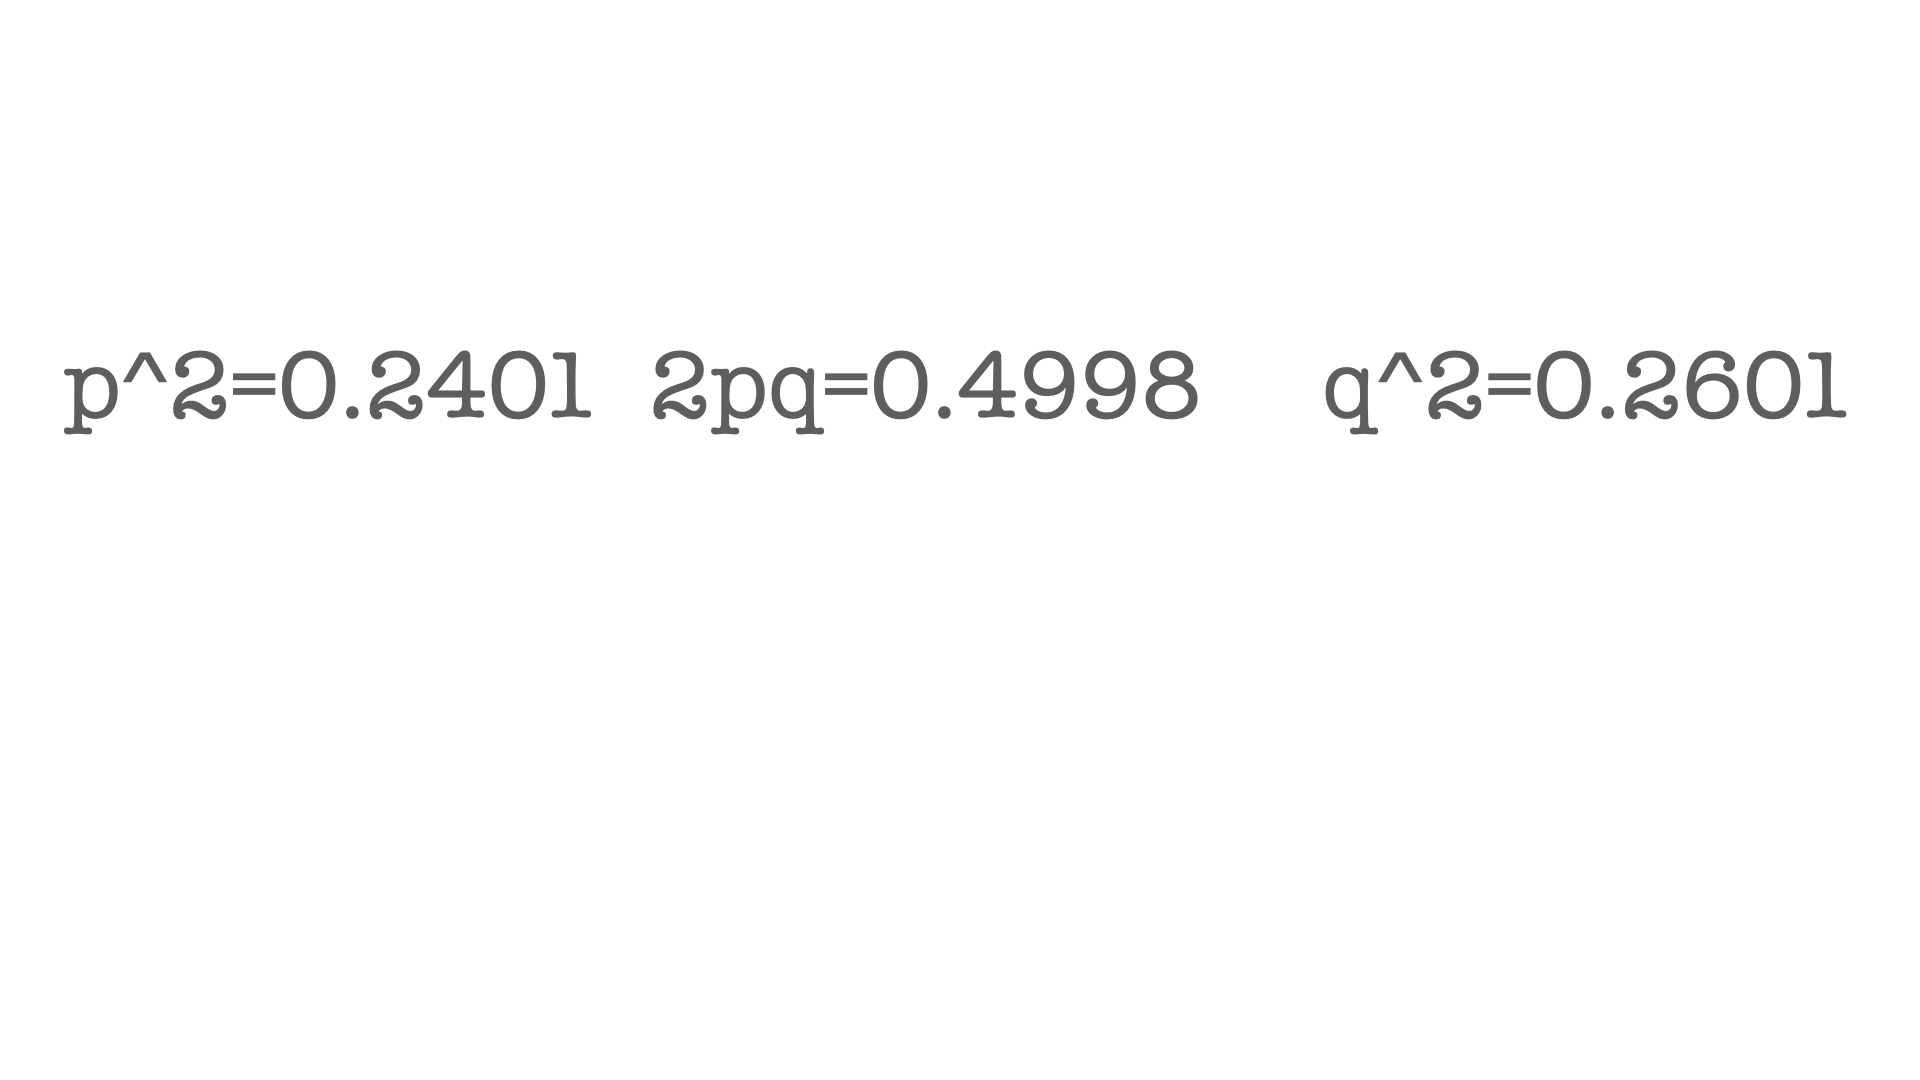
What are the the allele frequencies that would lead to the following genotype frequencies shown above, assuming all the conditions of Hardy Weinberg are in fact true?
0.49; q=0.51

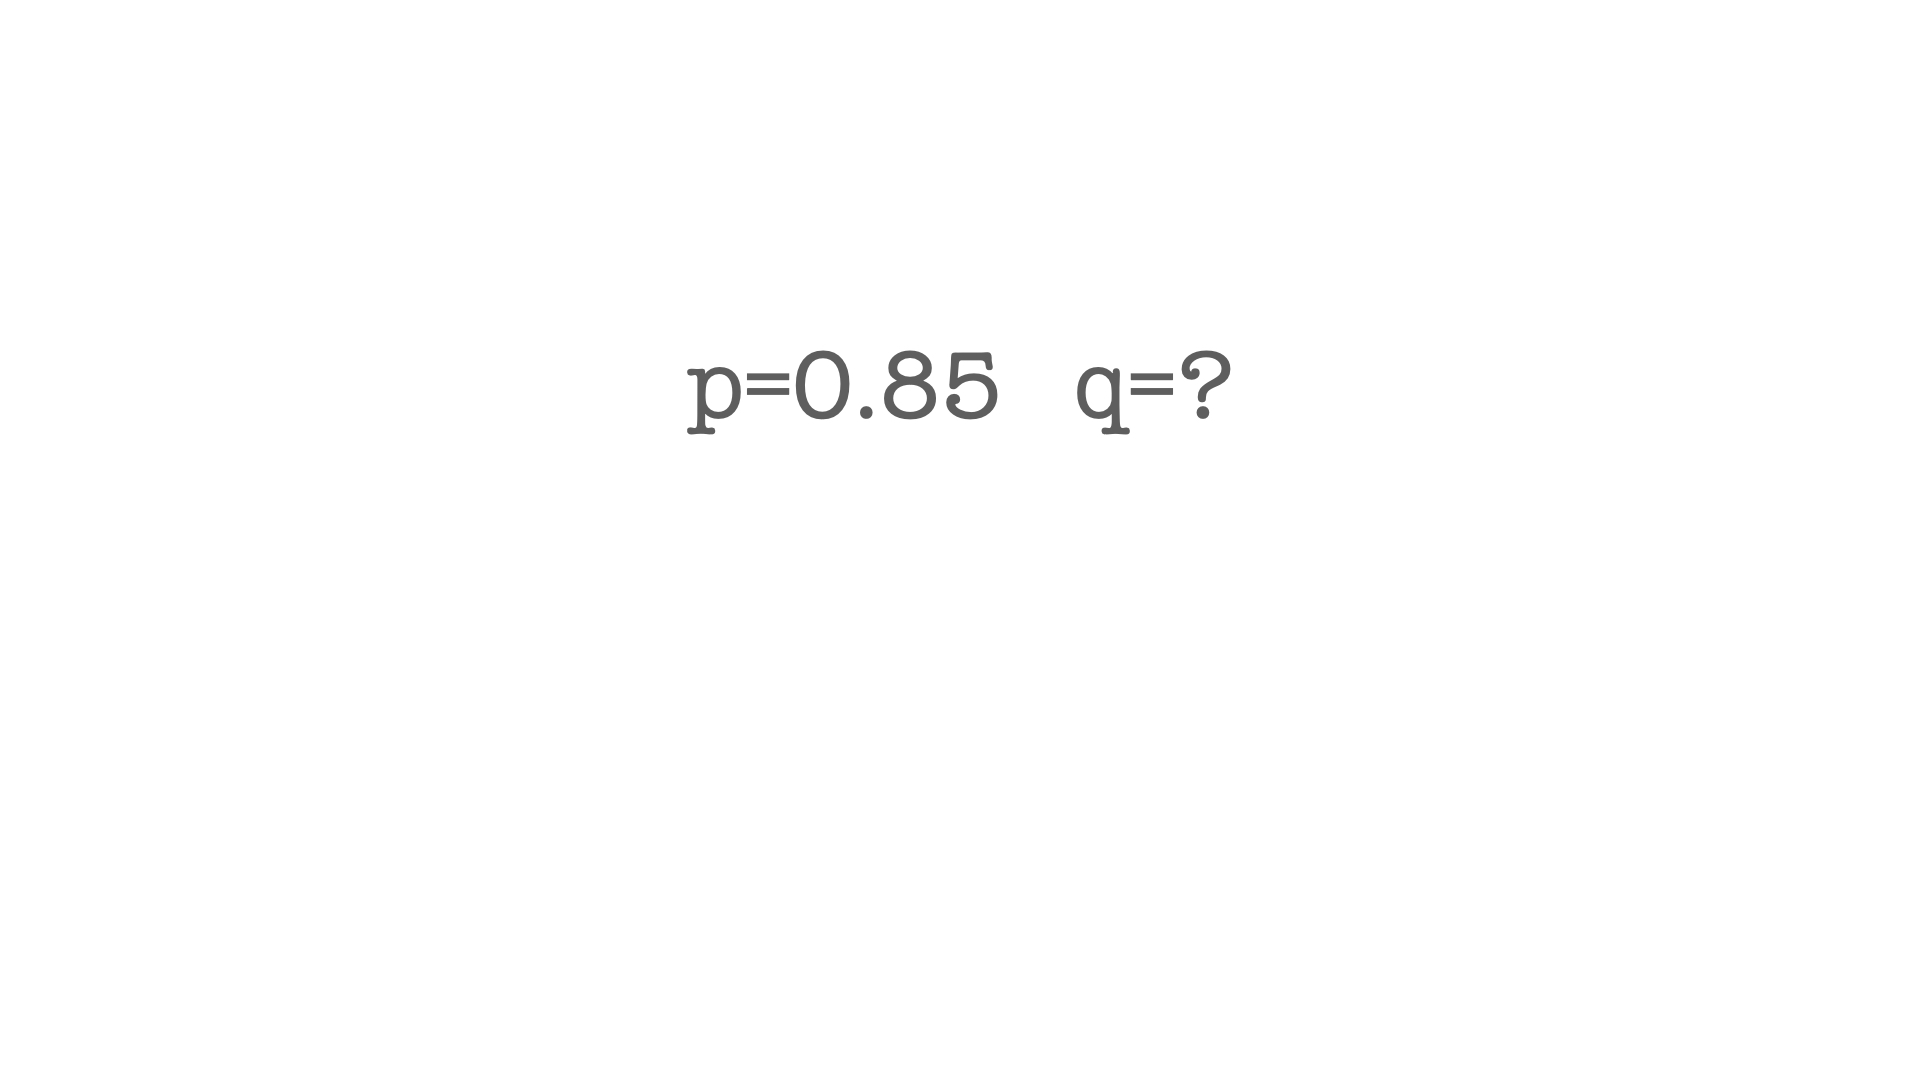
What are the expected genotype frequencies for the allele frequencies shown above, assuming all the conditions of Hardy Weinberg are in fact true?
p^2=0.865; 2pq=0.130; q^2=0.005
What are the expected genotype frequencies for the allele frequencies shown above, assuming all the conditions of Hardy Weinberg are in fact true?
p^2=0.723; 2pq=0.255; q^2=0.023
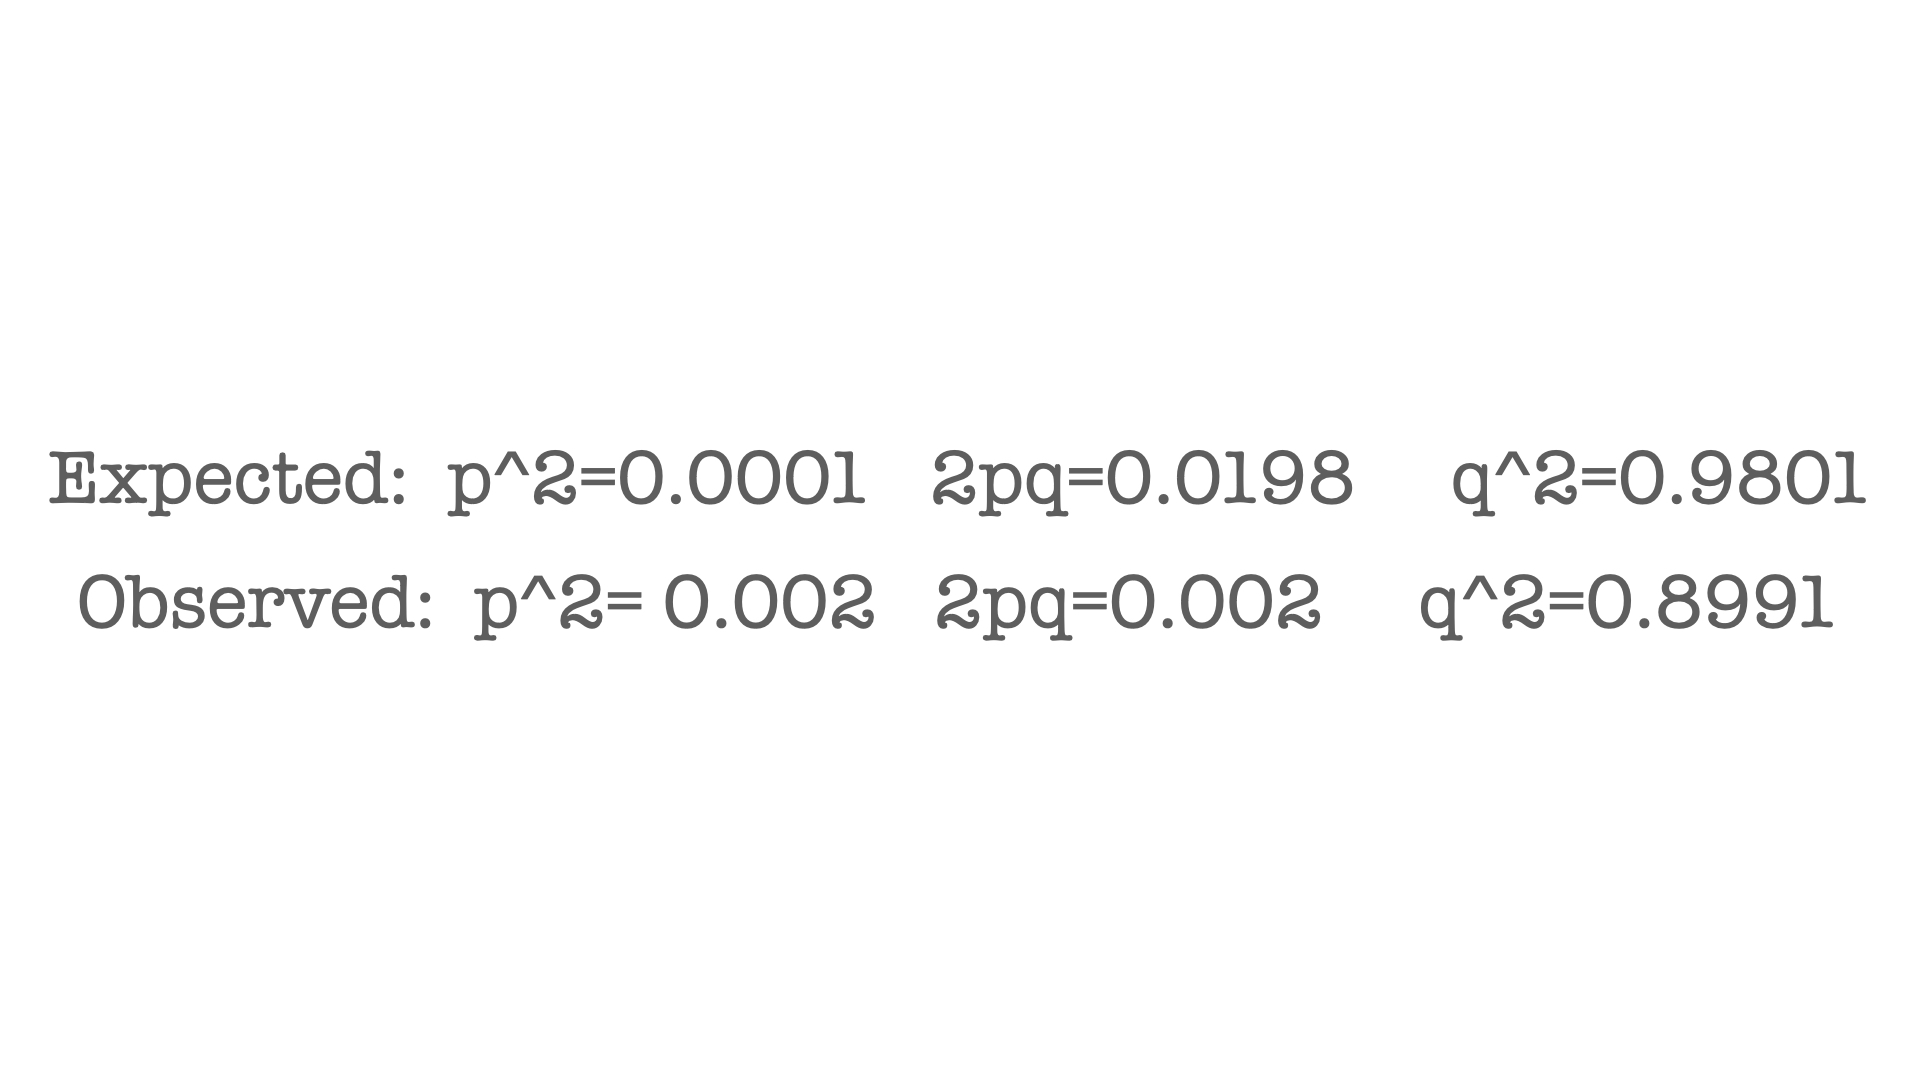
iven the expected and observed genotype frequencies shown above, is natural selection acting on this population and, if so, what type of selection is it?
directional selection is acting on this population
his condition would not be met if individuals have mate preferences
mating is random within a population
This describes the number of offspring produced by a given individual.
fitness
(T or F)Only if all 5 of the conditions of Hardy-Weinberg are false can evolution can occur by natural selection.
false
(T or F)Fixation of one or the other allele in a population for a given gene would result in a loss of genetic diversity for that population.
true
Fixation of one or the other allele in a population for a given gene would result in an increase in genetic diversity for that population.
false
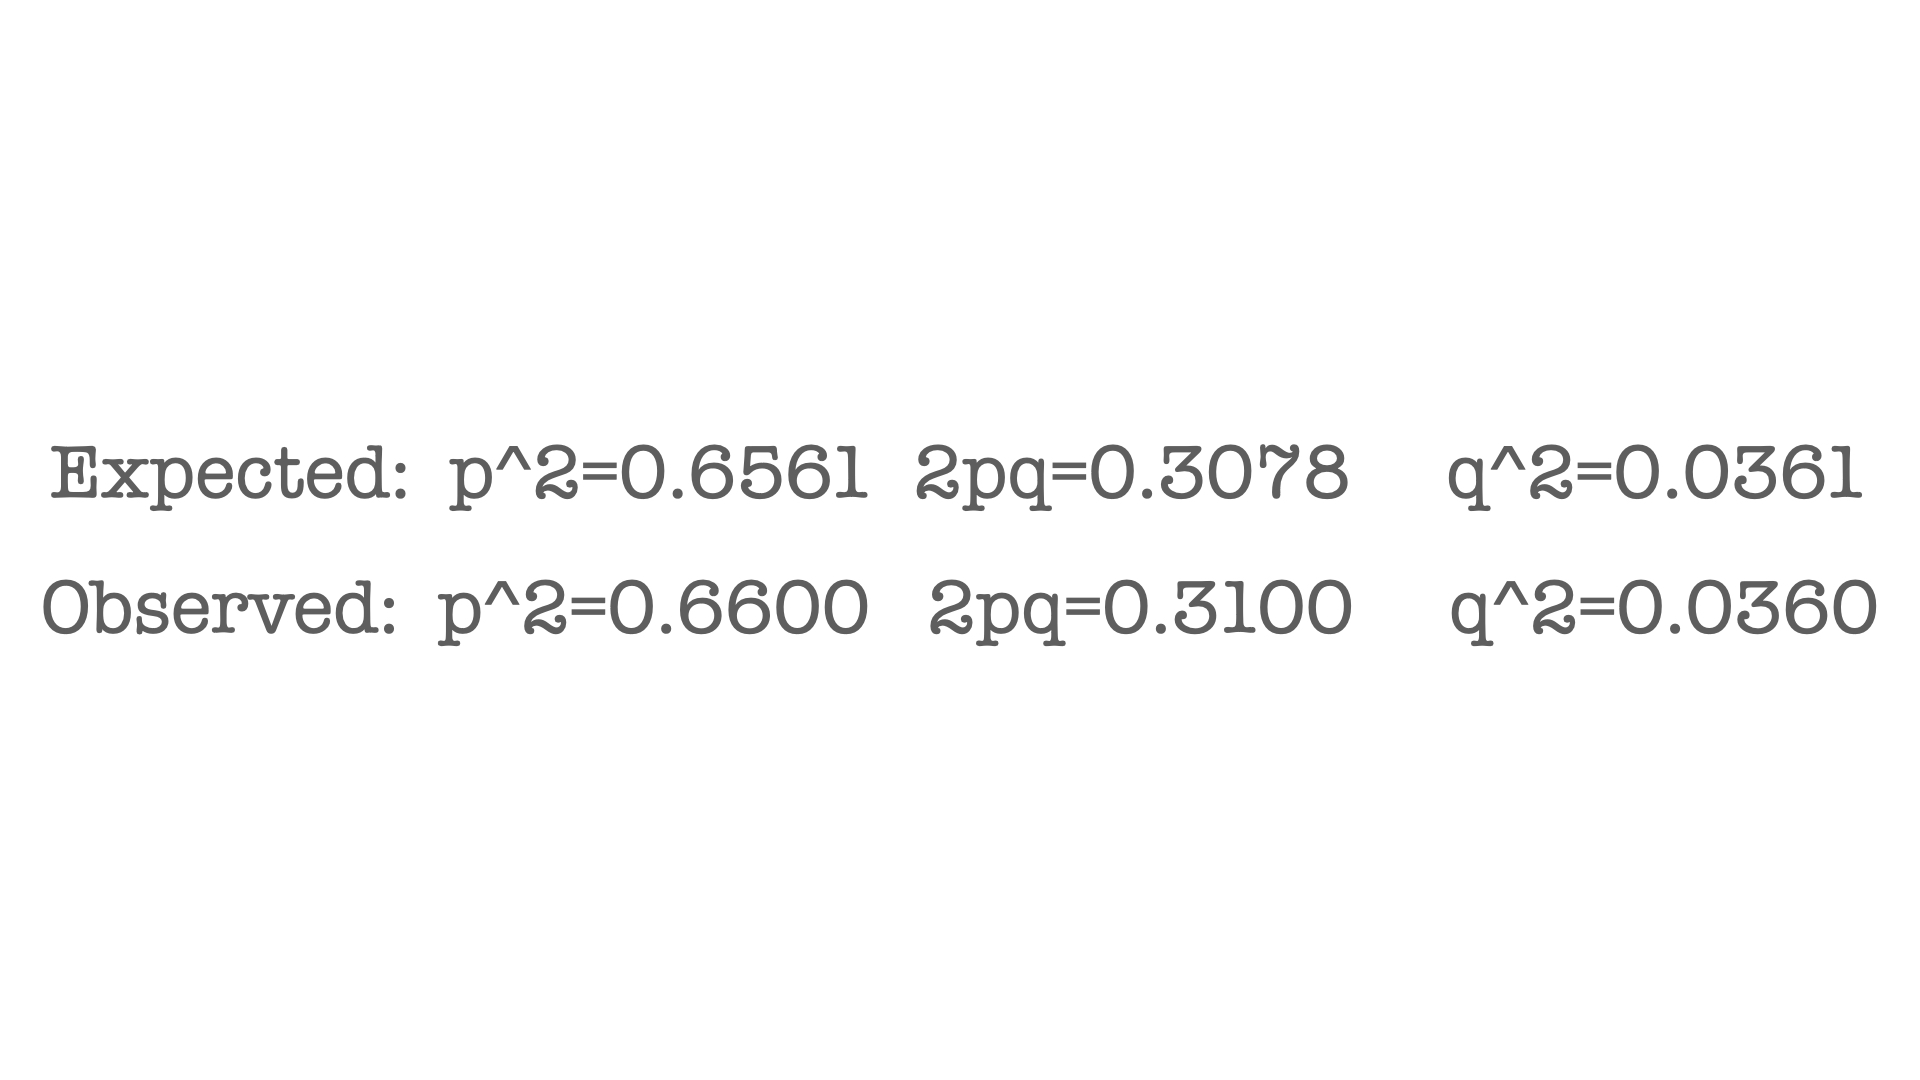
Given the expected and observed genotype frequencies shown above, is natural selection acting on this population and, if so, what type of selection is it?
stabilizing selection is acting on this population
This is in effect when we see more of one and only one homozygote than expected.
directional selection
(T or F) When the value of heritability (h2) is greater than 1 the genetic contribution to a given trait is less than the contribution of environmental factors to that same trait.
false
(T or F) When the value of heritability (h2) is greater than 1 the genetic contribution to a given trait is greater than the contribution of environmental factors to that same trait.
true
(T or F)If even 1 of the conditions of Hardy-Weinberg is false then evolution can occur by natural selection.
true
This condition would not be met if there was a change in allele frequencies in a population due to differences in the fitness of those alleles
here is no natural selection occurring in the population
This describes the condition wherein the frequency of alleles in a given population change over successive generations
microevolution
(T or F) When the value of heritability (h2) is less than 1 the genetic contribution to a given trait is greater than the contribution of environmental factors to that same trait.
false
This describes the condition wherein some individuals in a population survive and reproduce at a higher rate than others in the same population.
natural selection
This is in effect when we see more of both homozygotes than expected.
disruptive selection
(T or F) When the value of heritability (h2) is less than 1 the genetic contribution to a given trait is less than the contribution of environmental factors to that same trait.
true
This condition refers to the effect of genetic drift in populations
populations are essentially infinite in size
This condition implies that there is no gene flow among populations
populations are reproductively isolated from one another
At broader geographic scales (e.g. continental level) most organisms exhibit what kind of distribution pattern.
clumped
(T or F) The exhibition of random distribution patterns for populations of a given species usually result from positive interindividual interactions or reactions of individuals to scarce local resources.
false
(T or F) The exhibition of clumped distribution patterns for populations of a given species usually result from interindividual competition or scarcity of local resources.
false
Fundamental niche
The abiotic conditions that a given species requires in order to survive
Realized niche
the actual spaces where a given species lives, considering both abiotic and biotic factors
Random distribution
A population distribution characterized by variance in density equal to mean density
Regular distribution
A population distribution characterized by variance in density less than mean density
Clumped distribution
A population distribution characterized by variance in density greater than mean density

Which of the above diagrams shows a population distribution pattern with a variance in population density less than the mean population density?
b
(T or F) The exhibition of clumped distribution patterns for populations of a given species usually result from interindividual attraction or attraction to local resources.
true
A population distribution characterized by a low variance in the density of individuals relative to mean density
regular
(T or F) the exhibition of regular distribution patterns for populations of a given species usually result from interindividual attraction or abundant local resources.
false
(T or F) The exhibition of random distribution patterns for populations of a given species usually result from neutral interindividual interactions or neutral reactions of individuals to local resources.
true
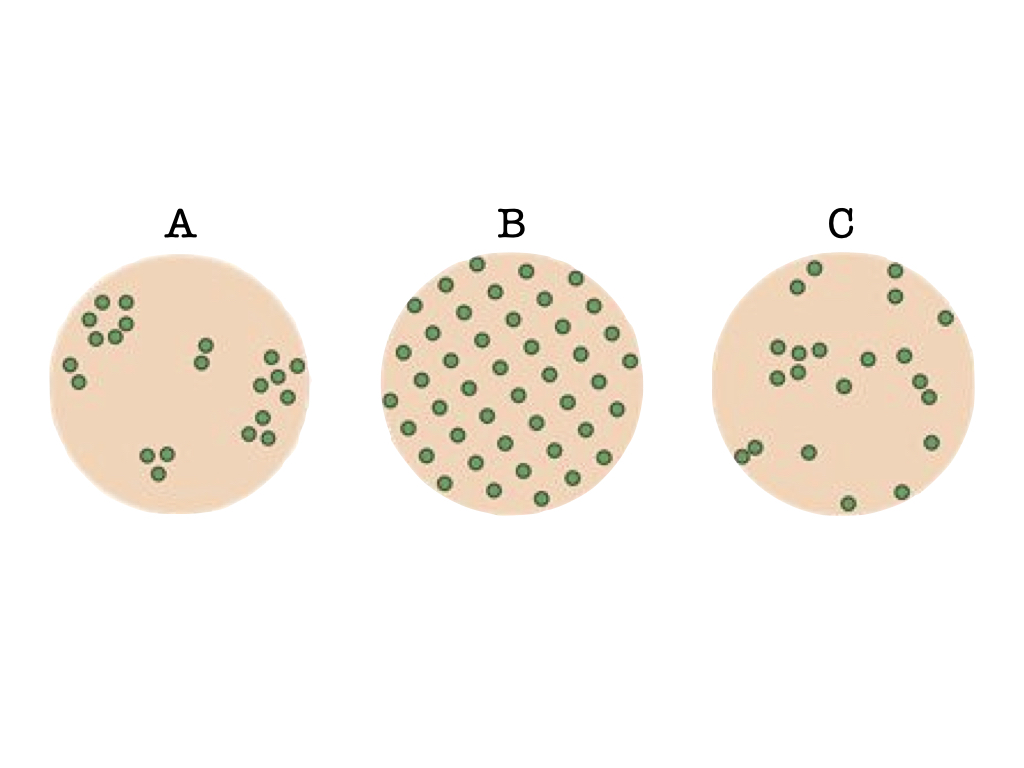
Which of the above diagrams shows a population distribution pattern with a variance in population density greater than the mean population density?
a
(T or F) The exhibition of regular distribution patterns for populations of a given species usually result from interindividual competition or depletion of local resources.
true

Which of the above diagrams shows a population distribution pattern with a variance in population density equal to the mean population density?
c
(T or F) The exhibition of random distribution patterns for populations of a given species usually result from positive interindividual interactions or reactions of individuals to scarce local resources.
false
This type of growth is characteristic of a species that exhibits a carrying capacity.
logistic
A population that experiences increased predation with increasing density would be an example of
increased death rates
A population of colonizing species that experiences high fecundity during the early stages of colonization would be an example of
increased birth rates
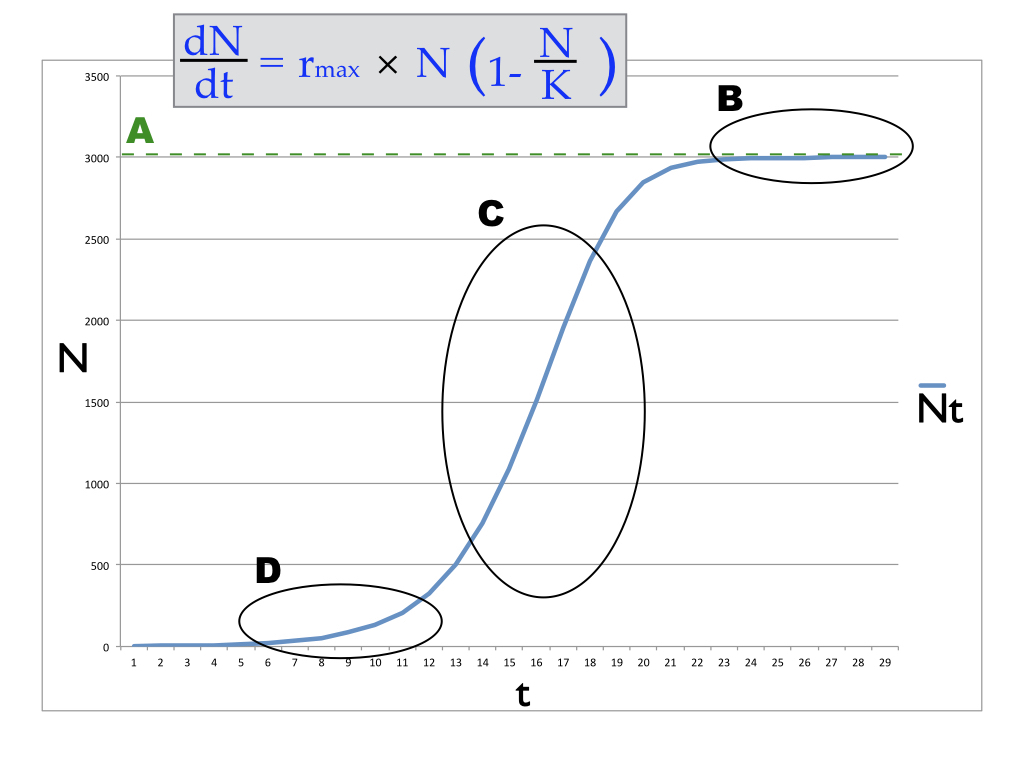
Where is the population growth rate being graphed above highest?
c
A population that experiences reduced fecundity as resources become limited at increasing population densities would be an example of
decreased birth rates
(T or F) Exponential growth never occurs in nature even for limited periods of time.
false
(T or F) Population limiting factors either decrease death rates or increase birth rates.
false
(T or F) Exponential growth occurs in nature for limited periods of time when species invade new habitats or as endangered species recover.
true

Which part of the equation for this type of population growth corresponds to the line labeled A in the diagram above?
K
population growth equation: N
The number of individuals in a given population
population growth equation: Nt
The number of individuals in a given population at a given time
population growth equation: N0
The number of individuals in a given population at the beginning of a time series
population growth equation: K
The carrying capacity of a given population
Intrinsic growth rate
The rate at which a given population is able to grow barring any limiting factors
Realized growth rate
The rate at which a given population actually grows including any limiting factors
(T or F) Populations with lower proportions of individuals in pre-reproductive ages will tend to experience an increase in population growth rates in future generations.
false
(T or F) Population growth rates are negatively affected by increases in population density as resources become increasingly scarce.
true
(T or F) Populations with higher proportions of individuals in pre-reproductive ages will tend to experience an increase in population growth rates in future generations.
true
(T or F) With unlimited resources populations with non-overlapping generations exhibit exponential growth rates while those with overlapping generations exhibit geometric growth rates.
false

What happens to the population growth rate as the value of N approaches that of K
it approaches 0
(T or F) the rate of growth of a population will continue to increase as the size of the population approaches its carrying capacity.
false

Where is the population growth rate being graphed here lowest but not equal to 0?
d
(T or F) With unlimited resources populations with non-overlapping generations exhibit geometric growth rates while those with overlapping generations exhibit exponential growth rates.
true
This type of growth is characteristic of a species that exhibits overlapping generations.
exponential

Where is the population growth rate being graphed here equal to 0?
b
This type of growth is characteristic of a species that exhibits non-overlapping generations.
geometric
(T or F) The rate of growth of a population will approach 0 as the size of the population approaches its carrying capacity.
true
(T or F) Population growth rates are not affected by increases in population density.
false