Looks like no one added any tags here yet for you.
what is the electrical telegraph
a device that allows transmission of information by coded signal
how did telegraphs send signals
used a transmitter to encode a message into Morse code, which was sent over wires and undersea cables
what did the telegraph mainly allow for
- it was a vital tool for the transmission of news (e.g. the Associated Press)
- the invention of the telegraph allowed for trade reach farther than before
- it allowed for international stock markets
what did Ino Tadataka do
walked around Japan for decades and created a very accurate map of Japan
what methods/tools did people use in the past to make maps
- traversing
- triangulation
- surveyors' cross
- compass
- astrolabe
- cross-staff
- back staff
how did map making methods improve
compass and surveyors cross -> octants, quadrants, sextants, chronometers, -> satellites, aerial photography, GPS, computer design
What led maps to improve so much by the 20th century?
In large part, it is due to improved cartography instruments, in particular, aerial and digital tools that make modern maps more and more precise, in comparison to maps from earlier on in history. Precision, as well as confirmation of certain knowledge, allowed us to create many types of maps, in which case, we perceive more accurate maps as better, and since having a larger diversity of accurate maps, viewing the globe from many angles and ways, it has also improved. One thing about Ino Tadataka's maps that is important to note is that they were extremely accurate, even at a large scale, which is part of why they were very good maps. With more modern technology, there was more accuracy and better design.
how do maps measure distortion
Tissot's indicatrix (compares the shape, and size using dots)
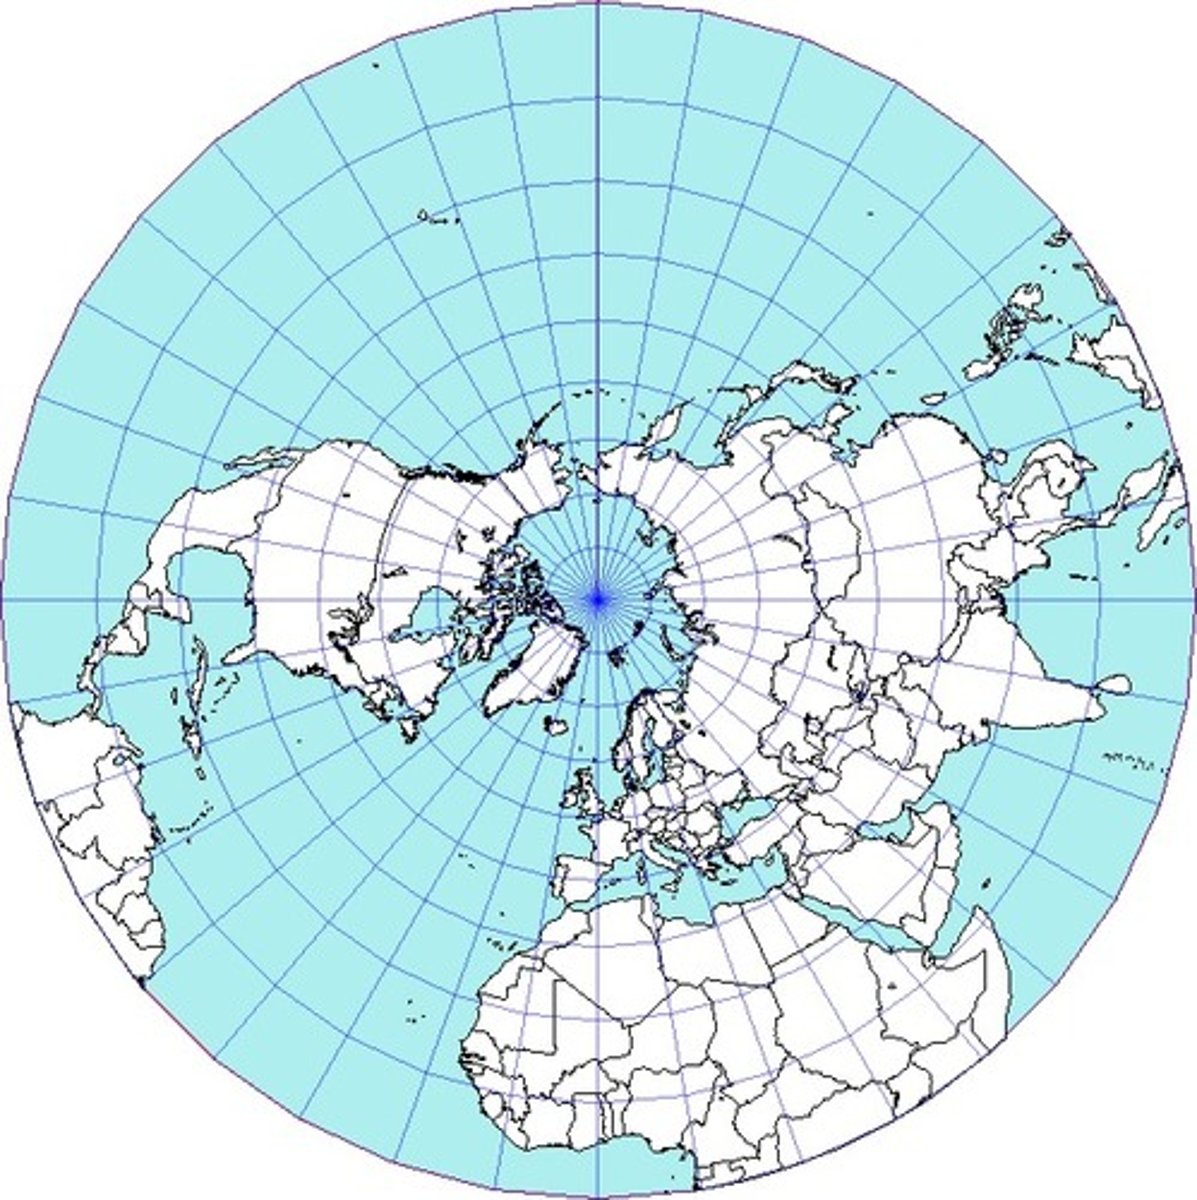
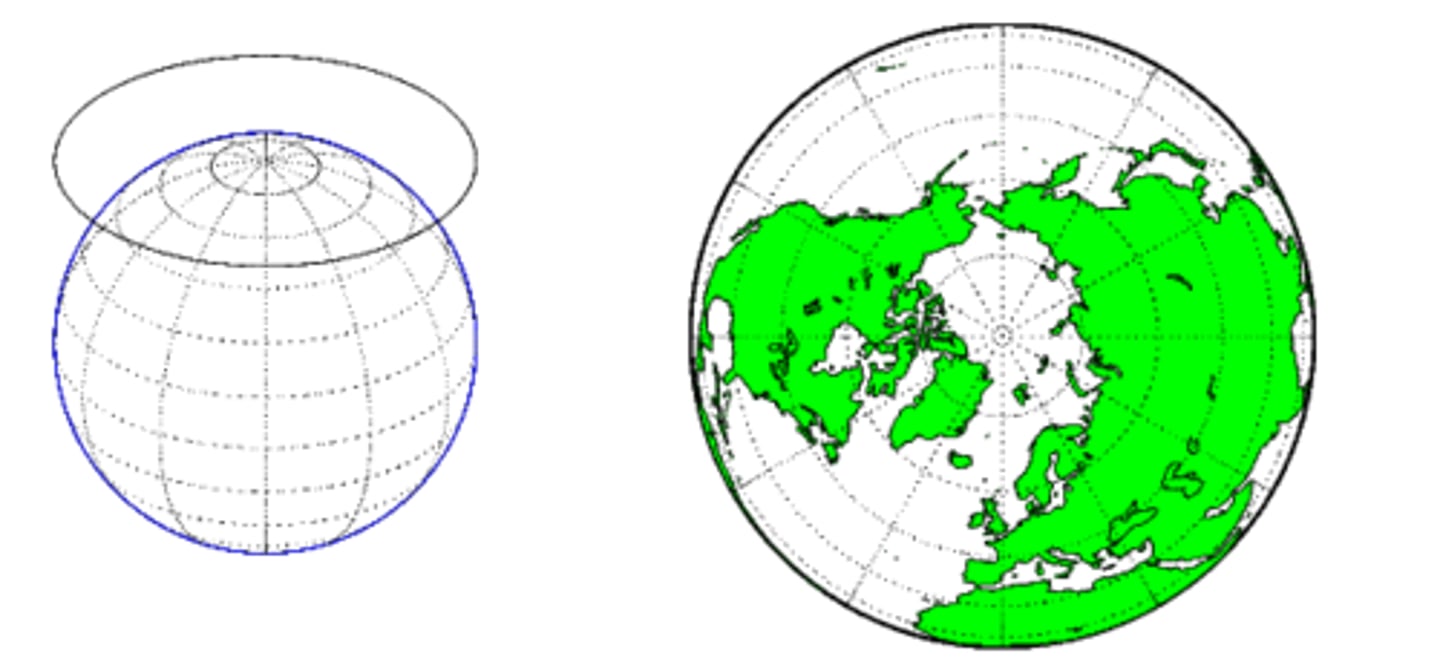
stereographic projection
- The stereographic projection maps all circles on a sphere into circles on a plane. It is a form of azimuthal/conformal projection. Its typically used for mapping polar regions and creating start charts for celestial cartography.
The Polar Stereographic projection
a form of stereographic projection, used particularly for measuring ice caps because it has minimal distortion at high latitudes
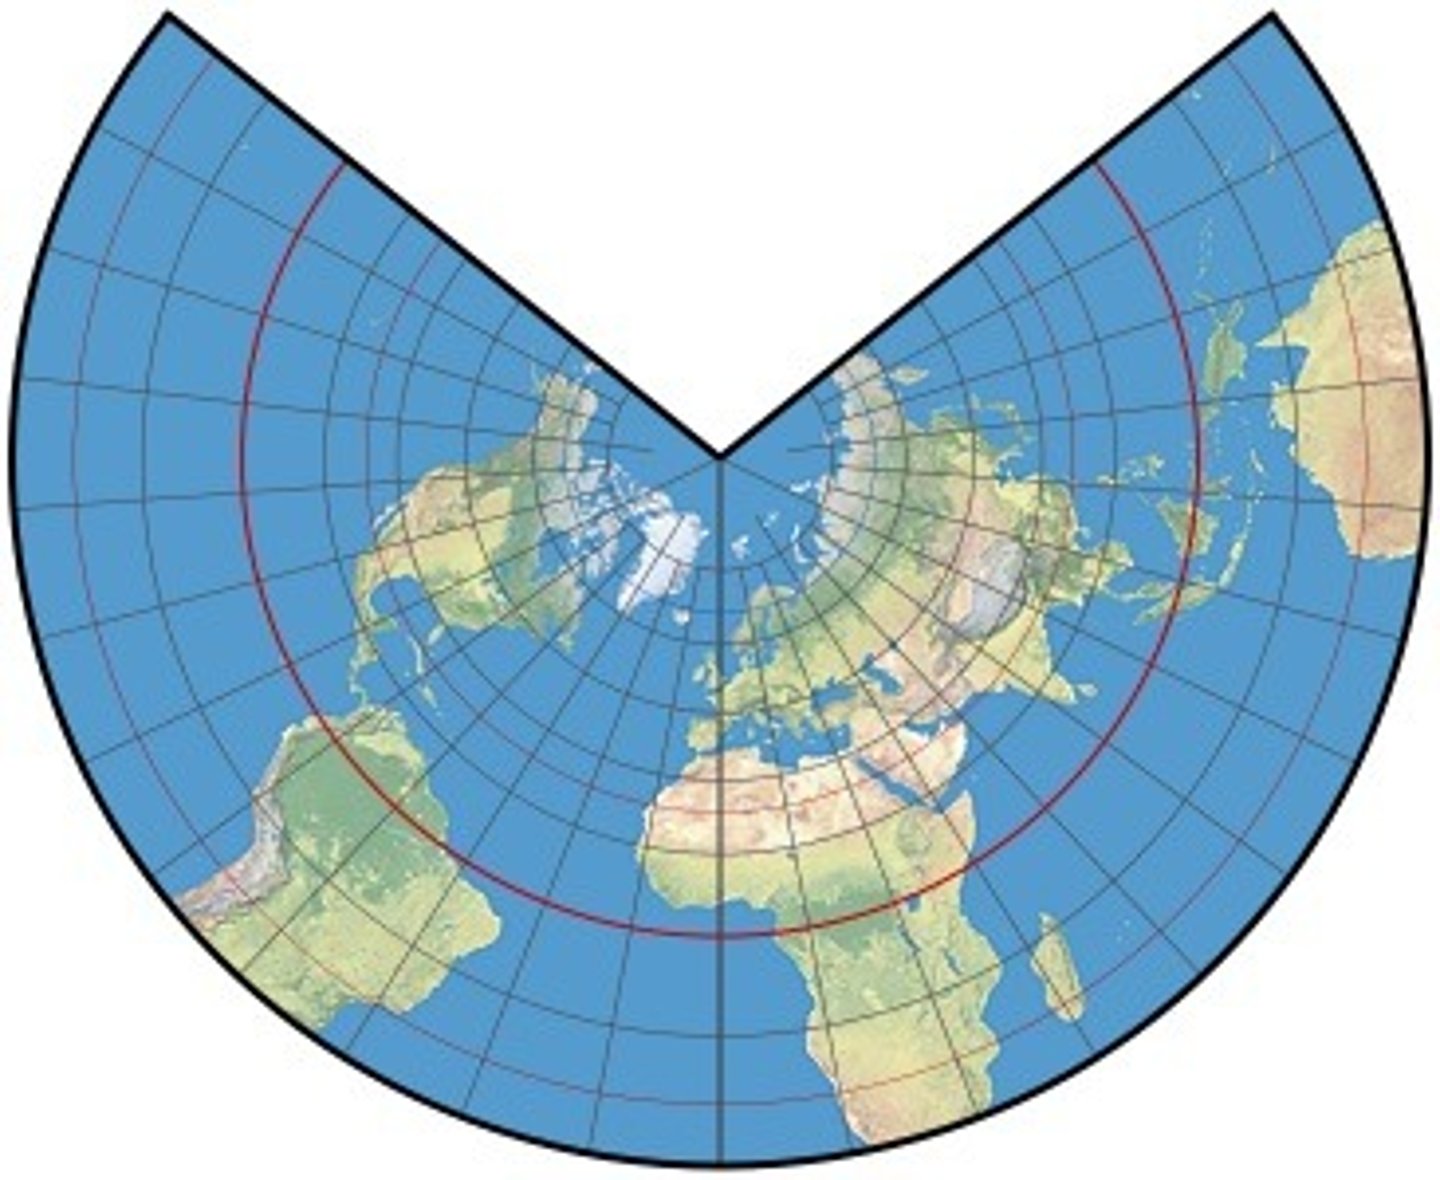
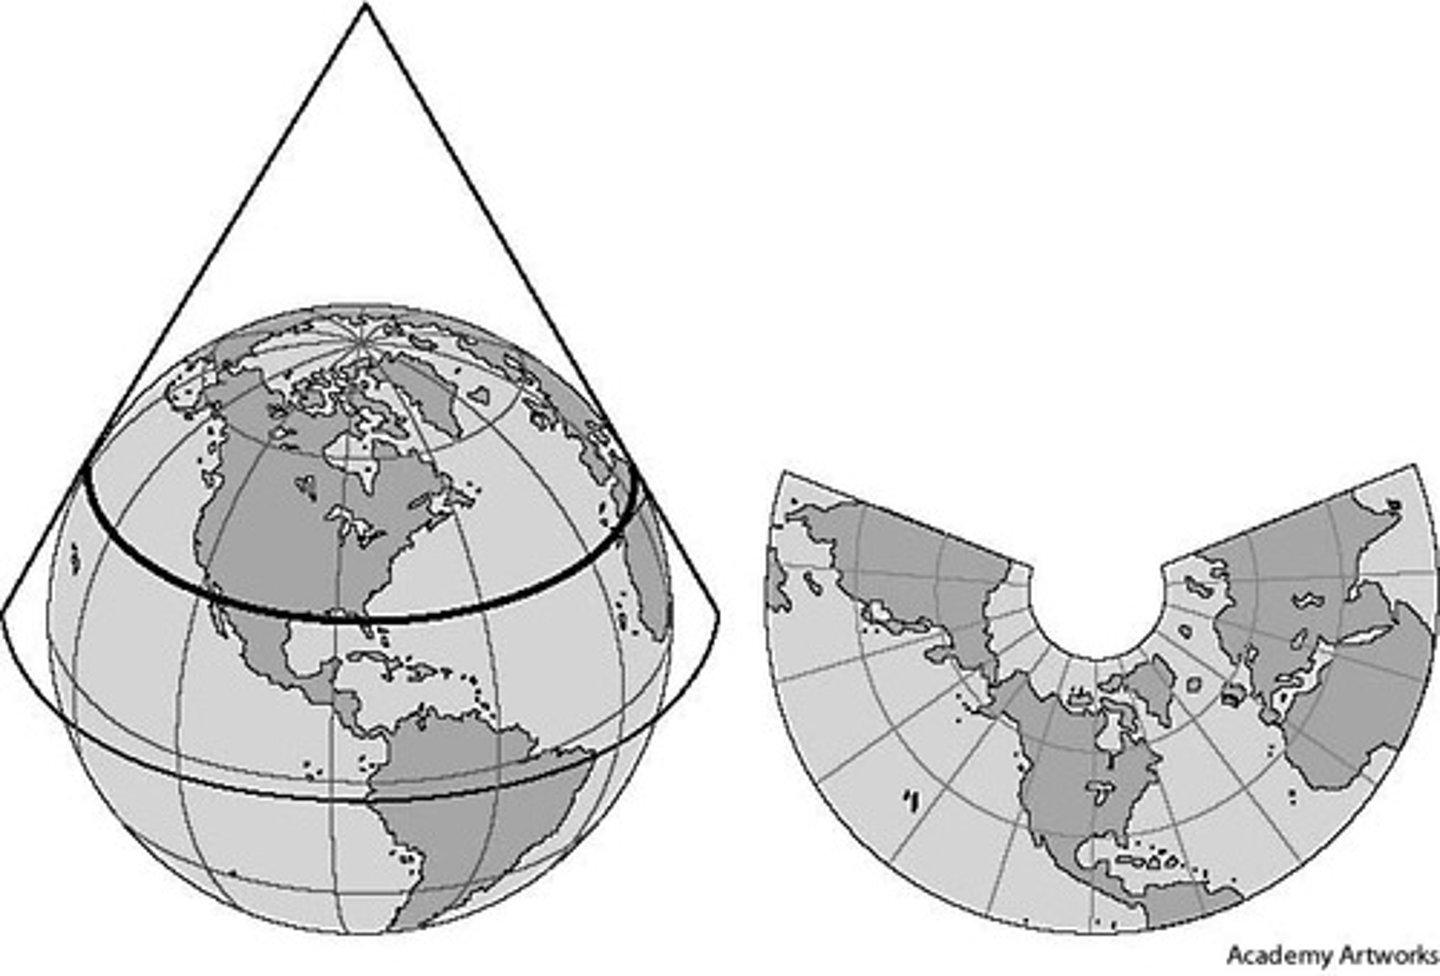
Lambert Conformal Conic Projection
- A form of conic map projection, it maintains accurate shapes and angles over small areas. It is mainly used for aeronautical charts and navigation.
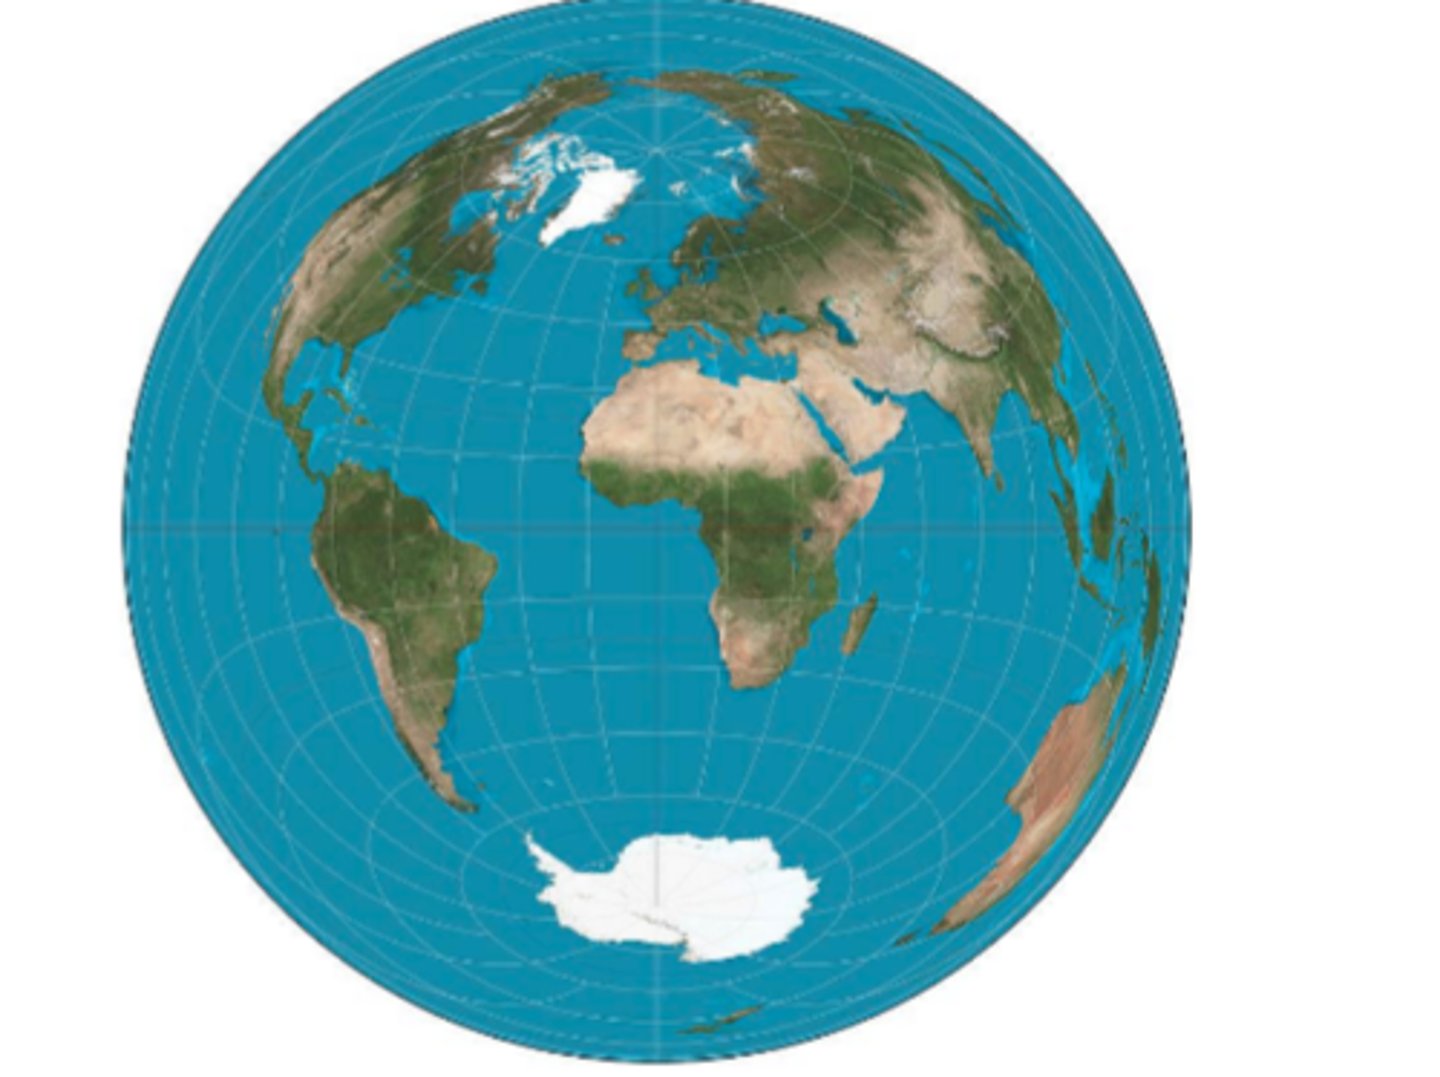
Lambert-Azimuthal Equal-Area Projection
keeps the area same, but severely distorts shape and direction
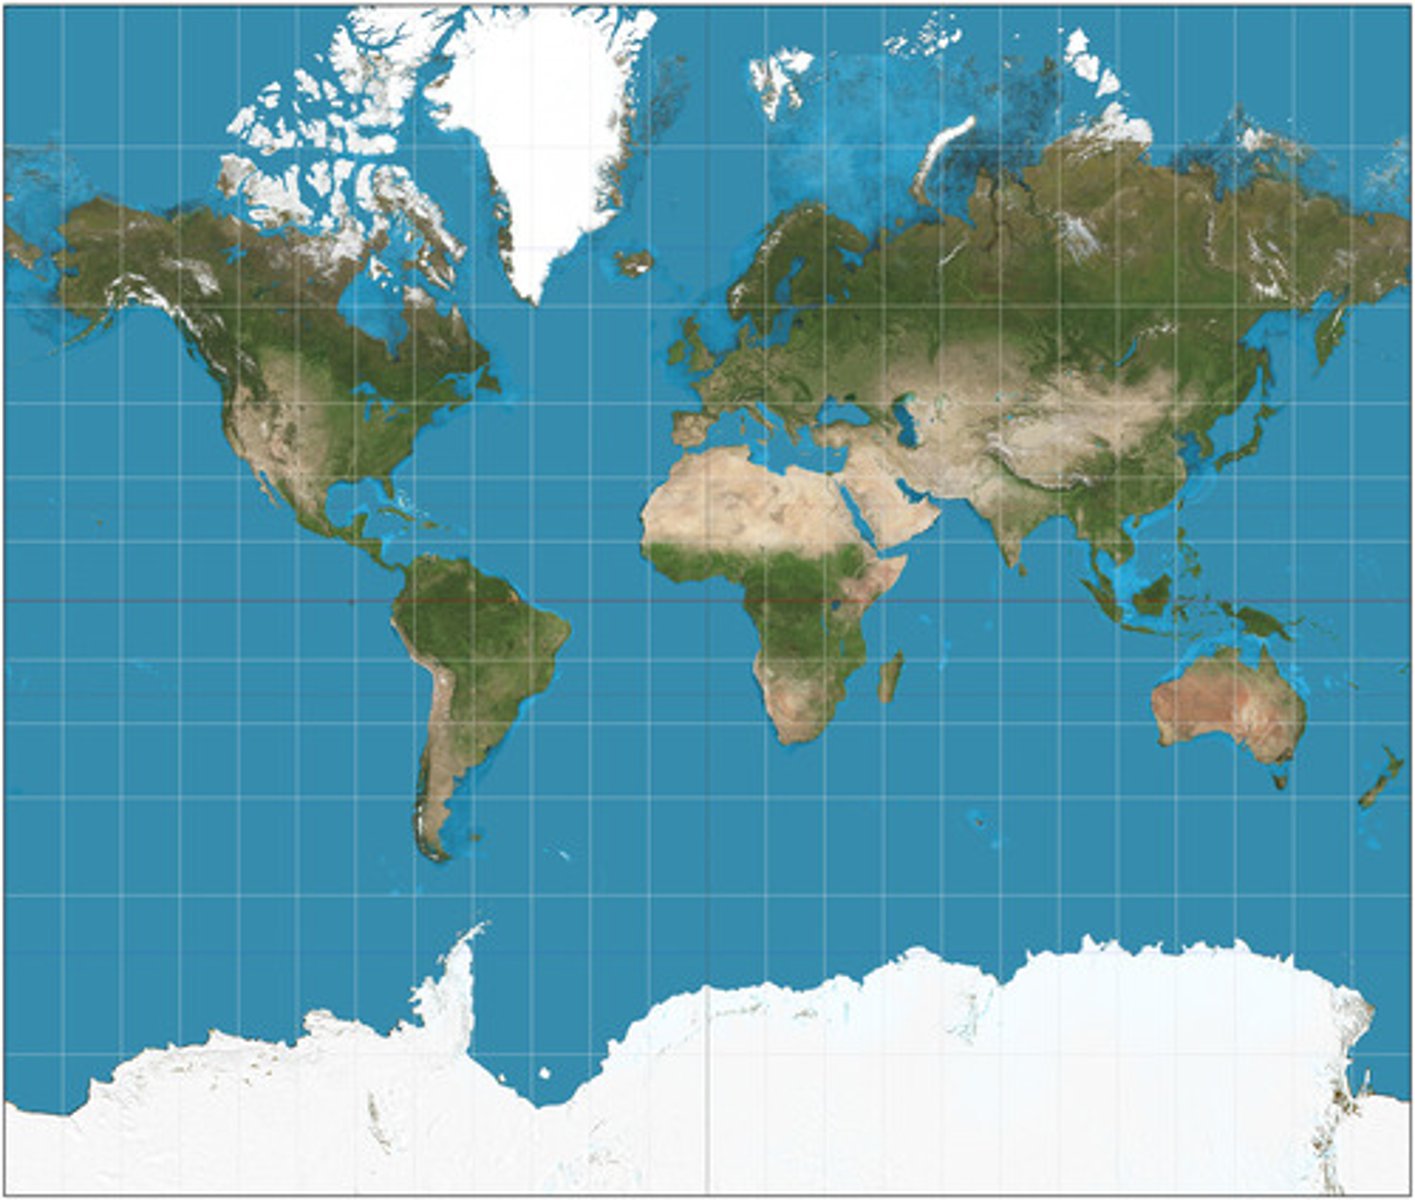
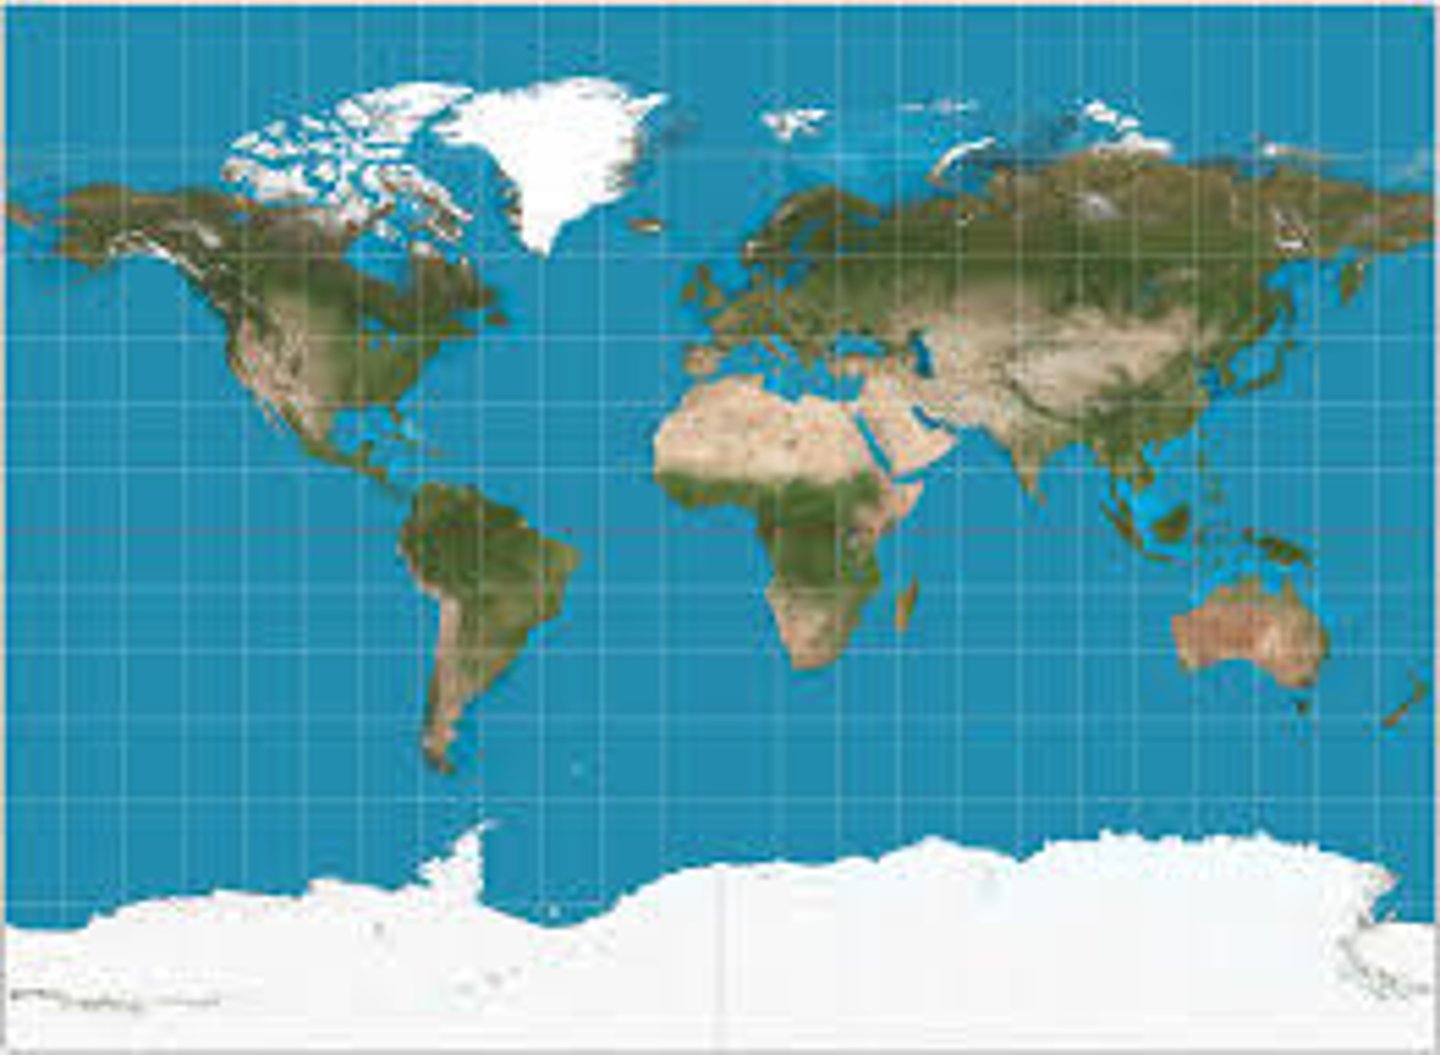
Mercator Projection
A form of cylindrical map projection invented by Gerardus Mercator in 1569. Appears like the traditional cylindrical map projection. Also includes the Transverse Mercator Projection - cylinder is wrapped so it touches the Earth at the poles. It is conformal.
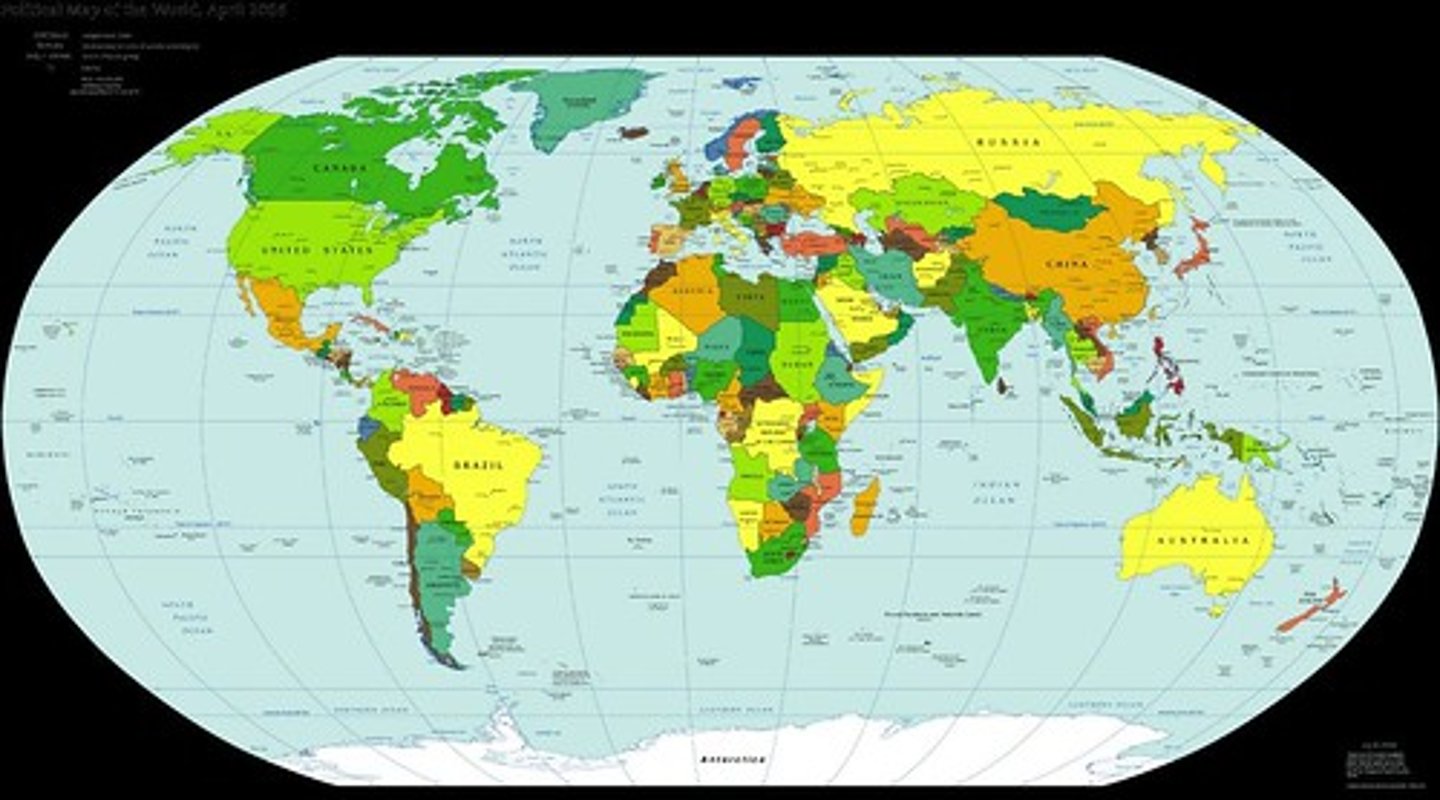
Robinson Projection Map
Most used map, shows distortions of every category to ensure map is well balanced - a type of compromise map, similar to the Winkel Tripel. It was used by the National Geographic Society until 1998.
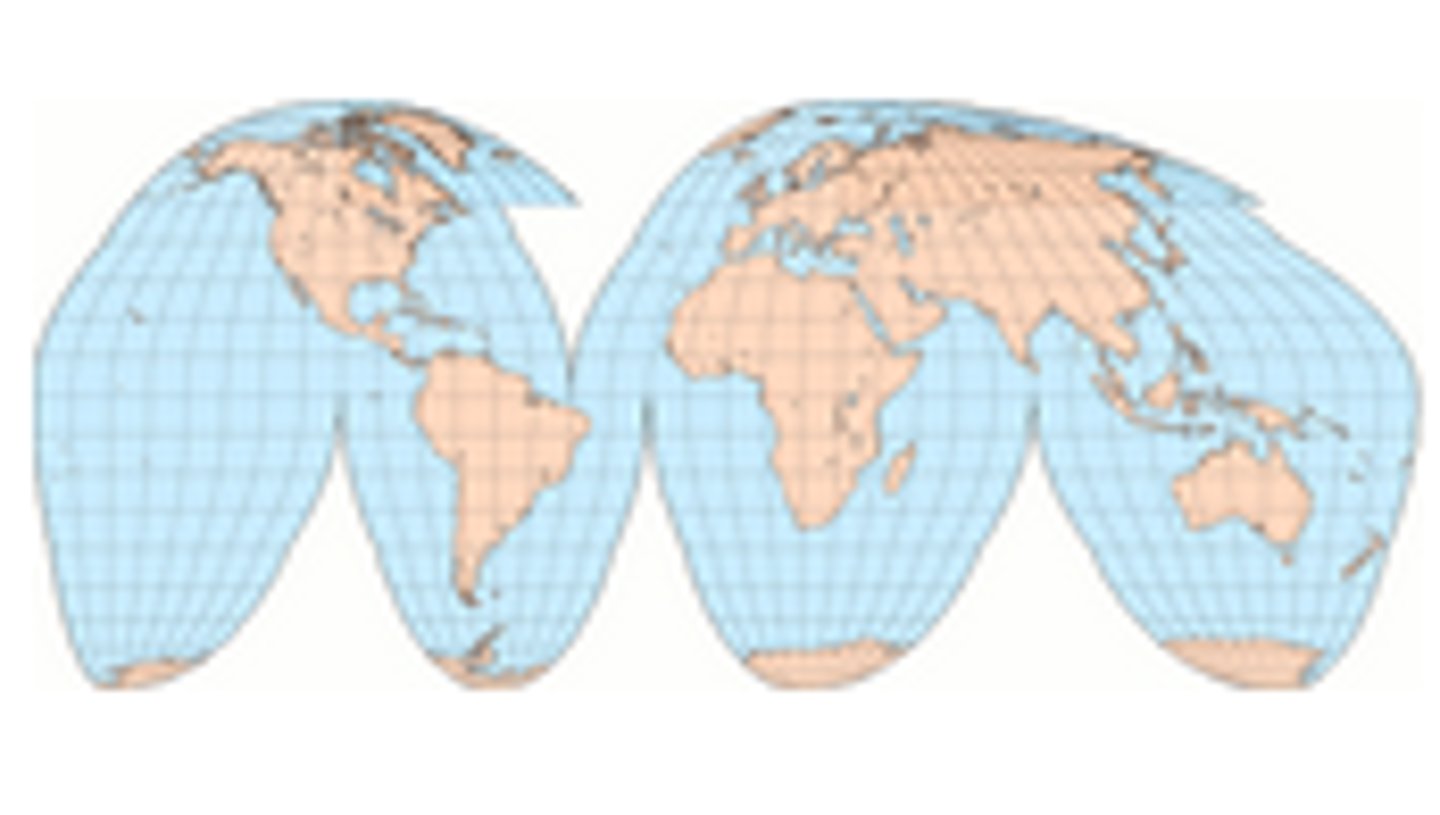
Good Homolosine Projection
a pseudocylindrical, equal-area, composite map projection used for world maps. Normally it is presented with multiple interruptions. Its equal-area property makes it useful for presenting spatial distribution of phenomena.
PROS: avoids shape/area distortion
CONS: interrupts continuity by splitting up oceans. not good for navigation.
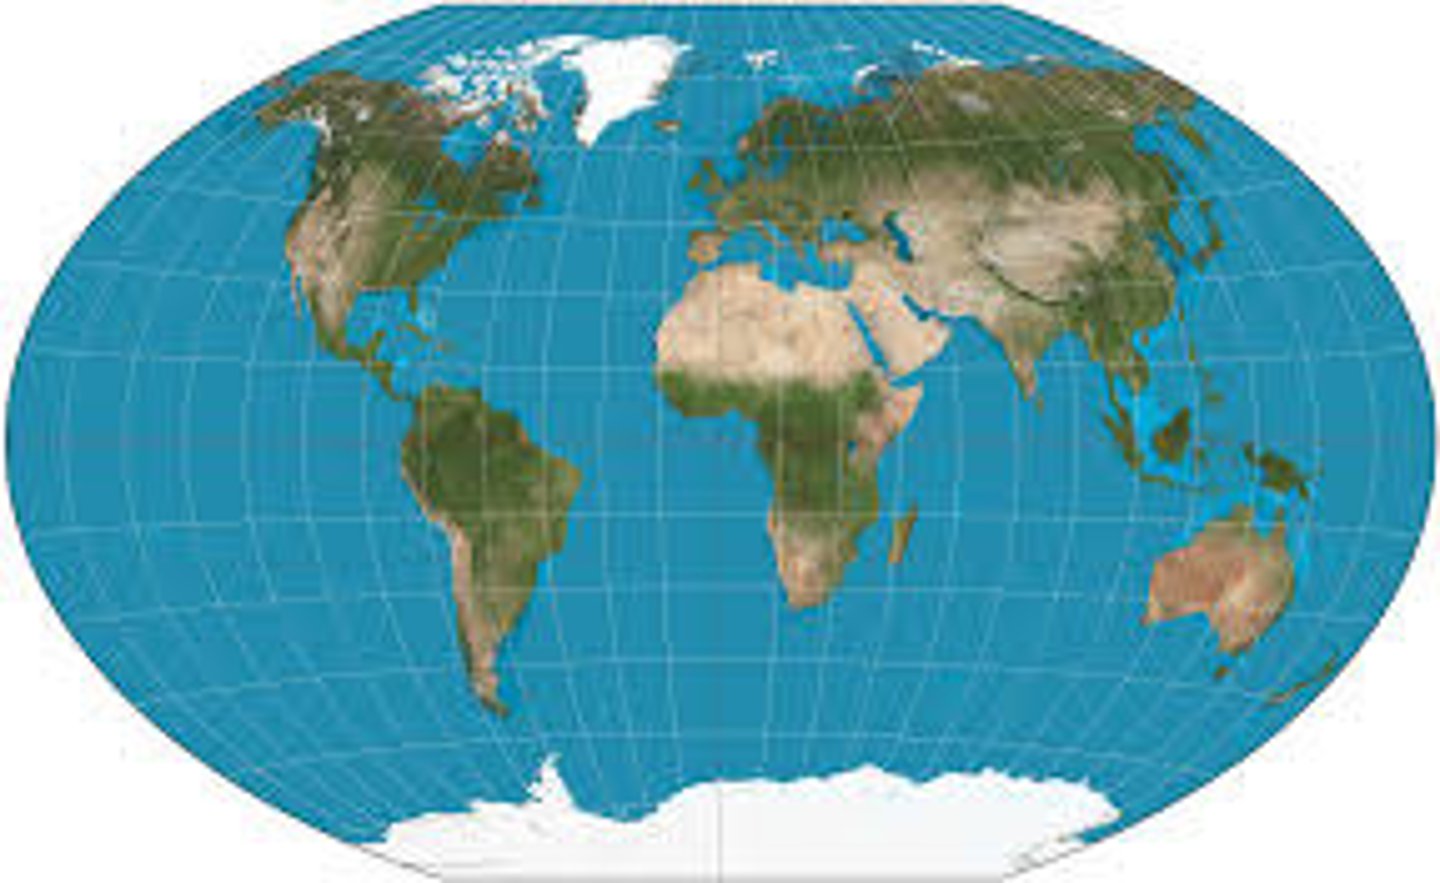
Winkel Tripel Projection
A type of compromise map similar to the Robinson. It was developed to be a compromise between distortion types (distance, shape, and area)
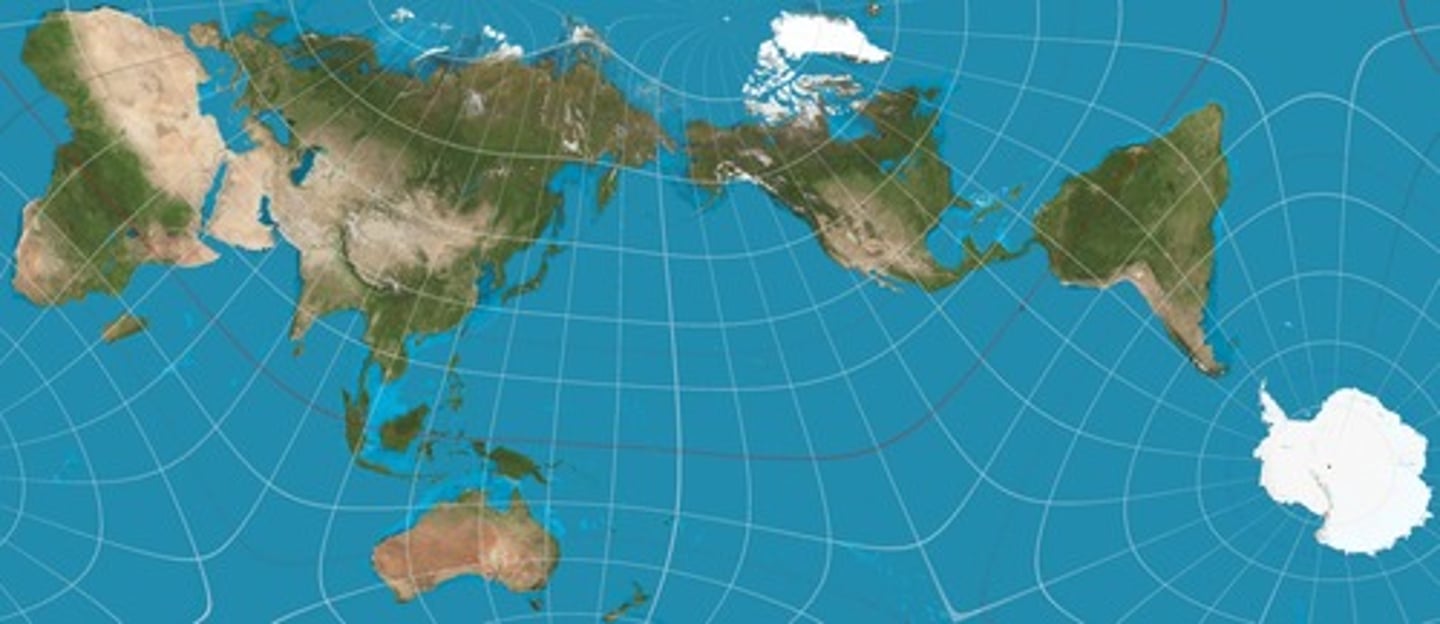
AuthaGraph Projection
Most accurate map projection, sacrifices map orientation for near perfect area and distance.
Miller Projection
Similar to Mercator projection, but spacing between parallels stops growing after 55 degrees.
Azimuthal Projection
Azimuthal projections involve projecting the Earth's surface onto a flat plane, typically tangent or secant to the Earth at a specific point. The main features of azimuthal map projections are straight meridian lines, radiating out from a central point, parallels that are circular around the central point, and equidistant parallel spacing.
conformal projection
preserves the correct angles of a 3d surface; transformation of one graph into another in such a way that the angle of intersection of any two lines or curves remains unchanged. Preserves the shape, but distorts the size.
Conic Projection
a map created by projecting an image of Earth onto a cone placed over part of an Earth model. useful for visualizing temperature regions, weather maps, climate projections
Cylindrical Projection
Cylindrical map projections are much like wrapping a large piece of paper around the Earth in a cylindrical shape. Resulting map is a rectangular shape. It has straight coordinate lines, running parallel to each other, forming a grid. They are good for comparing latitudes, however they provide a great deal of distortion at the poles. Distances at the poles seem much larger in comparison to reality.
What does Prabhakar Raghavan think should/will happen to maps?
"We have to conjure up completely new expectations and that takes altogether new ... technology underpinnings", essentially, that maps will have to evolve to suit younger generation's preference for "visually rich forms" of search and discovery rather than something on paper.
How is Google's search engine evolving to match younger people's preferences.
It is incorporating augmented reality, and has adapted to understanding voice queries, and is using more AI.
What is an example of distortion on the Mercator map
The size of polar regions is enlarged; Greenland looks larger than Africa
What is the Blue Marble photo credited with?
helping to inspire the environmental movement and with disrupting traditional maps by removing the longitude and latitude lines and becoming associated with the climate crisis
Who wrote "Pale Blue Dot: A Vision of the Human Future in Space"?
Carl Sagan and Ann Druyan
What does the following quote by Carl Sagan and Ann Druyan as well as your research tell you about how they thought of the Earth?
"Look again at that dot. That's here. That's home. That's us. On it, everyone you love, everyone you know, everyone you ever heard of, every human being who ever was, lived out their lives. The aggregate of our joy and suffering, thousands of confident religions, ideologies and economic doctrines, every hunter and forager, every hero and coward, every creator and destroyer of civilization, every king and peasant, every young couple in love, every mother and father, hopeful child, inventor and explorer, every teacher of morals, every corrupt politician, every 'superstar,' every 'supreme leader,' every saint and sinner in the history of our species lived there - on a mote of dust, suspended in a sunbeam."
They thought of the Earth as very small, that everything humanity is and experienced ever was, is all trapped on a very VERY tiny piece of rock floating in space. That we are so much more insignificant than we, as a proud species, thinks.
Carl Sagan challenges the idea of our preconceived ideas of some "privileged position in the Universe". He presents the idea of another perspective on our world, that we should cherish it because it is the one place we have.
"Our planet is a lonely speck in the great enveloping cosmic dark. In our obscurity, in all this vastness, there is no hint that help will come from elsewhere to save us from ourselves."
How does where we see the Earth influence our perspective of how we think of it?
It appears that the farther and smaller Earth is in a photo, the less space we as humanity take up. The opposite happens the closer we zoom in.
From space we see the Earth:
- Without the invisible markers
- The idea of unity as an entire planet, instead of just a piece of land with separate countries and continents,
- We're just small things on a small planet among a very large universe
- The perspective shift in the size of continents (e.g. Africa is actually very large, in comparison to what the Mercator map tells you)