Research Methods B
1/161
There's no tags or description
Looks like no tags are added yet.
Name | Mastery | Learn | Test | Matching | Spaced | Call with Kai |
|---|
No analytics yet
Send a link to your students to track their progress
162 Terms
How do you summarise data?
Large sets of numbers are hard to learn from
Need to take steps to simplify and summarise numbers into something digestible
e.g. making a frequency table or plotting a chart where height of each bar tells us frequency
What are histograms used for?
Histograms are used for continuous data (e.g. in reaction times then the number can be measured to any precision and there aren't discrete categories for numbers like there are in dice rolls).
Simplify visualisation by splitting x-axis into a set of bins so each bin covers a set range, for example..
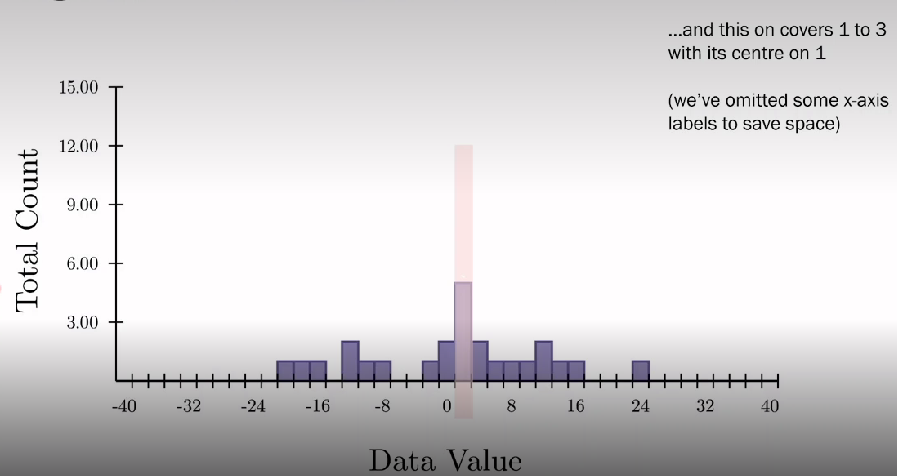
What are bins in histograms?
Data point is added to bin corresponding to its value. Each data point in the dataset is added to its bin until the whole dataset is displayed. Gradually see the shape of the distribution appear as more data comes in. the final shape of distribution is informative as we can see the values of 0 occur regularly and +30 to -30 is rare
Choose how many bins to split our data value range into as too few bins is uninformative but too many can get noisy. Sweet spot gives us resolution in x-axis without giving noise in data
Some histograms show total count on y-axis and others a normalised proportion - looking at proportion of all responses. This isn't critical, the important part is the shape so some programmes don’t label y-axis
What does a symmetrical distribution mean?
When there's a symmetrical distribution and change the mean, the shape of distribution stays the same but the centre of mass shifts to the highest bar occurs where the mean is
What does a change in variance do to the shape of distribution?
Change variance - this stretches or compresses the data set to reflect the values in the data set occurring from wide or narrow range of values
What is skewness in distribution?
Skewness (symmetry); negative skewness has long tail that points towards negative values in data set
What is kurtosis?
Kurtosis - peak goodness of our data sets so a data with high kurtosis will have sharp peak VS low kurtosis have wide tails
What are normal distributions?
Normal distributions, fat-tailed distributions, skewed, uniform, bimodal, triangular, decaying. Important thing is to know how to recognise and know how to best summarise and which stats are appropriate to use with data distributions
What are hypothesis?
A proposed prediction abt a phenomenon
A scientific hypothesis is a testable statement making a prediction from previous data or theory
Scientific process - generating and testing different hypotheses
Statistics are formal methods for comparing different hypotheses using data
What is the null hypothesis?
How would our data look of there was no effect and everything was down to chance?
We need something to compare our hypothesis to
This is typically a description of how the data would look if there was no effect at all
Stats tests work to reject the null hypothesis, if the null hypothesis is not supported by the data then we accept the experimental hypothesis
What are experiments?
Scientific procedure used to test a specific hypothesis
An experiment is when manipulate something in a controlled way to see its effect on something else
Manipulate a variable to see its effect on another variable
Sometimes the data to test a hypothesis may already exist, but often we will need to design an experiment to test it.
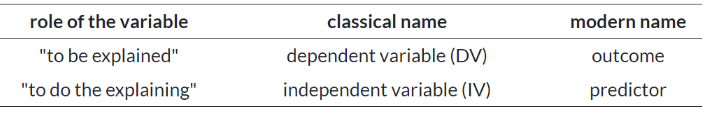
What is the role of variables?
Different variables have different roles within an experiment
Manipulate on variable to see its affect on another in an experiment
Dependent or independent variables - or outcomes and predictors.
We may have more than one outcome or predictor in a single study
Give an example of an experiment
Experimental hypothesis - revising with background music leads to lower marks in the exam
Null hypothesis - revising with background music doesn’t lead to lower marks in the exam
Experiment: DV - exam marks, IV - revision method (music or no music)
Between grp comparisons, one grp revises with background music and other in silence. Compare exam marks
If the grps have the same marks, then we accept null hypothesis, if not we accept experimental hypothesis
But how do we know if the groups are different or not?
What are statistics?
Enable us to make comparisons based on data and to tell whether a hypothesis is supported by the data
Test statistic: a value that quantifies how close the data are to the null hypothesis
P-value: the probability that a particular test statistic could occur, if the null hypothesis is true
If the test statistic is small and likely to have happened by chance, then we can accept the null hypothesis
If the test statistic is large and very unlikely to have occurred by chance, then we can accept the experimental hypothesis
Statistical tests allow us to describe data and test between hypotheses
What are datasets?
Data sheets represent variables and individuals
Variables are in columns
Dataset - a collection of data acquired for a specific purpose, may relate to multiple experiments or hypothesis e.g. collected by gov
What are variables?
Variable - a number that can vary e.g. take a high or low value depending on an attribute that were trying to measure. Typically measure several variables from each pps. These form one column in a data file
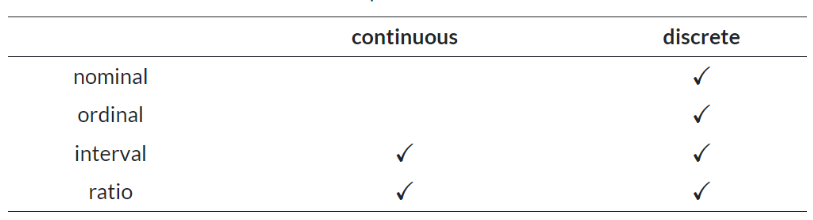
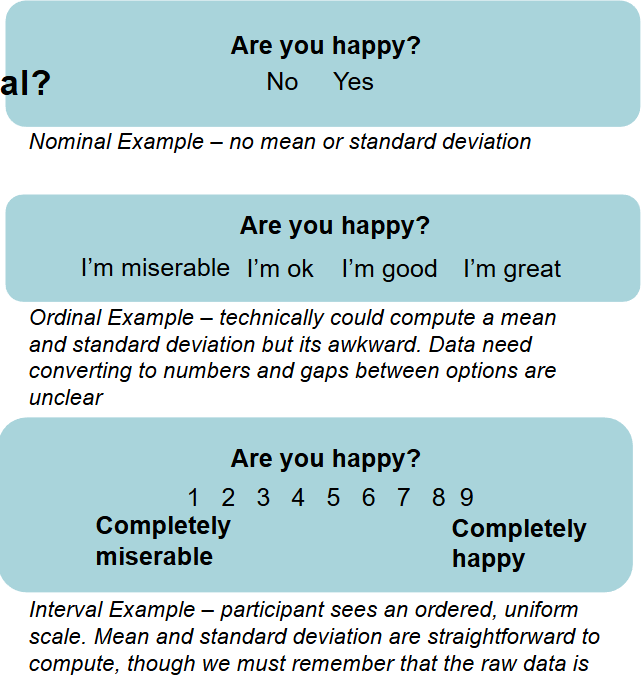
What is nominal data?
No relationship between different possibilities in scale, sometimes called categorical e.g. country of origin. Just count ppl in certain categories, no sense of order (nominal = naming, categories defined in words)
What is ordinal data?
A natural order between possibilities but nothing else, cant interpret magnitude of differences e.g. Likert scales where we know the order of strongly agree to strongly disagree but cannot know the magnitude between the different responses
What is interval data?
The possibilities are ordered and have interpretable magnitudes though zero doesn’t have a special meaning e.g. temperature, 0 degrees doesn’t mean no temp it means freezing
What is ratio data?
like interval data, but now zero is directly interpretable and we can interpret ratios between values e.g. owning books as you can have no books
What is continuous data?
a variable that can change freely to take any value e.g. temperature could be 4 degrees, 10.34 degrees or -0.00015
What is discrete data?
a numbered variable that takes one of a fixed set of values e.g. number of cars owned
How do you choose measurement scale?
A persons true height is continuous and ratio as it is an attribute which has an exact value with an interpretable zero that we could measure to any precision
However, if an experimenter chooses to record height to the nearest centimetre, then that variable would be discrete and ratio.
If an experimenter chooses to record only whether the person was tall or short, then the variable would be discrete and ordinal
Labels aren't fixed, they are only a guide
What are latent and observed variables?
We cannot directly see many of the things were interested in
Latent variables - variables that can only be inferred indirectly through a model from other observable variables that can be directly observed or measured
e.g. we can assume something called quality of life exists for each individual, but we cannot measure it directly the same way we measure a physical quantity. Its inferred from observed variables we can directly measure e.g. health, financial stability, social support
We must take care when researching latent variables - what's actually been measured, is this observed variable a good proxy?
We often must used observable factors as a proxy for important latent variables, but it can be difficult to do this well
It might be that the best observed variable depends on practicalities and the desired outcome of the project
What are the components of the PPDAC model?
Problem
Plan
Data
Analysis
Conclusions
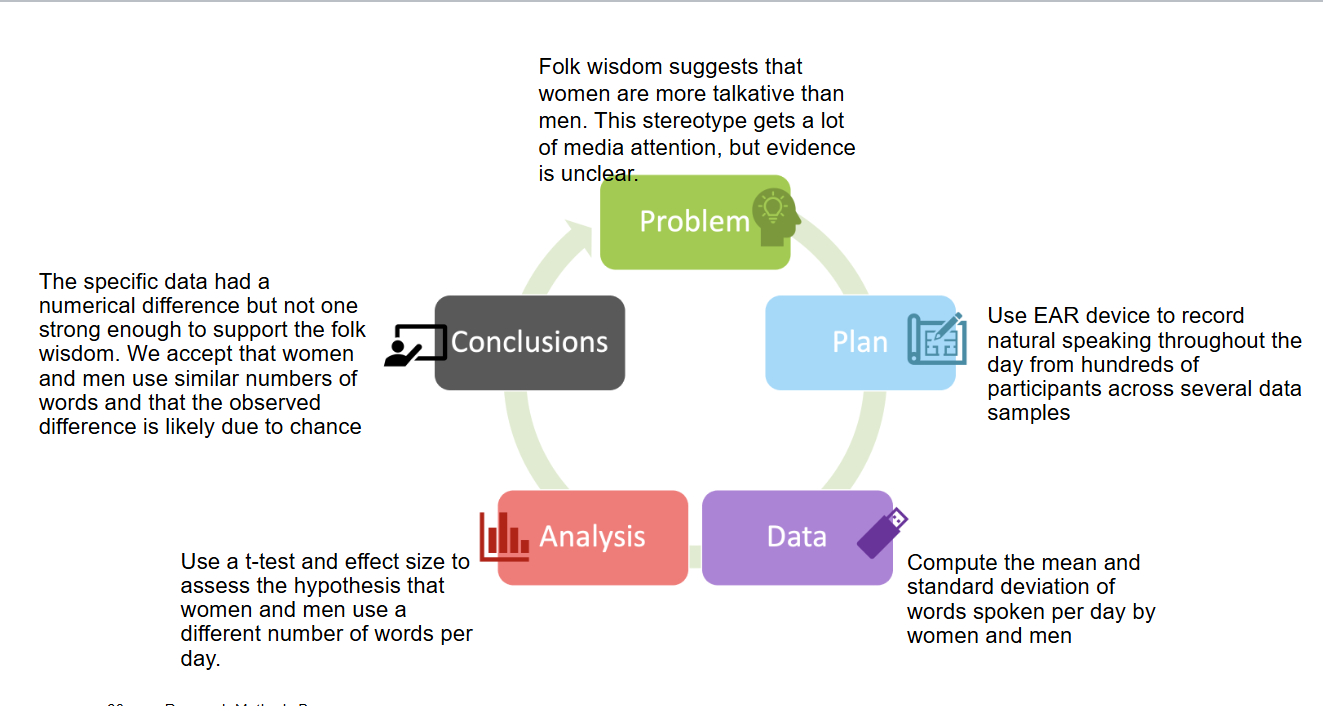
What is the problem area of the PPDAC model?
identify the right question to answer. Motivations: societal needs, scientific theory, personal interest. Considerations: impact, interest, feasibility
What is the plan area of the PPDAC model?
what is needed for the answer and how will you make it happen? What are the hypotheses? How are they justified? Is there existing data? What experimental paradigm? Who/where/when to collect new data? Ethics and consent
What is the data area of PPDAC model?
recruit pps collect data and store it safely. How to collect data and store it methodically, how can we check for and ensure data quality, do we need pseudo or full-anonymisation of data?
What is the analysis area of PPDAC model?
process data and compute statistics. Do you need to preprocess data, what stats tests answer the question, how to check the assumptions of those tests?
What is the conclusion of PPDAC model?
summarise, evaluate and communicate. Explain and interpret answers, have we answered the question, what could have been better? Communicate results. Motivate new questions
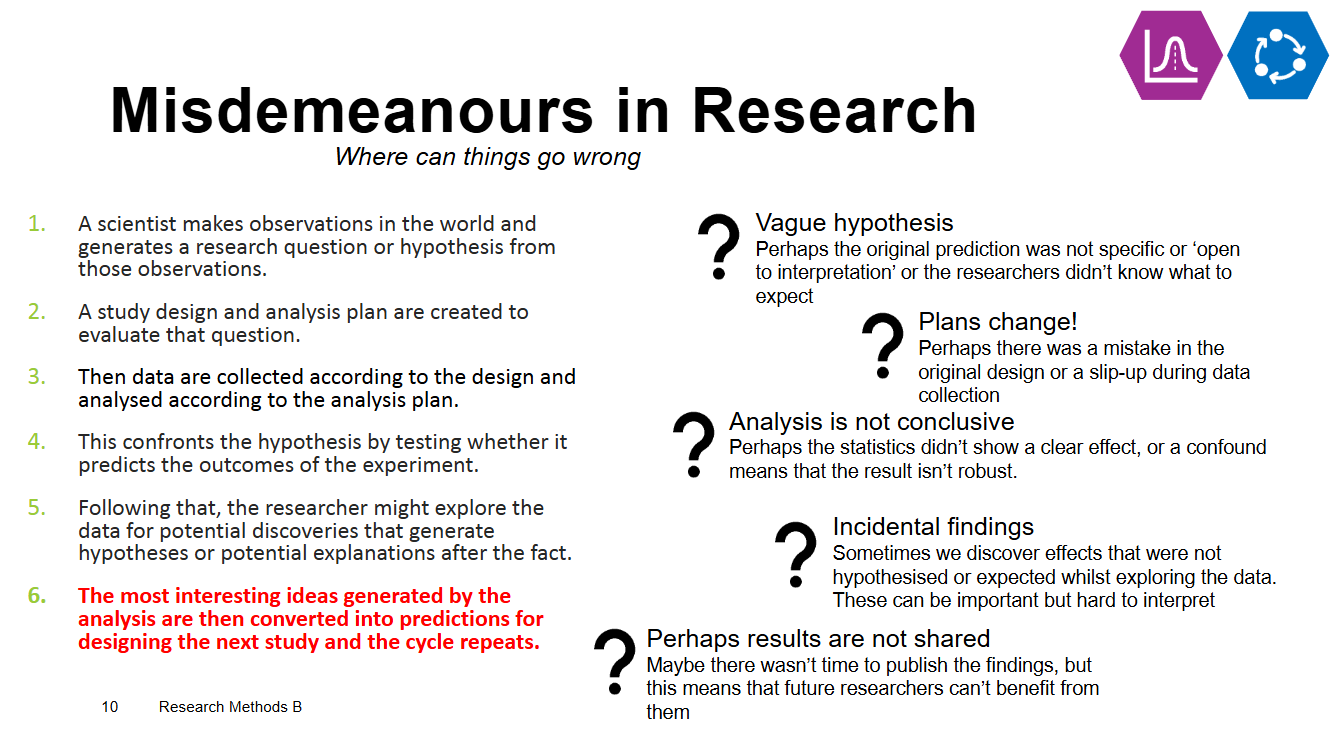
What is the research process?
Research is a process of active problem solving. Its a cycle where work is built on previous research and informs the next. Research methods involves thinking through the whole process - not just the stats
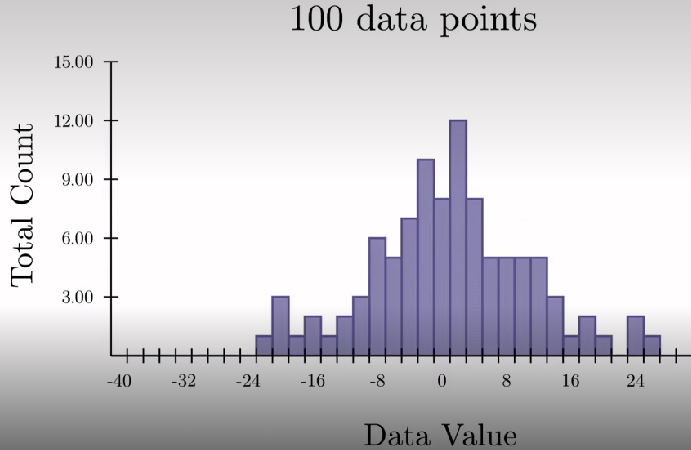
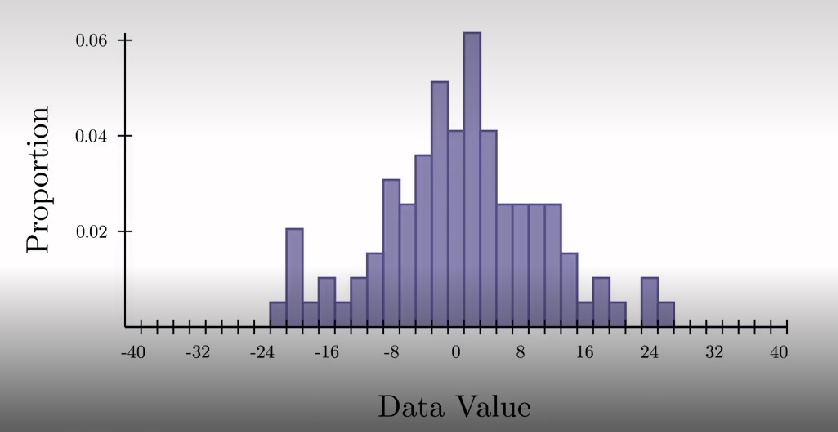
How are distribution scores presented in a histogram?
Mean around 0
Variability is around +-8
+-30 is extremely rare
Data sample from 100 pps
Questions is do these pps represent the entire population they were drawn from
Sample is data we collected but population is theoretical quantity representing distribution we would've seen if we could've collected all possible data from entire population interested in
We have a random subset of the full population were interested in, by chance or small biases, that random sample may not well describe wider population
Less of issue with large data sets as represent population and other samples more closely, more sample.
Want to quantify how well sample matches the population and how well stats made from sample can be generalised to entire population
How do observed data distribution and distribution of sampled means help understand data?
Top has observed data distribution, sample with 20 observations from population with SD of 6. from the sample, estimated mean as 9.71
Bottom histogram shows sampling distribution, the value is the estimated 9.71 mean
When drawing more data samples, a new mean is estimated which is then added to the bottom histogram
Helps understand how reliable the data from one sample is
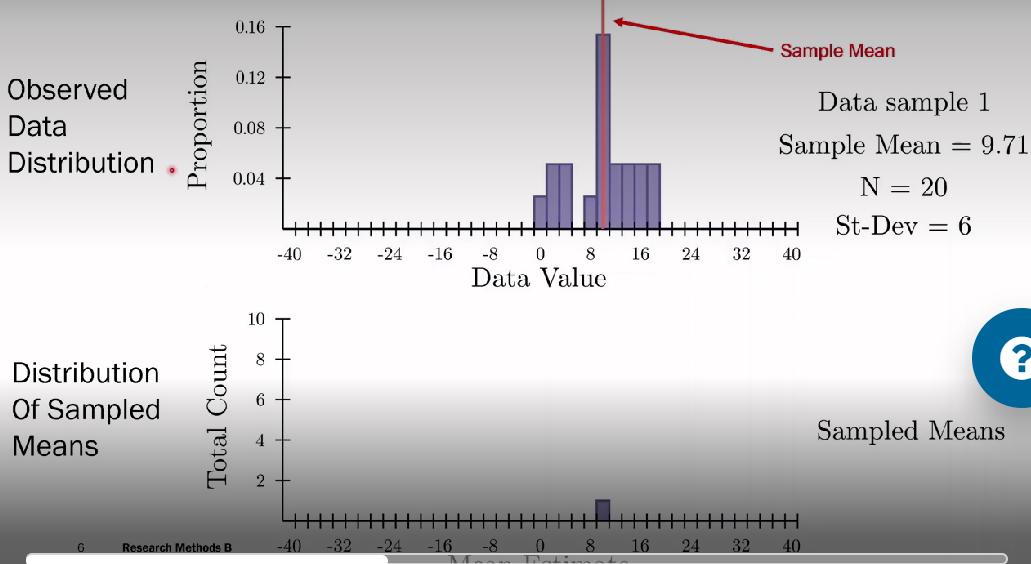
What is the standard error of the mean?
Standard deviation of the sampling distributions e.g. 1.34 in this example
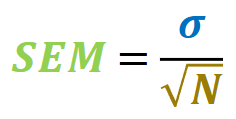
Computing SEM: dividing the standard deviation of the data by the square root of the number of samples (width of data distribution as proportion to square root of number of data we have). Used as short cut if data normally distributed and useful bc its rare we can take repeated samples from a population.
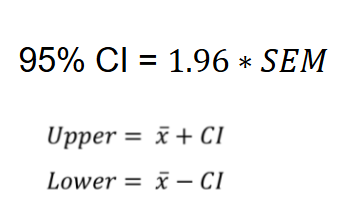
SEM is hard to interpret, a more intuitive measure is for confidence interval (defines range of values that have certain percentage chance of containing the true population mean e.g. calculate 95% confidence interval by multiplying standard error by critical value and then take the mean plus confidence interval and mean minus confidence intervals to give a set of intervals that have a 95% chance of containing the population mean
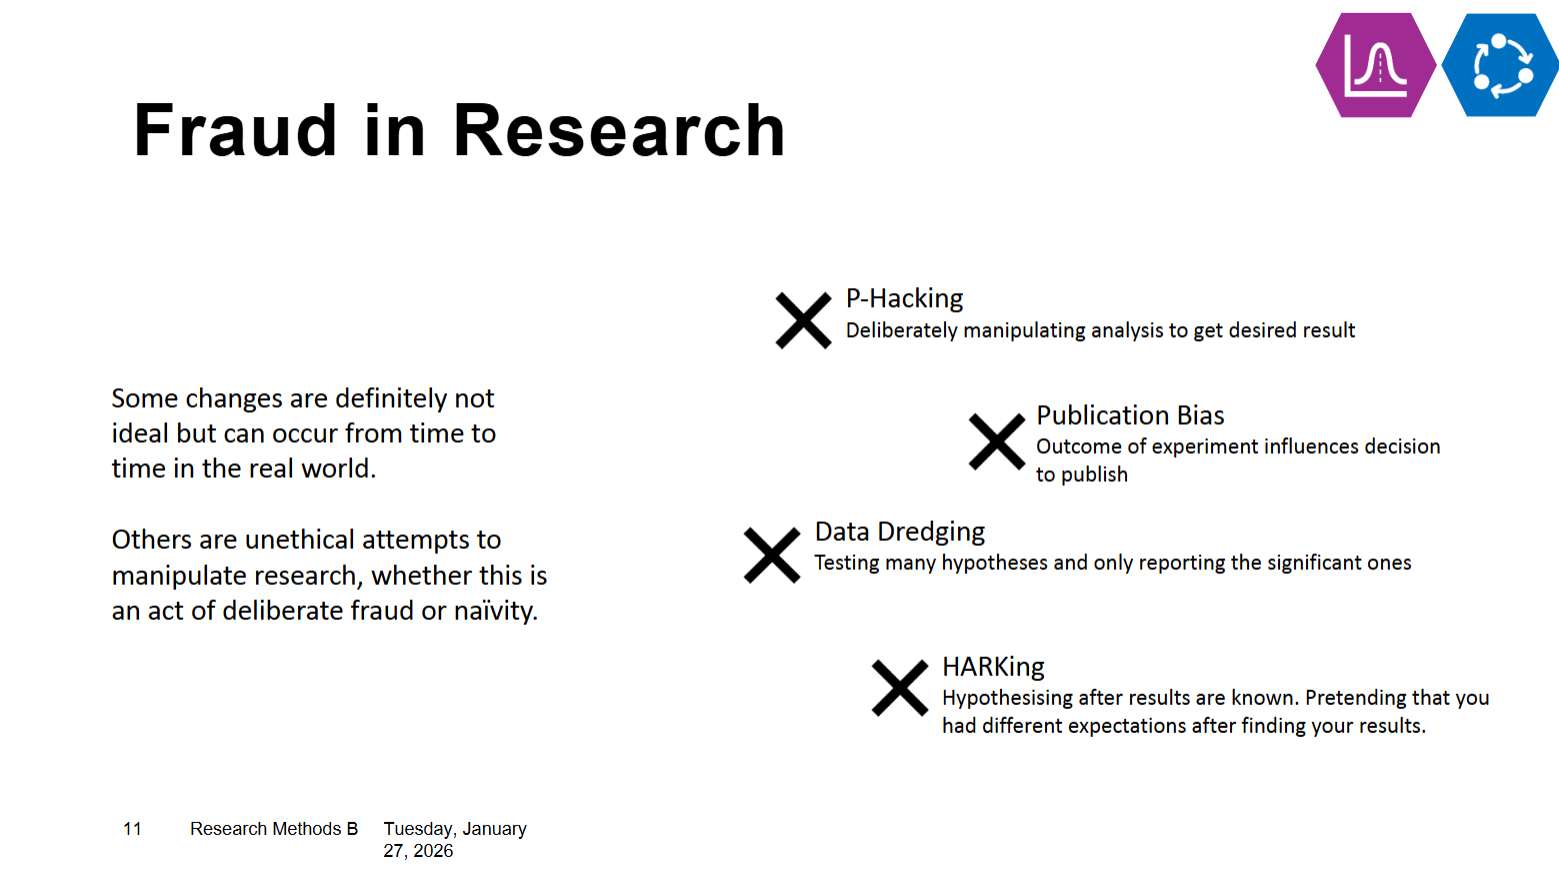
What are misdemeanours in research?
What is fraud in research?
Summary of histograms
A histogram represents the sample distribution of our value of interest, theres an underlying population distribution we cant directly measure
Each sample we measure is an approximation of the underlying population
Taking different samples from different populations may show different results bc of individual differences, sampling uncertainty etc cause different results
Bigger samples tend to give more accurate approximations
We use histograms to represent the distribution of a data sample
We can use the distribution of data samples to approximate the pop distribution
What is sampling?
A population is the total set of everyone within a grp that we want to test e.g. all primary school children in UK
But we cant test everyone, we can only take a sample from our population
Sometimes population is more accessible than other times e.g. wanting to test ppl with same condition may have a list of all ppl in UK with that condition = population accessible
The issue is that there is lots of additional variability (heterogenous) within populations that we cannot control
We might get lucky and find a sub-sample that properly represents the population
But its more likely we get a sample that has some form of bias - ppl with certain traits may be overrepresented in the sample compared to the population
Aspects of bias might be to do with factors were not aware of - don’t have right to ask for all possible info from pps so cannot control for everything
What is random sampling?
recruitment done completely by chance, pps selected at random from list
What is systematic sampling?
structured approach to selecting pps, e.g. every 5th pps selected from list
What is opportunity/convenience sampling?
recruitment from ppl closest and or most accessible to experimenter e.g. pps who attend that days lecture
What is stratified sampling?
recruitment aims to match key characteristics of target pop e.g. pps grp that matches known age, sex
What is cluster sampling?
whole grps are recruited at once, can combine with other methods e.g. whole uni football team recruited at once
What is ecological validity?
Do the variable and conclusions of a study sufficiently reflect the real-world context of its population?
If were only writing abt a specific population then perhaps its appropriate to recruit a homogenous sample e.g. elite athletes
If we want to draw conclusions abt very broad pop, perhaps even all humans, then a narrow sample is unlikely to be appropriate
How does sample size link to ecological validity?
Small sample size doesn’t necessarily mean its bad e.g. when only studying athletes might be fine but if studying everyone its too small. Sample size accuracy is relative. Links to ecological validity, right in more detail in research reports (don’t just put small sample)
What are ethical issues over sampling?
Biased or poorly considered sampling can lead to ethical concerns
It can reinforce inequalities and marginalise certain grp
Psychologists should avoid unfair, prejudiced or discriminatory practice, e.g. in pps selection or in research content.
Should accept individuals may choose not to be involved in research or mat wish that their data be withdrawn.
Are alert to possible consequences of unexpected as well as predicted outcomes of their work and acknowledge the often problematic nature of the interpretation of research findings. (BPS code)
What is a normal distribution?
A special distribution with some convenient properties
It can be summarised by 2 parameters - the mean and the standard deviation
What is the standard normal distribution?
A special case of the normal distribution in which the mean is zero and SD is 1
How can you assess the normal distribution?
Many stats test makes use of assumption that our data is normally distributed, this simplifies a lot of calculations - parametric tests
There are alternatives if data not normally distributed but we typically start with parametric tests
Assessing the shape of our data distribution and whether it meets parametric assumptions is a good first step in analysis
What is the shapiro-wilk test?
Provides and objective test for whether data is normally distributed
Shapiro-Wilk W - metric indicating how 'norma' the data is, higher values indicate more normal data
Shapiro-Wilk p - a probability indicating how significant any difference from normality is
Are likert scales ordinal or interval?
The critical factor is - does the data have a meaningful mean and standard deviation?
Ordinal data doesn’t have interpretable mean as its value depends on how we have coded the values
Interval data is more inherently numeric and does have a meaningful mean and SD
This can be ambiguous and sometimes theres no perfect answer
This can be difficult as researchers make lots of decisions when presentign questions. Some of these examples might be more naturally ordinal and some interval.
Did pps see numbers or words? Were the numbers presented continuously?
Individual questions are often ordinal
Scores aggregated across several single items are often interval
What is the standard error of the mean?
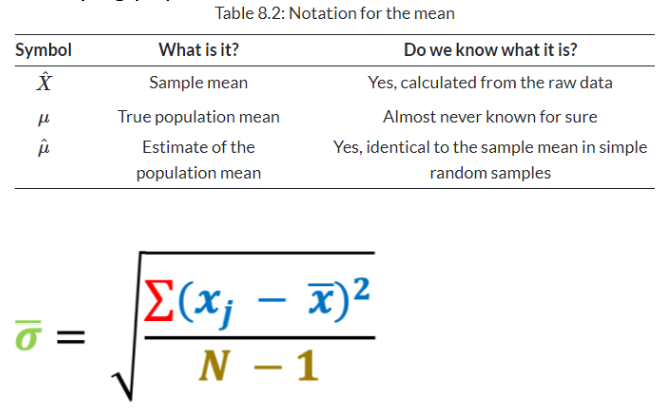
The sample mean is the sum of all the individual data points divided by the total number of data points
Each sample only gives an estimate of the true mean. We cant directly measure the population mean in most cases. The best we can do is estimate how close our sample mean might be to the underlying population mean
The sample standard deviation is the square root of the sum of the squared difference between the sample mean and each individual data point divided by the total number of data points minus 1
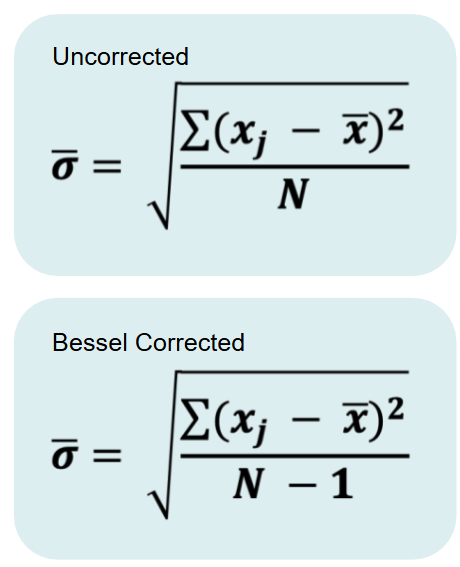
What is Bessels correction?
Why do we need to minus 1?
Estimates of the population mean from a sample might be wrong, but they are equally likely to be too big or too little
Estimates of the population standard deviation are biased, they are nearly always too small
Bessels correction makes the estimated SD a bit bigger to account for the bias
Jamovi always give corrected estimate
What is the standard error of the mean used for?
The standard error of the mean is the standard deviation of the sample divided by the square root of the total number of data points
The Sem is the likely variability in our estimate of the population mean from a given data sample
A shortcut to the variability in the sample distribution when the data are normally distributed
It decreases the sample size grows larger - larger sample are more reliable
What are 95% confidence intervals?
Confidence intervals are an intuitive way to communicate how reliable our estimate of the mean is likely to be
They provide two values which define a range that has 95% chance of containing the true mean
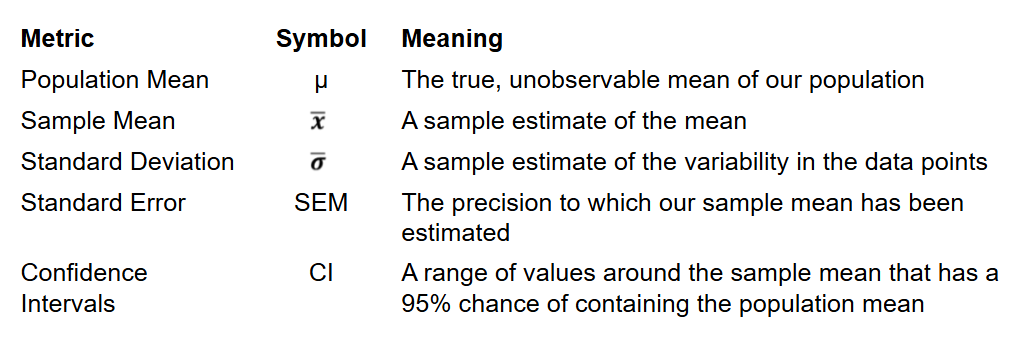
What do all the metric symbols mean?
What is a one sample hypothesis?
Always performing hypothesis test
Need to specify hypothesis before hand
For one sample t-test need hypothesis that asks whether mean of particular data set is different to a specified value (need this value ahead of time)
The statistical hypothesis of these questions will always be a comparison to a single value
The null hypothesis is that the sample mean is indistinguishable from the reference value
Why cant we look at difference between mean and specified value?
Noise - no measurement is perfect and there's often an associated error with data point
Sampling bias - we cant measure data from everyone therefore were only working with an estimate of the mean of our grp, not the true mean of the entire population
What are degrees of freedom?
Degrees of freedom for t-test = number of values in data set - 1
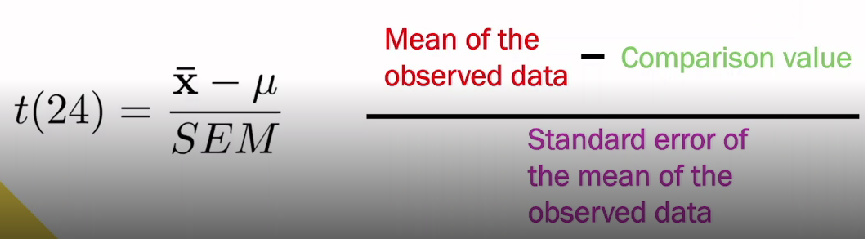
What is the formula for a t-test?
(24 is an example of degrees of freedom)
X with bar over is mean of observed data
SEM - standard error of the mean of observed data as cant take mean at face value, have to account for noise and that only sampling population. Shows how precisely we've estimated mean
U - comparison value. Large value SEM = more uncertainty about where true mean lies
What is the t-value?
T-value is a test statistic - intended to provide a single number that tells us the extent to which the data sample matches the null hypothesis
What does a small t-value mean?
A small t-value indicates the SEM is larger than the difference - we aren't likely to be able to distinguish between the sample mean and comparison value (bottom of fraction has bigger value than top = big uncertainty and small difference). Likely to accept null hypothesis
What does a large t-value mean?
A large t-value indicates the difference is larger than SEM - were likely to be able to distinguish the sample mean from comparison (larger top half of fraction = difference is larger than uncertainty). Less likely a null hypothesis is true, likely reject null
How does the t-value change with variance between observed data?
The t-value grows as the difference between the observed data mean and comparison value gets bigger bc the top of the fraction gets larger whilst the bottom stays the same
The t-value shrinks as the variance of the observed data gets bigger bc the bottom of the fraction gets larger whilst the top stays the same
Define t-test
Evidence against the null hypothesis
Define degrees of freedom
Number of values that can vary in the dataset
Define p-values
Probability of observing results if null is true
Define effect sizes
Absolute magnitude of difference
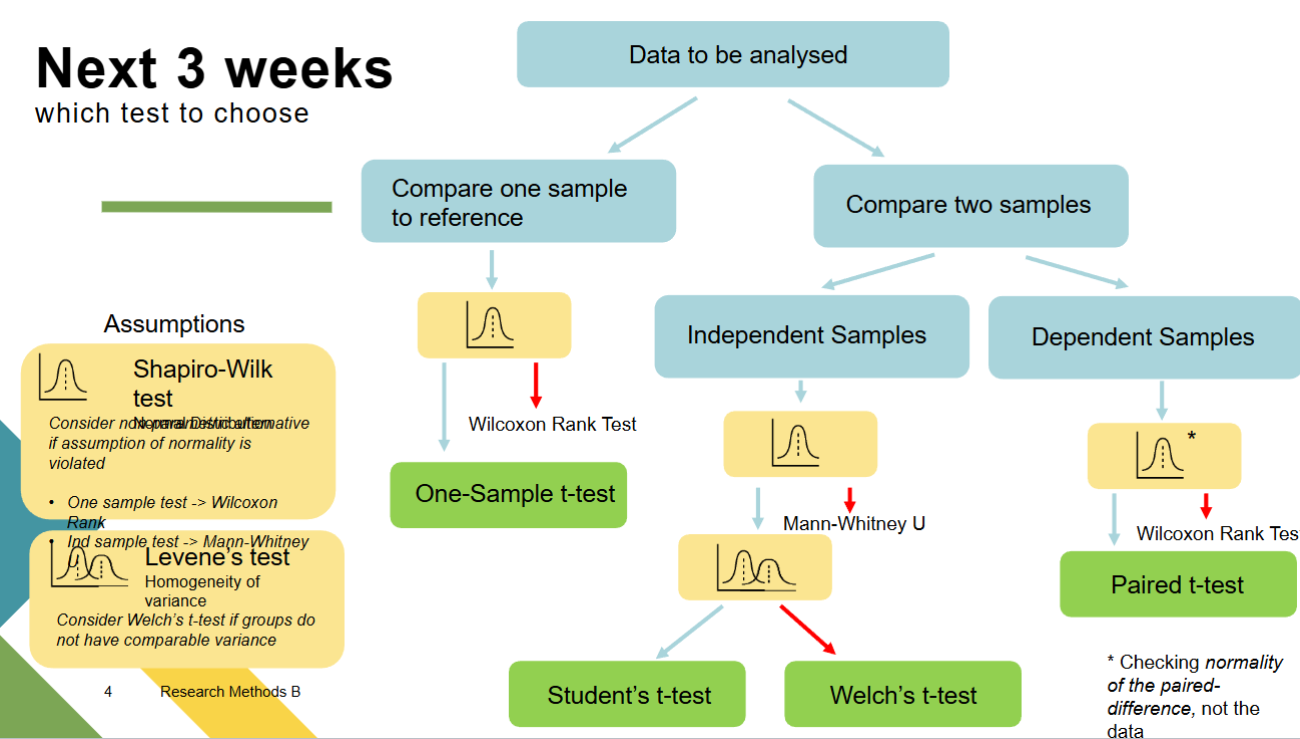
How do you choose a stats test?
What is paired sample t-tests?
If one group of ppl contributes two datapoints and we want to test if they are different (same grp participate in both conditions). We can use the one sample t-test
We do the one sample t-test comparing the pairwise differences to zero
Special case of one sample test
What happened before ‘T’?
When we compute a t-test we account for uncertainty in our estimate of the mean by using the standard error of the mean
But we also have to estimate the standard deviation from the data - we also don’t know its true value
The estimate of the standard deviation is even noisier than the estimate of the mean
For a long time, the answer was to restrict analyses to very large samples where we can be confident in the SD
What is the students t-test?
Gossett provided the answer as the Guinness brewery couldn’t create large samples when experimenting with different crops.
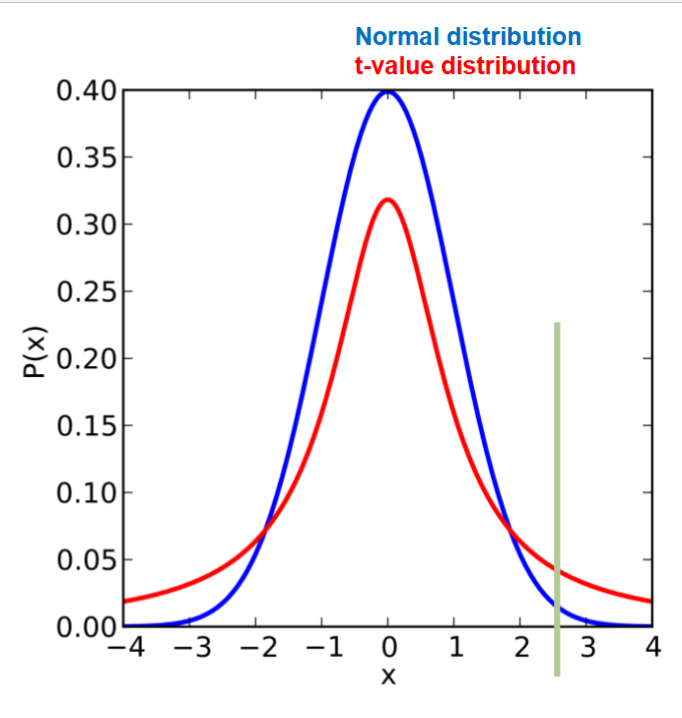
The answer is that the sample distribution of t-values (when the null is true) is not quite normally distributed, its t distributed
The accounts for additional uncertainty in smaller samples with its wider tails
e.g. in a small sample, a t-value of 2.5 would be larger than 99% of values in a standard normal distribution. But only larger than 95% of values in a t-distribution
This more conservative comparison accounts for the additional uncertainty in having to estimate the SD from the data
What is a hypothesis?
A hypothesis looks to compare the null hypothesis of no effect with the alternative hypothesis
These don't start on equal footing - we assume the null is true until proven otherwise
What are false discoveries?
Cant take everything at face value
Just because something shows a pattern, it doesn’t mean that it’s a universal effect
It could be a random chance, a bias or something that cant be explained
We need some way of protecting against false discoveries
Apophenia (tendency to see meaningful connections between related things) e.g. pareidolia is the perception of images like faces in random stimuli
We must remember were taking random samples from a wider population - there is uncertainty in how well a single sample represents the whole
What are one sample hypotheses?
These relate the mean of the sample to a prespecified comparison value
e.g. attendance in class is more then 80% or people will remember word pairing's better than chance level when the pairs are situated in a story
What is the null hypothesis?
This is proof by contradiction
We start with the null and put the burden of proof on the alternative hypothesis
This is a clear and fair starting point for research
We know everything about our statistic when there is no effect
We can write down the exact distribution of t-values for every experiment if the data are normally distributed and random
But the same distribution when there is an effect is unknown
What are one sample null hypothesis?
Attendance in class is no different from 80%
People will remember word pairings at chance level when the pairs are situated in a story
And any observed differences will be due to random chance
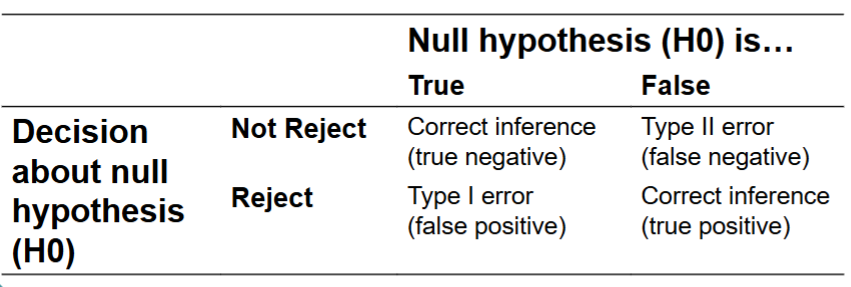
What is a type 1 error?
false positive, reject the null hypothesis to say the null hypothesis is true, even when it is false (true positive)
What is a type 2 error?
false negative, don’t reject the null hypothesis to say its false, even when the null hypothesis is true (true negative)
Types of errors
Need additional data and replication
What is the difference between one and two tailed tests?
If we have a specific direction in mind for our hypothesis - we can specify a one tailed test
This test for strictly whether our data mean is either greater than or less than our comparison value
If we predict that our data will be higher than the comparison and it turns out to be much lower - this would not be a significant result
Two-tailed tests account for both possible differences
Summarise hypotheses
We need a mechanism to protect against false discoveries
Hypothesis testing provides a solution
We assume no effect and place a burden of proof on new evidence against that null hypothesis
Stats is a way of using data to provide a principled answer to hypotheses in the face of noisy data and uncertainty
Hypotheses must be clearly specified, and we must remember that were actually testing a null
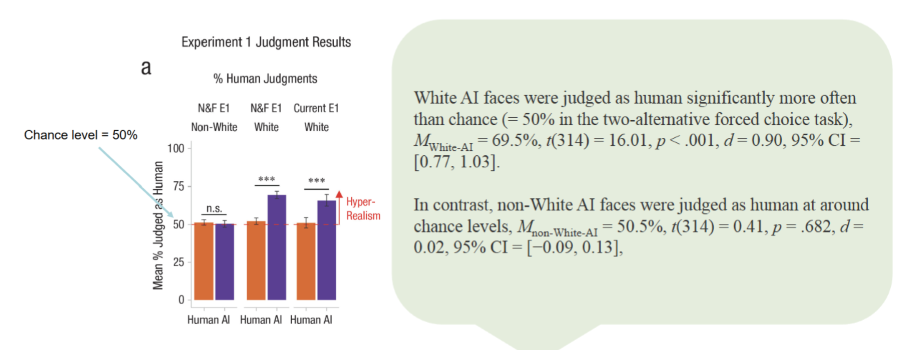
What is AI hyperrealism?
Artificial intelligence has become extremely good at stimulating realistic images of faces
So good that humans frequently cannot tell the difference
Hyperrealism refers to AI generated faces that human pps identify as human than real human faces
What is Millet et als study of hyperrealism?
Millet et al computed a metric called d-prime that indicates how effectively pps could distinguish AI generated faces from real faces
A higher value for d-prime indicates that the true faces can be more readily detected
This was statistically assessed using one sample t-tests
How do the authors highlight two separate and critical biases?
Generative adversarial networks are biased toward the stat regularities of their most common inputs, which we argue produces AI hyperrealism
Found evidence of white racial bias in algorithmic training that produces racial differentials in the presence of AI hyperrealism, with significant implications for the use of AI faces online and in science
What is the medusa effect?
Photo of person is perceived differently to a real person
Study explores whether abstraction dims the perception of a mind even with the same picture - interested in whether pictures capture something of the mind that’s sig to us
Pps had picture of a human holding a picture of another human. Ask whether we say these two ppl have same realness and experience.
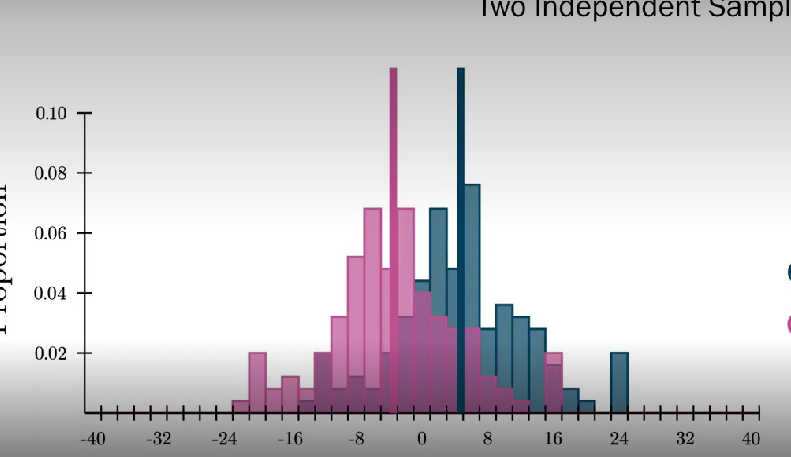
What is a two-sample hypotheses?
Test hypotheses that ask whether two groups have different means
The statistical null hypothesis state that the sample means of the two groups cannot be distinguished
e.g. bilingual ppl have higher working memory capacity than monolingual people
Group 1 - bilingual speakers
Group 2 - monolingual speakers
Metric - working memory capacity
What is a between-subjects design?
Comparison between two or more independent groups of data points
Each pps is in a single group and contributes a single data point
Mean of two different histograms and whether they differ from one another
What is a within-subjects design?
Two dependent groups of data points
Each pps completes two conditions and contributes two data points
Sometimes called repeated measures
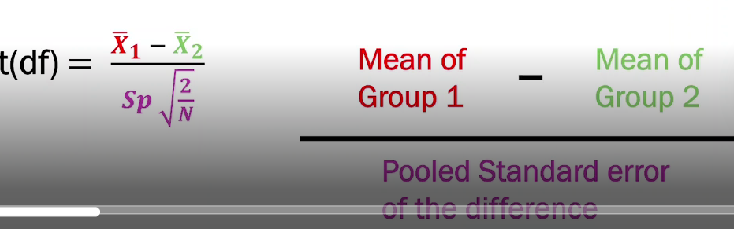
How do you calculate a two-sample t-test?
Ratio between size of difference and precision to which its been estimated
Standard error of the difference - standard deviation pooled across both groups, a single SD that represents variability in both grps. Assumes both grps have same variability
t-tests with assumption of homogeneity of variance is called students t-test
A large positive t-value indicates that the mean of grp 1 is above the mean of grp 2
A near zero t-value indicates that the mean of grp 1 is indistinguishable from the mean of grp 2
A large negative t-value indicates that the mean of grp 1 is below the mean of grp 2
Both changes in the difference between the mean and changes in SD can modulate t-statistics - as SD shrinks, t-value gets larger and as mean gets further apart, the larger the t-value gets.
What is homogeneity of variance?
Students t-test assumes homogeneity of variance - the distribution of the two grps have the same SD but that’s not always true.
We can assess this by looking at Levenes test for homogeneity of variance - assesses the null hypothesis that different grp of samples are from populations with equal variances
A sig value for levenes test indicates that the groups are likely to have different variances - suggesting that a pooled estimate of SD is not appropriate
If our data fails Levenes test, showing there is variety in SD, we can do a tweaked version of t-test - Welch's t-test
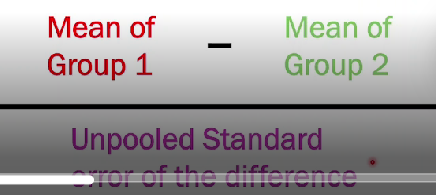
How do we use a welch’s t-test?
Exactly same as t-test but uses different estimator of standard error
Uses an unpooled measure of SD which is valid when the grps have different variance
The unpooled SD valid whether grps have equal variances or not
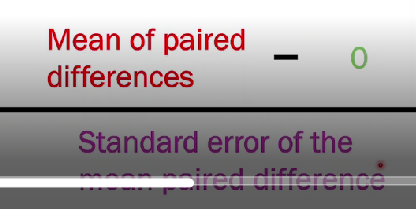
How do we calculate a paired samples t-test?
One sample t-test on the difference between two grps
Follows the same principle of the independent samples test
It must be used when were comparing the means of two dependent distributions - when the same pps have contributed to each condition
In these cases, the assumption of independent samples is violated in the standard t-test
Take the difference between each pair od samples and compute a one-sample t-test between the paired difference and zero
Jamovi and R can do this for us by specifying that were running a paired sample test
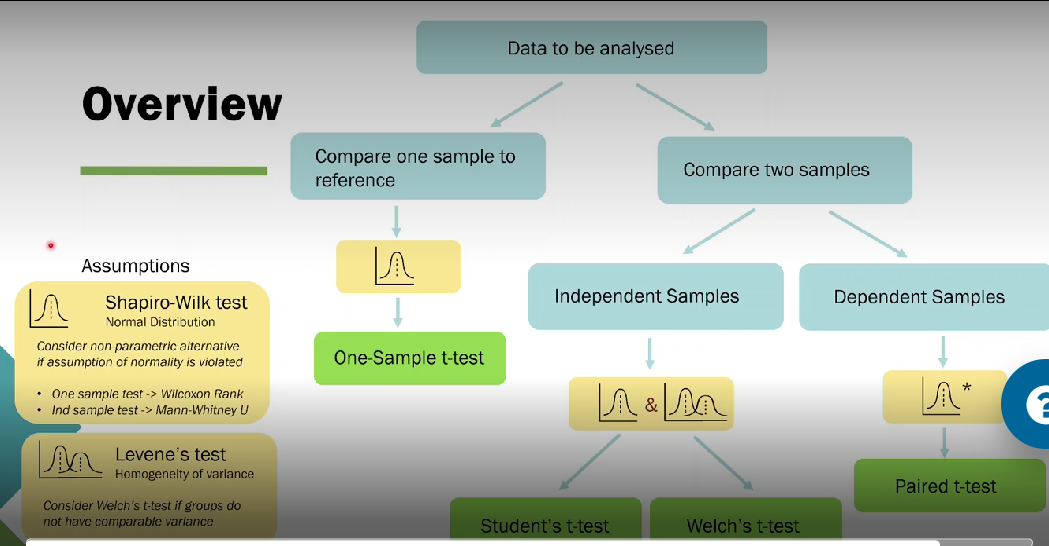
How do we know when to use each test?
In either case want to do Shapiro-wilk test to see if our data is normally distributed, if its not do a non-parametric alternative test
Want to do Levene's test to see homogeneity of variance - if there's sig difference from homogeneity variance do Welchs t-test but if both grps have same variance then we can run students t-test
If we want to compare two samples and those samples are dependent (each pps does two data points), run paired t-test. In this case we only need to do Shapiro-wilks test - we want to know that the difference between the two grps is normally distributed
What is study design?
Study is important for statistics as many tests assume that data observations are independent - each data sample is a separate observation
If some observations are related e.g. bc one pps did the experiment twice then this changes how we interpret the results
Both are valid but we need to run slightly different tests for each
What are the pros and cons of between-subject deisgn?
Pros: shorter participation per individual. Lower practice/order effects
Cons: can be affected by individual differences in sampling. Need to decide how to allocate pps to grps. Needs more pps
What are the issues with between-subject designs?
Recruitment - are your pps in each condition similar?
Representation - both grps need to represent your target population
Environment - are your grps sufficiently similar research environments/contexts? Do they get the same instructions?
Ethics - is it ethical to treat the grps differently e.g. in medical research, is it fair to withhold treatment from one grp
What are the solutions to these issues?
Rigorous and standardised experimental procedures - make sure things rlly are the same each time
Planning and recruitment - what aspects of your pps do you need to balance? How can you ensure both grps are representative and balanced
Allocations of grps - how can you fairly distribute conditions amongst pps. Randomness is normally good here
What are the pros and cons of within-subjects design?
Pros: removes individual differences. Need fewer pps
Cons: practice or order effects. Longer participation per individual
What are the issues with within-subjects design?
Practice - could ppl get better at your task with repeated exposure?
Fatigue - could behaviour change as ppl get bored or tired?
Carryover - could one condition impact the other?