ap micro unit 6
1/21
There's no tags or description
Looks like no tags are added yet.
Name | Mastery | Learn | Test | Matching | Spaced | Call with Kai |
|---|
No analytics yet
Send a link to your students to track their progress
22 Terms
externalities
costs/benefits placed on members of society that did not participate in market transaction
negative externalities
external cost to society (MSC > MPC). Gov can correct this by using per unit taxes
Forces firm to produce at a socially optimal Q (decreases supply, lowers Qe and raises prices for customers)
positive externalities
external benefits for society (MSB > MPB). Gov can correct this by per unit subsidy
lowers production costs, shifts supply curve up/left, increases Qe and lowers prices for customers
marginal private cost (MPC)
additional cost firm has after producing one more good (like labor and materials). Supply curve in free market
marginal social cost (MSC)
additional cost to society of producing one more unit of a good (like pollution).
marginal private benefit
additional benefit consumer gains from consuming one more unit of good/service
marginal social benefit
benefit society from consuming one additional unit
deadweight loss
represents loss of economic efficiency when they don’t produce at socially optimal quantity - lost surplus that consumers/producers/gov can’t capture
socially efficient/allocatively efficient
MSB = MSC, otherwise there is market failure
per unit tax
fee on every unit produced/sold. Shifts supply curve up/left. Fixed negative externalities by decreasing production until market reaches social optimal quantity, aims to eliminate DWL. Consumers pay higher price + producers get lower net price
subsidy
financial assistance given for each unit produces/sold. Decreases cost of production, shifts the supply curve down/right. Increases production until market reaches social optimal quantity. Decreases price for customers, increases price producers receive
public good
nonrival and nonexcludable goods, accessible to the public
nonrival
one person use does not affect the amount available for others (ex: national defense)
nonexcludable
people who don’t pay for a good can still use it (ex: streetlight)
Free rider problem
people have incentive to keep using good w/o paying — private firms cannot profitably produce goods because they can’t collect enough revenue. Market underproduces good = DWL.
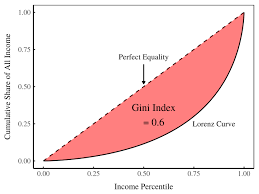
Lorenz curve
visual tool used to measure income inequality in an economy
x-axis: cumulative (increasingly) percentage of population (poorest to richest)
y-axis: cumulative percentage of total income
Line of perfect equality - 45° diagonal line, if income were perfectly equal the bottomed 20% of people would earn 20% of total income
Lorenz Curve: ‘bowed’ line below diagonal - the further it curves away from 45° line, more unequal the income distribution is
gini coefficient
statistical measurement of economic inequality (0-1), shows how wealth is distributed in a population. 0 = perfect equality, 1 = perfect inequality (one person has all)
monopoly
only one producer, no close substitutes. Market failure — produce at a not socially optimal quantity (P = MC), maximize profit. Underproduction = DWL. Gov might use antitrust laws/gov ceilings to fix it
natural monopoly
firm can supply entire market’s demand at lower cost than 2+ firms could. High fixed costs, low marginal costs. Gov usually allows natural monopolies to work under regulation.
Socially optimal price (P=MC) — maximizes efficiency but forces firm to take a loss (ATC > P), which requires a gov subsidy
Fair-return price (P=ATC) — compromise where firm earns normal profit + DWL is reduced w/o subsidy
antitrust laws
gov regulations to prevent monopolies from forming/promoting competition in market place. Moves market closer to socially efficient quantity (P=MC)
price fixing
illegal form of collusion - markets agree to set prices than let price be determined by free market. Leads to underproduction + high prices (market failure)
fair return pricing
gov regulation practice for monopolies. price ceiling - P = ATC. Goal to reduce DWL, makes firm earns economic profit