2.1 - Describing Location in a Distribution | 2.2 - Density Curves and Normal Distribution
What is percentile used to do?
to describe the location of a value in a distribution
How do you find the percentile of a value?
count the number of values less than or equal to it, then divide by the total number of values
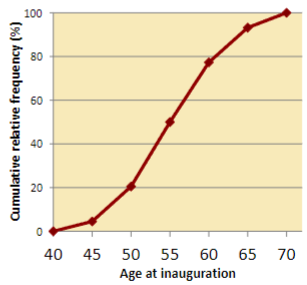
What is a cumulative relative frequency graph?
a graph that plots a point corresponding to the percentile of a given value in a distribution of quantitative data and connects consecutive points using line segments
cumulative relative frequency graph
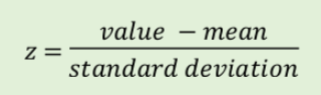
What does a z-score tell us?
how many standard deviations from the mean an observation falls and in what direction
formula for z-score
What is a standardized score often called?
z-score
What does transforming data do?
converts the original observations from the original units of measurement to another standardized scale
can affect the shape, center, and variability of a distribution
What are the effects of adding/subtracting a constant to/from a distribution?
adding/subtracting the same positive number a to/from each observation:
adds/subtracts a to/from measures of center and location (mean, five-number summaries, percentile)
does not change measures of variability (range, IQR, standard deviation)
does not change the shape
What are the effects of multiplying/dividing a constant by the distribution?
multiplying/dividing each observation by the same positive number b:
multiplies/divides measures of center and location (mean, five number summaries, percentiles) by b
multiplies/divides measures of variability (range, IQR. standard deviation) by b
does not change the shape
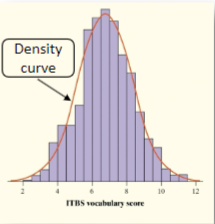
What is a density curve?
a curve that
is always on or above the horizontal axis
has an area of exactly 1 underneath it
What does a density curve describe?
the overall pattern of a distribution
What does the area under the density curve and above any interval of values on the horizontal axis estimate?
the proportion of all observations that fall in that interval
density curve
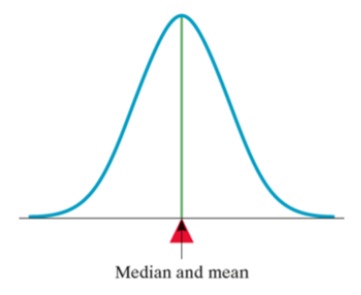
What is the mean of a density curve?
the point at which the curve would balance if made of solid material
What is the median of a density curve?
the equal-areas point, the point that divides the area under the curve in half
mean and median of a symmetric curve
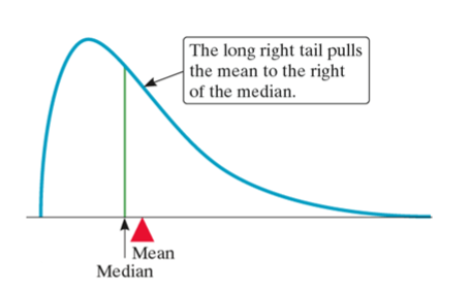
mean and median of a right skewed curve
What is a density curve an idealized description of?
a distribution of data
What must we distinguish between when it comes to density curves?
between the mean and standard deviation of the density curve and the mean and standard deviation computed from the actual observations
What is the usual notation for the mean of a density curve?
μ
What is the usual notation for the standard deviatin of a density curve?
σ
What shape do all normal distributions have?
symmetric, single-peaked, and bell-shaped
How is any specific normal curve specified?
by giving its mean μ and its standard deviation σ
What is the standard deviation of a normal distribution?
the distance from the center to change of curvature points on either side
How do we abbreviate the normal distribution?
N (μ, σ)
Why are the normal distributions important in statistics?
they are good distributions of real data
they are good approximations of the results of many kinds of chance outcomes
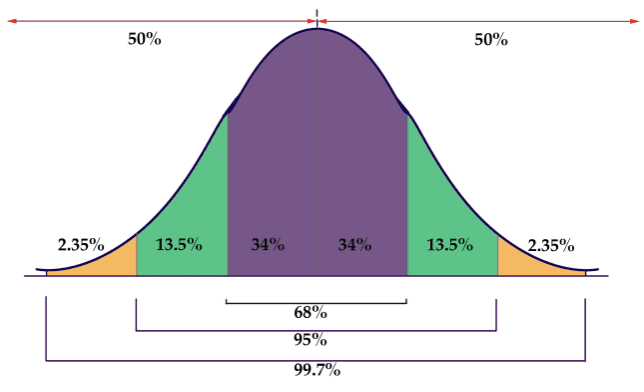
empirical rule
What percentage of observations fall within 1 σ of μ?
approximately 68%
What percentage of observations fall within 2 σ of μ?
approximately 95%
What percentage of observations fall within 3 σ of μ?
approximately 99.7%
When are all normal distributions the same?
if we measure in units of size σ from the mean μ as center
What is the standard normal table?
a table of areas under the standard normal curve in which the table entry of each value z is the area under the curve to the left of z
How do you find areas in any normal distribution?
State the distribution and the values of interest. Draw a normal curve with the area of interest shaded and the mean, standard deviation, and boundary value(s) clearly identified
Perform calculations. Compute a z-score for each boundary value and use Table A to find the desired area under the standard normal curve
Answer the question
How do you find areas of a normal distribution on a calculator?
2nd → VARS → normalcdf (lower ____, upper ____, μ ____, σ ____)
How do you find boundaries of a normal distribution on a calculator?
2nd → VARS → invNorm (area ____, μ ____, σ ____)
What does a normal probability plot do?
it provides a good assessment of whether a data set follows a normal distribution