CH 3 Cost behavior
1/20
There's no tags or description
Looks like no tags are added yet.
Name | Mastery | Learn | Test | Matching | Spaced | Call with Kai |
|---|
No study sessions yet.
21 Terms
Cost behavior
How a cost will react as changes take place in the level of business activity.
Planning
Control
Cost analysis
Importance of understanding cost behavior
Planning
requires that management makes decisions based in part on expectations as to the future. These expectations should be based on data relevant to the decision objectives, gathered and analyzed in a competent, unbiased fashion.
Control
the process of using feedback information for comparison with expectations and the implementation of actions on the basis of that comparison.
Cost analysis
an integral part of the planning and control function. The key to effective cost prediction lies in an understanding of cost behavior patterns.
Variable cost
Fixed cost
Mixed cost
Type of costs
Variable cost
are those that change in total as the level of activity changes in the short run and within the relevant range.
Relevant range
the range of activity within which assumptions relative to variable and fixed cost behavior are valid.
Activity base
measure of whatever causes the incurrence of variable cost.
Fixed cost
remain constant in total regardless of changes in the level of activity within the relevant range.
Committed fixed cost
relate to the investment in facilities, equipment, and the basic organizational structure of a firm. They are long-term in nature and they can’t be significantly reduced for short periods of time without seriously impairing the profitability or long-run goals of the organization.
• Ex. Fixed depreciation charges, insurance, executive salaries
Discretionary/managed fixed cost
arise from annual decisions by management to spend in certain fixed cost areas.
• Ex. Advertising, research, public relations, management development programs, internships
Mixed cost
Contain both variable and fixed cost elements
Account analysis method
Industrial engineering method
Conference method
Quantitative analysis method
Cost estimation methods
Account analysis method
makes use of the experience and judgment of managers and accountants who are familiar with company operations and the way costs react to changes in activity level.
• Ex. Itemized analysis of each cost
• Advantage
- Provides detailed expert analysis of the cost behavior in each account.
• Disadvantages
- Subjective
- Labor intensive and time consuming
- Cost of data collection may surpass benefit
Industrial engineering method
estimates cost functions by analyzing the relationship between inputs and outputs in physical form.
• Ex. Time and motion studies
• Advantages
- Does not require data from prior activities
- It can detail each step required to perform an operation
- Helps managers identify nonvalue added activities
• Disadvantages
- Quite expensive to use
- Based on optimal condition (no error, machine breakdown)
Conference method
estimates cost functions based on the analysis and opinions about costs and their drivers obtained from various departments of an organization such as purchasing, process engineering, manufacturing, employee relations and so on.
• Advantage
- Pooling of expert knowledge
• Disadvantage
- Accuracy depends on objectivity
Quantitative analysis method
A. High-low method
B. Regression analysis
Scattergraph
Least square regression analysis
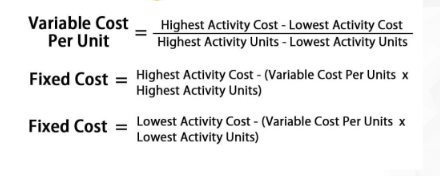
High low method
Outliers are extremely high or extremely low data that lies an abnormal distance from other data. Outliers should be ignored because it may disrupt the computation.
• Ex. The second highest data will be used if the highest data is an outlier.
• Advantages
- Simple, inexpensive and easy to apply
• Disadvantages
- Uses only two data points which may not produce accurate result.
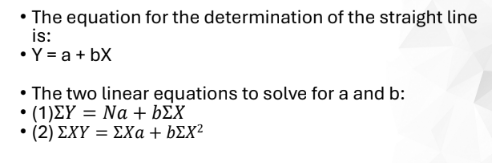
Least squares regression
A statistical technique which is often used in separating mixed costs into their fixed and variable components. Basically, a line of regression is determined by solving two simultaneous linear equations which are based on the condition that the sum of deviations above the line equals the sum of deviations below the line.
• Advantages
- Uses all observations
- Easy to use with software/scientific calculator
• Disadvantages
- Requires relatively strict assumptions for the result to be valid
- If an outlier is present this can adversely affect the results.
Scattergraph
All observed data at various levels are plotted on a graph. A regression line is then fitted to the plotted point using visual inspection, to represent the line function which is used to estimate the total fixed cost and variable cost per unit. The point where the line intercepts y-axis (total costs) represents the total estimated fixed cost and the slope of the line is the average variable cost per unit.
• Advantages
- Uses all observations of cost data
- Easy to understand and apply
- More accurate than high-low method
- Ignores outliers
Disadvantages
- Fitting of the line graph is subjective
- Difficult to use if there are several independent variables (cost drivers)
- Unable to give the exact extent of correlation