Macroeconomics - Supply and Demand
1/32
Earn XP
Description and Tags
Name | Mastery | Learn | Test | Matching | Spaced | Call with Kai | Chat |
|---|
No analytics yet
Send a link to your students to track their progress
33 Terms
Consumer Behavior and the Demand Curve
Consumers are limited by their income
Consumers look for ways to make themselves better off
Consumers respond to economic incentives
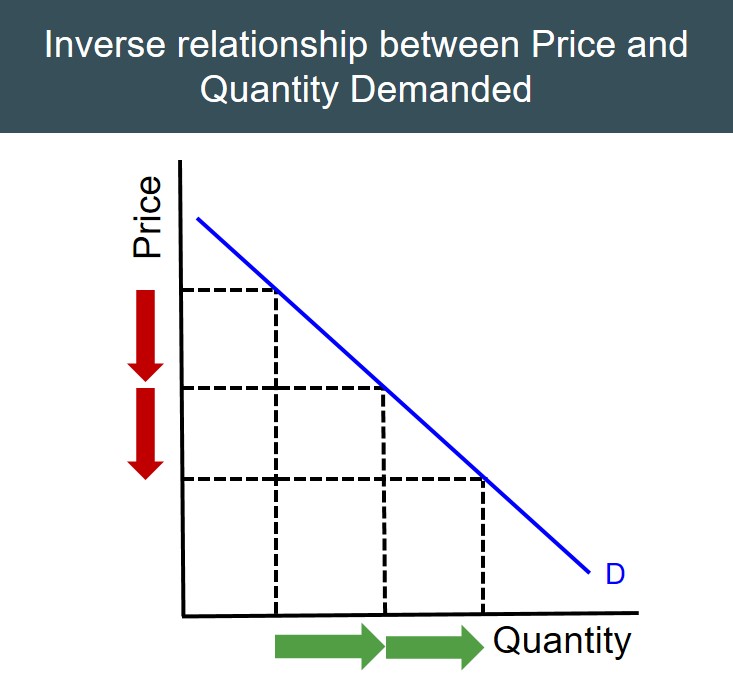
Law of Demand
As price decreases, the quantity demanded increases
Why is the Demand Curve negatively sloped?
Because of limited income
Producer Behavior and the Supply Curve
Producers are limited by scarcity
Producers look to maximize their profit
Producers respond to economic incentives
Law of Supply
Quantity supplied will increase as prices increase, and decrease as prices fall
Ceterus Parabus
All else remains the same
Combining Supply and Demand on 1 graph
The curves meet at the equilibrium point. This is where most consumers are willing and able to buy, and most suppliers are willing and able to produce
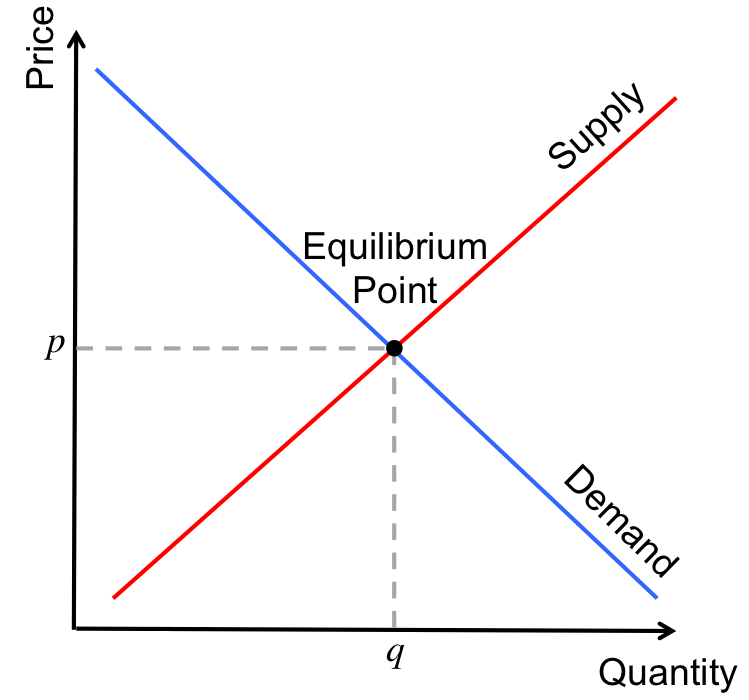
Market Price; Equilibrium
Qs=Qd. It is the most efficient point at which it is no longer possible to make someone better off without making someone else worse off.
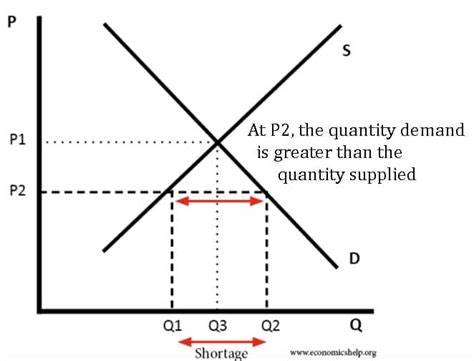
Shortage
When price is set below Market Equilibrium, and Qs<Qd; or Qd>Qs
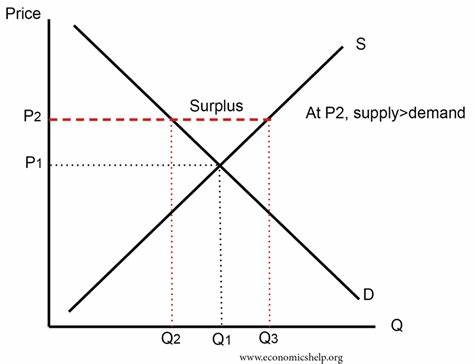
Surplus
When price is set above equilibrium, and Qs>Qd; or Qd<Qs
Change in Quantity Demanded (Qd)
Change in Quantity Demanded refers to a movement along the demand curve, this is caused by a change in price.
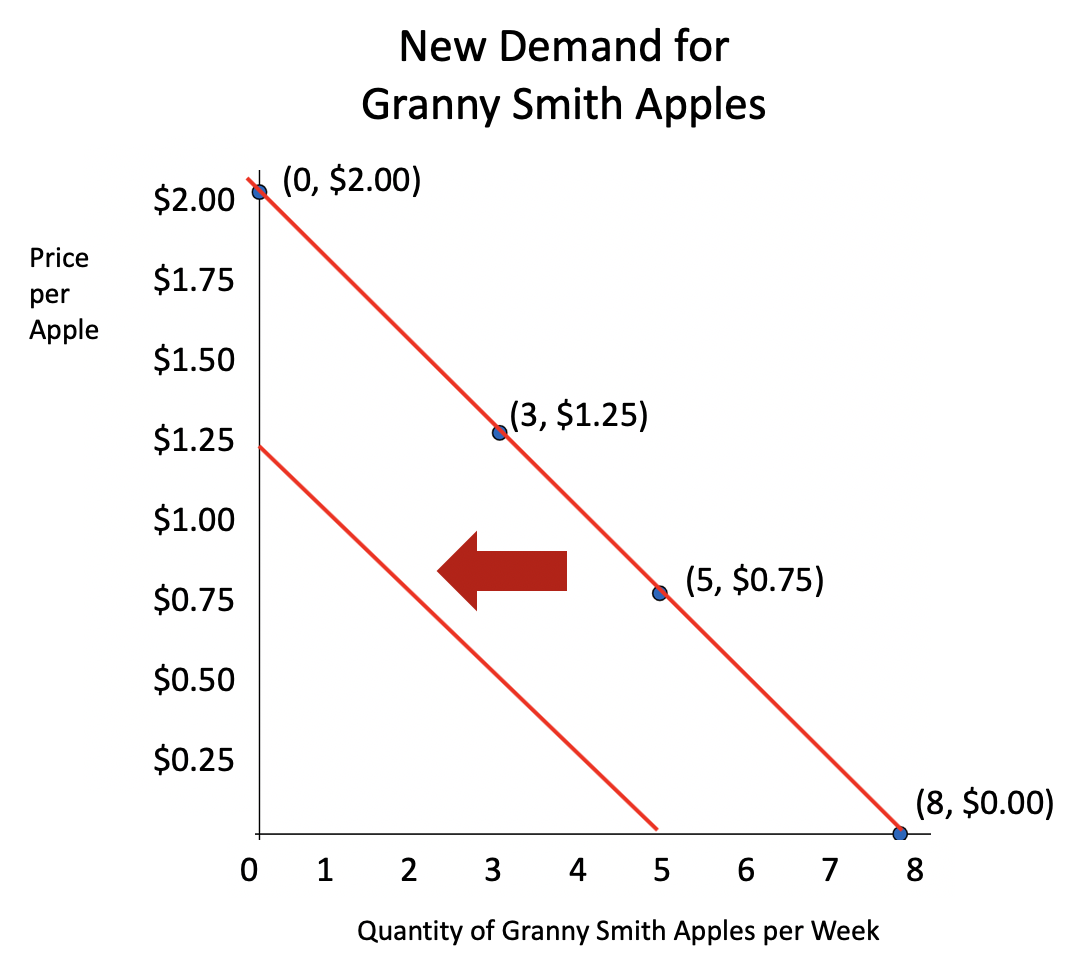
Change in Demand
Refers a shift of the Demand Curve not caused by price. Can either shift left or right
Causes for Change in Demand
Change in Household income
Change in population
Change in Expectations
Change in Tastes and Preferences
Change in the price of related Goods and Services
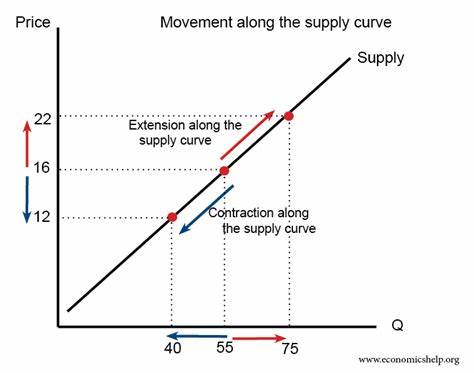
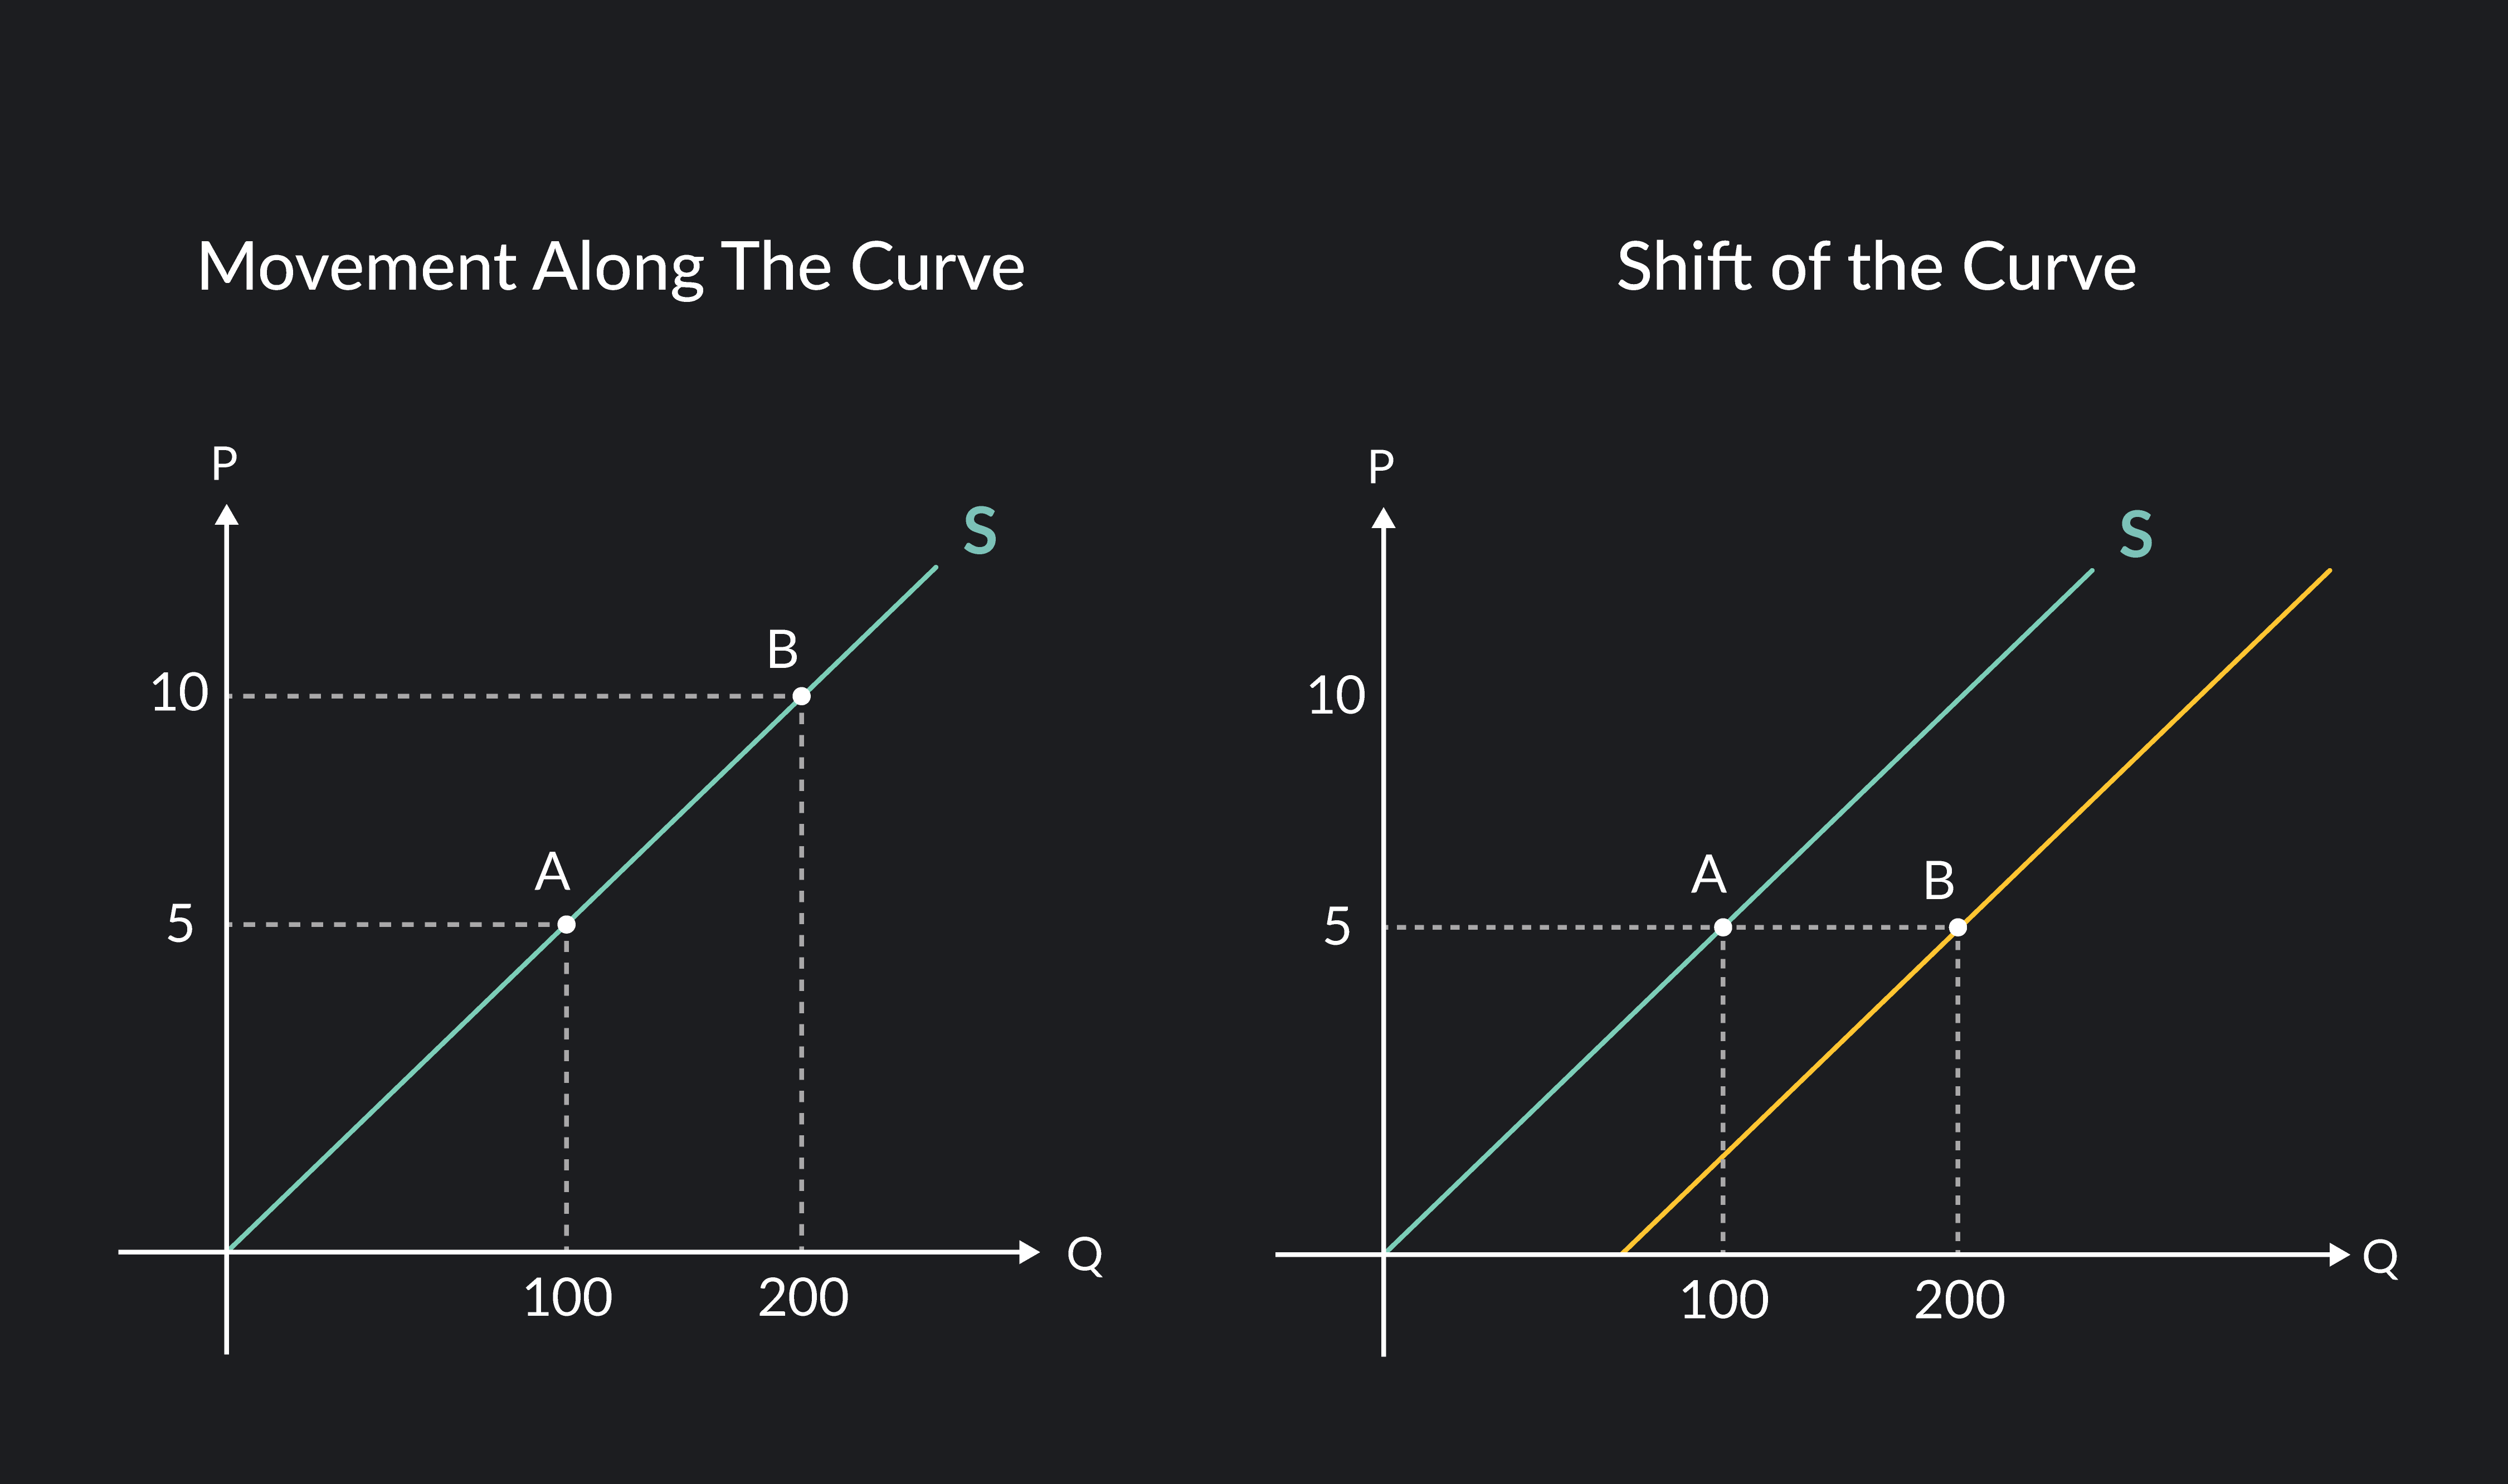
Change in Quantity Supplied (Qs)
Refers to a movement along the Supply Curve that is a result of a change in price.
Change in Supply
Change in Supply refers to a shift of the Supply Curve that is not the result of a change in price.
Causes for Change in Supply
Change in cost of production
Change in Seller expectations
Change in number of sellers
Natural Conditions (i.e. Drought)
Change in Technology
Related Goods and Services
Substitutes or Complements
Substitute Goods
Goods and Service purchased in place of others. Increase in the price of 1 would result in an increase in Demand of the other.
Complement Goods
Goods and Services purchased alongside other Goods and Services. Increase in the price of 1 would result in a decrease in Demand for the other.
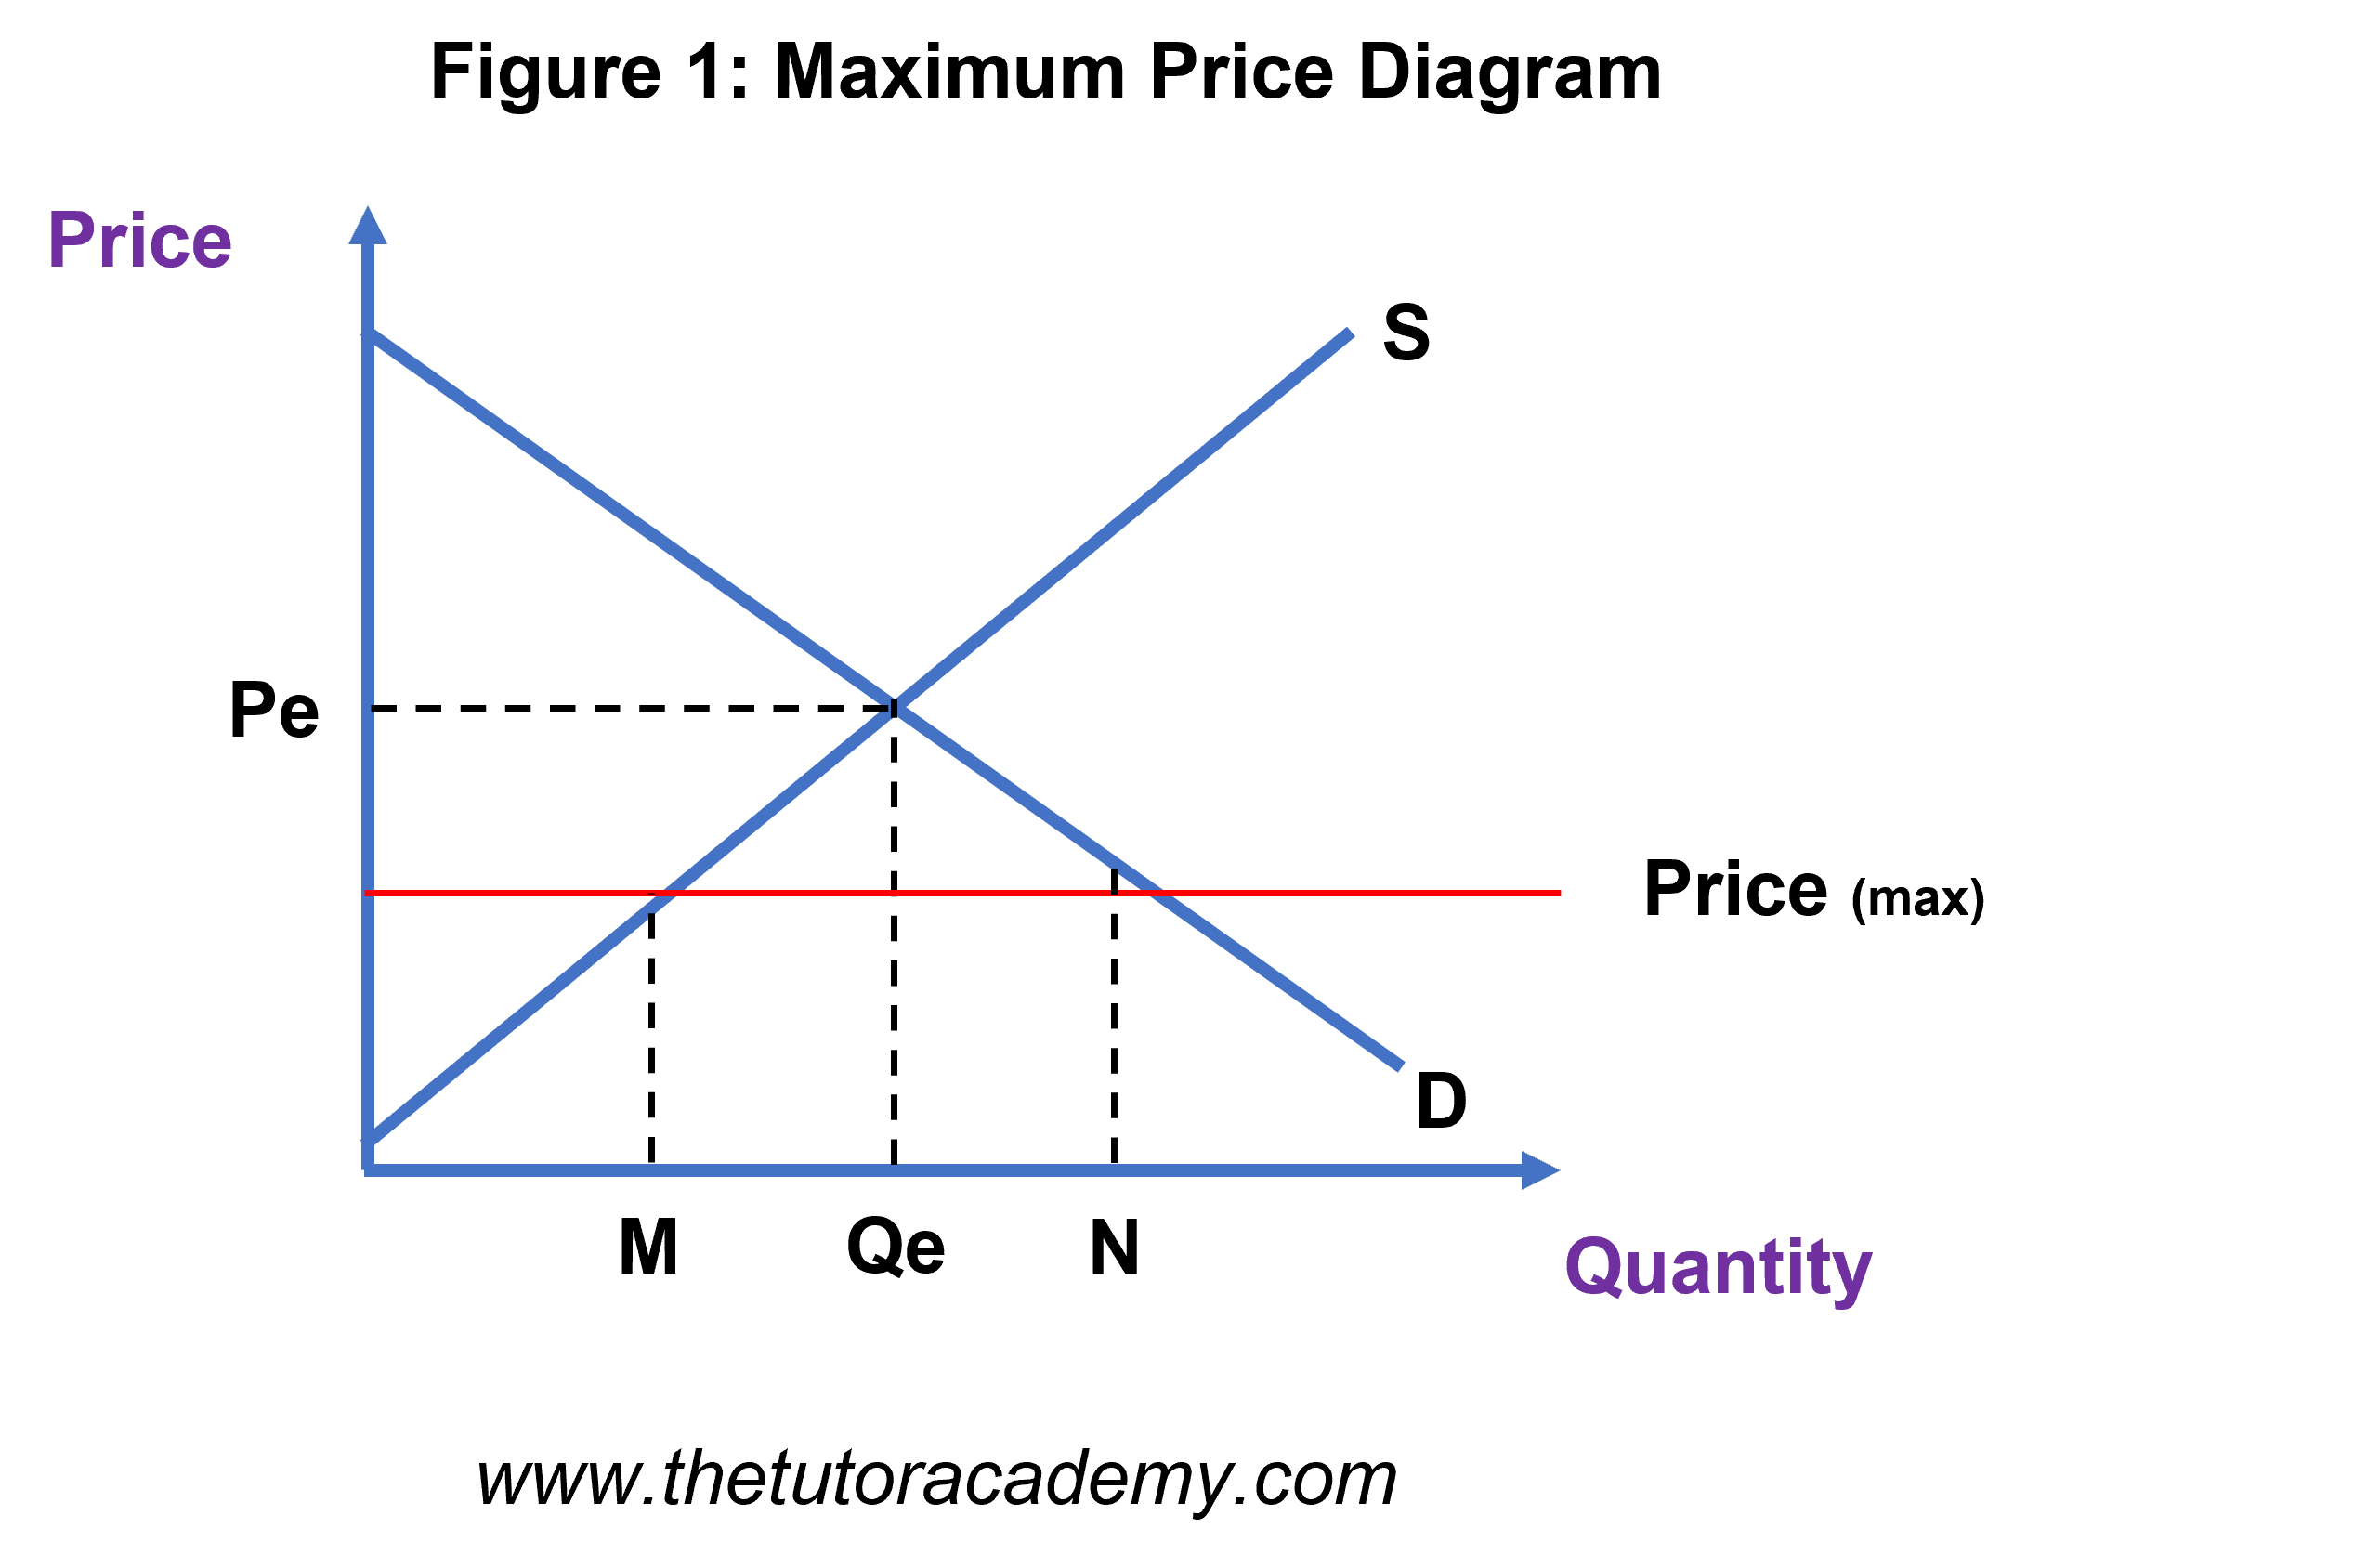
Price Control
Legal minimums or maximums set by government with regards to price.
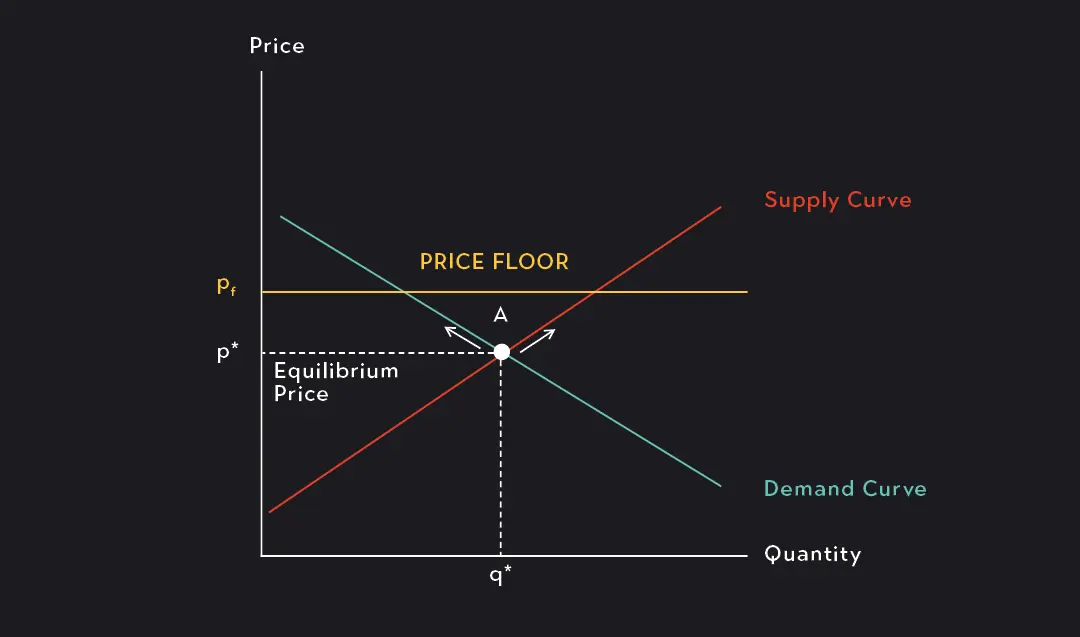
Price Floor
Results in an economic condition of Surplus, where Qs>Qd. To fill the gap, you must shift the Demand curve to the right.
Price Ceiling
Results in an economic condition of Shortage, where Qs<Qd. Only way to fix this problem is to shift Supply to the right.
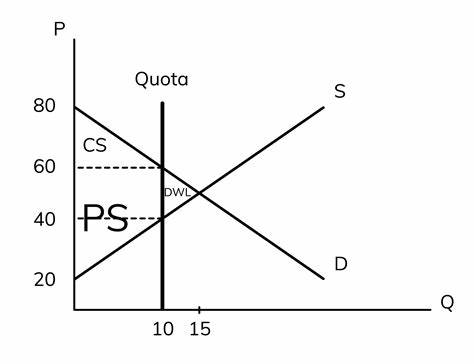
Quota
A government can set a limit on how much product can be produced or imported.
Tariff
A government can impose a tax on imported goods as a means of price control.
Elasticity
Used to describe responsiveness in one variable with regards to another
Stages of Demand
Perfectly inelastic
Inelastic
Unitary Elastic
Elastic
Perfectly Elastic
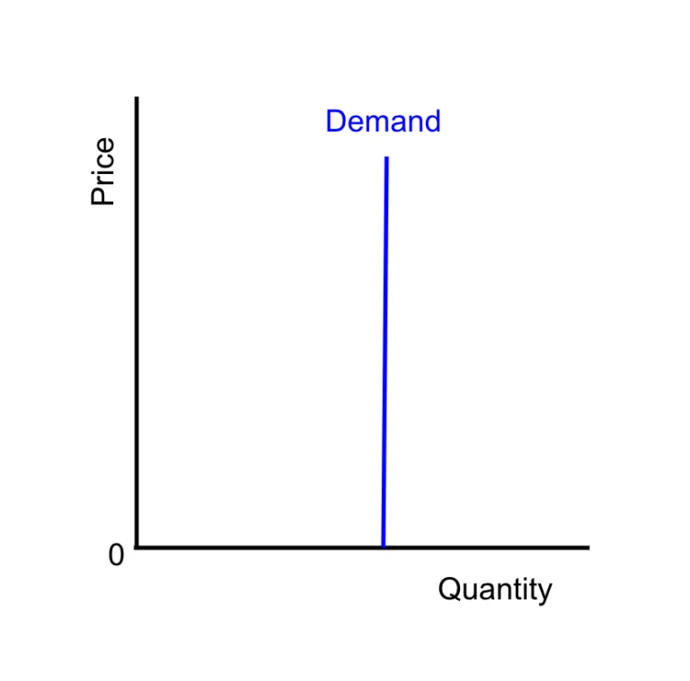
Perfectly Inelastic Demand
Demand is a straight vertical line
Applicable to necessities; markets with no substitutes
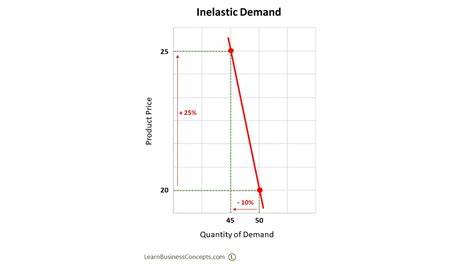
Inelastic Demand
Shift in price does not have a strong effect on Qd; Steep slope
Few substitutes
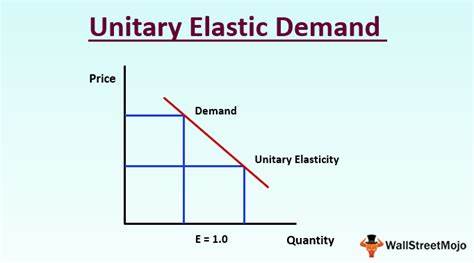
Unitary Elastic
Most goods fall in this category
Product Demand changes in a similar proportion to price
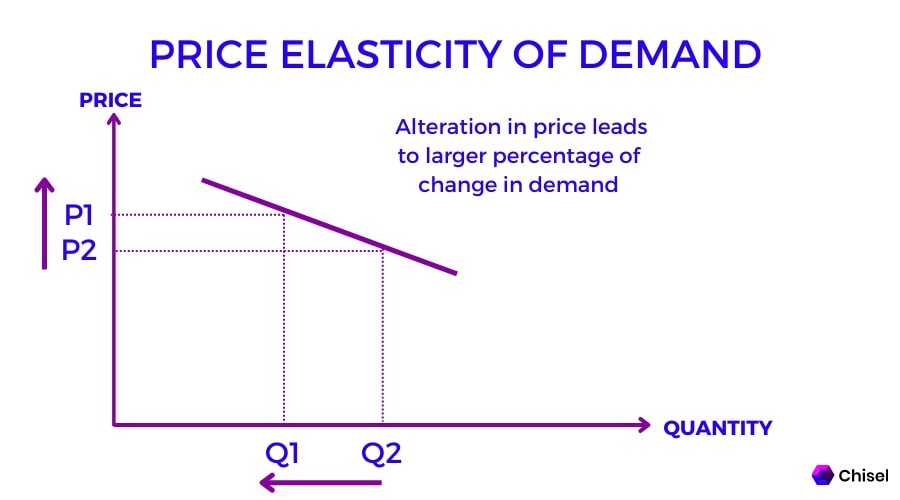
Elastic Demand
A lot of substitutes
Small changes in price lead to larger changes in Qd
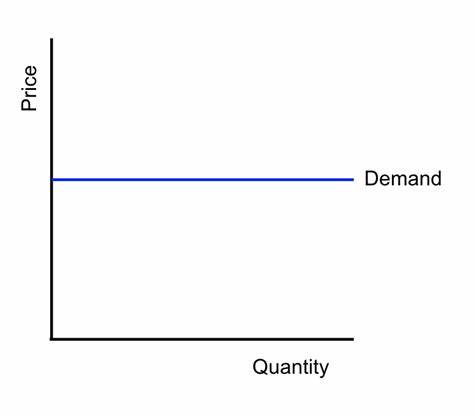
Perfectly Elastic Demand
Straight horizontal line; No slope
Describes Agricultural Market
How to Calculate Price Elasticity
(Percent Change in Quantity)/(Percent Change in Price)
Midpoint Method
Percent change in demand formula with the denominator being the average of the new and old value.