Module 4 - OCR A Level Biology
1/185
There's no tags or description
Looks like no tags are added yet.
Name | Mastery | Learn | Test | Matching | Spaced |
|---|
No study sessions yet.
186 Terms
4.1.3 CLASSIFICATION AND EVOLUTION
4.1.3 CLASSIFICATION AND EVOLUTION
Order of taxonomic groups
Domain, Kingdom, Phylum, Class, Order, Family, Genus, Species
What is the biggest taxonomic group?
Kingdom
What are the three domains?
Archaea, bacteria and eukarya
why is classification used?
identify species
predict characteristics
find evolutionary links
same system for all scientists
What is the definition of a species?
A group able to reproduce to produce fertile young
If two different species breed, why isn't their offspring fertile?
their offspring will have an odd number of chromosomes
meiosis + gamete production cannot take place bc all chromosomes have to line up
What is the binomial system?
advantage?
1st word = genus 2nd word = species
genus always capitalised
italics/underline whole name
advantage: scientists from all over the world can use the same system
What is genus does the "Ambystoma mexicanum" belong to?
Ambystoma
What species does the "Capra aegagrus" belong to?
Aegagrus
what are the 2 classification systems?
classic 5 kingdom
3 domain system with 6 kingdoms
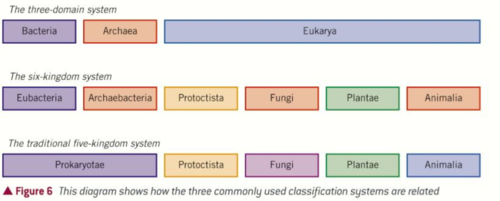
what are the 5 kingdoms?
Prokaryotae
Protoctista Fungi Plantae Animalia
multi-cellular
membrane-bound organelles
heterotrophic feeders
Animal kingdom
unicellular
no membrane-bound organelles
Prokaryote kingdom
e.g bacteria
unicellular
membrane-bound organelles
autotrophic/heterotrophic/parasitic
Protoctista kingdom
Which kingdom does an amoeba belong to?
Protoctista kingdom
multicellular
membrane bound organelles
autotrophic feeders
contain chlorophyll
Plant Kingdom
unicellular/multicellular
membrane-bound organelles
saprophytic feeders
Fungi Kingdom
also have cell wall made of chitin
e.g yeast
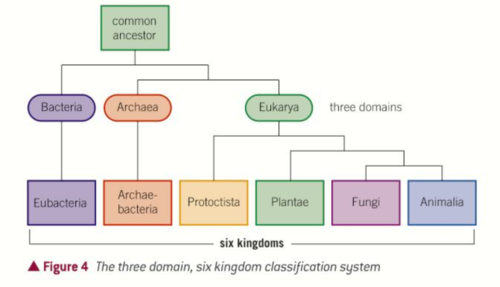
How does domain system work?
grouped by rRNA
Eukarya = 80s ribosomes Archaea = 70s ribosomes Bacteria = 70s ribosomes
How many kingdoms are in the Eurkaya domain?
4

Which kingdom is split in half by the bacteria and archaea domain?
Prokaryotae into Eubacteria and Archae-bacteria
what is phylogeny?
evolutionary relationships between organisms
reveal which group an organism is related to and how closely related
study = phylogenetics
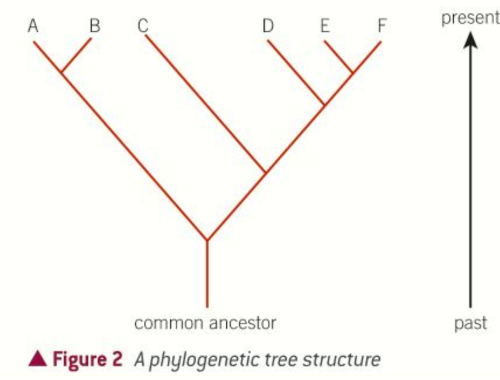
what is a phylogenetic tree?
represents evolutionary relationships
show how diff. species evolved from one common ancestor
closer the branches of the tree, closer the evolutionary relationship
groups which share their own common ancestor = sister groups e.g A/B and E/F
how do classification and phylogeny work together?
advantages of phylogeny
classification uses knowledge of phylogeny to confirm that how an organism has been classified is correct
advantages:
Phylogeny produces a continuous tree so not forced to put into a specific group where organism doesn't fit
easier to compare
What was Darwin's Theory of Evolution?
Natural selection
what is the evidence for evolution (natural selection)?
palaeontology (study of fossils)
comparative anatomy
comparative biochemistry
How does comparative biochemistry show evidence for evolution?
CB looks at the dif proteins/molecules in diff organisms
some molecules are highly conserved (hardly change) among species e.g cytochrome C, rRNA
slight changes can identify evolutionary links
species with similar DNA + proteins = more closely related
What evidence do fossils provide for evolution?
fossils of simplest organisms are found in oldest rock layers while more complex vertebrate organisms found in more recent rocks
sequence in which animals are found e.g plants before animals
similarity in anatomy of fossil organisms to today's organisms suggest evolutionary relationships
however not complete as soft-bodied organisms completely decay
interspecific variation
variation among members of different species
e.g bird has feathers and dog has fur
intraspecific variation
differences between organisms within a species
e.g people vary in height + colour
What are the two causes of variation?
Genes and environment
What are the three major causes of genetic variation?
Alleles
individuals in a species may inherit different alleles
mutations
changes to DNA changes the proteins coded for
if mutation occurs in gametes too, can be passed down to offspring
meiosis
independent assortment
crossing over
sexual reproduction
different from parent
How are plants more affected by the environment?
Plants can't move whereas animals can move to find food and shelter
example of environmental variation
Hydrangeas produce blue flowers in acidic soil and pink flowers in alkaline soil
difference between discontinuous and continuous variation?
discontinuous variation can only result in certain discrete individual categories. controlled by 1 gene
for continuous variation the values are within a range. controlled by multiple genes + influenced by environmental factors
examples of discontinuous variation?
Blood groups eye colour gender shape of bacteria
use bar chart
examples of continuous variation?
Height mass
What is standard deviation a measure of?
How spread out the data is
Greater the standard deviation the greater the spread of data
in terms of variation, a characteristic which has a high standard deviation has a large amount of variation
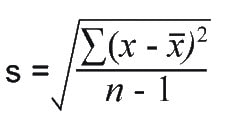
What is the formula for standard deviation?
x̄ = mean value
Σ = the sum of
x = value measured
n = total no. of values in the sample
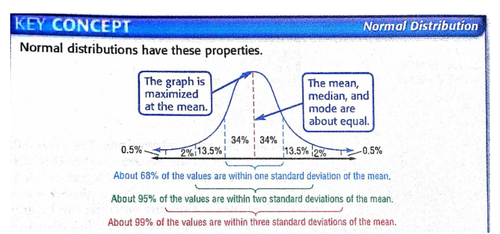
normal distribution curve
the bell-shaped curve that results from plotting continuous variation data on a graph (usually)
50% values are greater than the mean and 50% below
most values close to the mean
bell-shape symmetrical around the mean
What does the student's t test compare?
Means of two sets of data
see whether there's a significant difference
requirements for t-test
data must be normally distributed
enough data to calculate reliable mean
diff sample sizes can be used
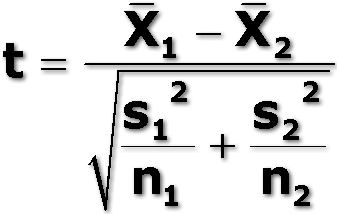
What is the equation for the student's t test?
x̄1 = mean of population 1
x̄2 = mean of population 2
S1 = standard deviation of population 1
S2 = standard deviation of population 2
n1 = total number of values in sample 1
n2 = total number of values in sample 2
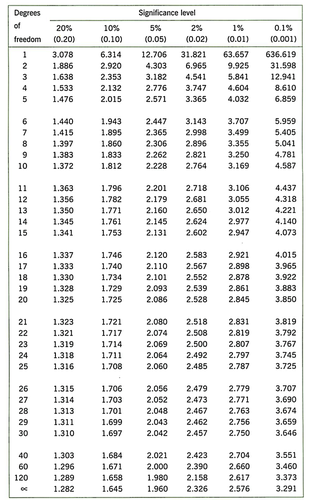
what do you do with value calculated in t-test?
then must calculate degrees of freedom using this equation: df = (n1 + n2) - 2
compare df value with table
if your t-test value is lower than the value at 5% then you have to accept the null hypothesis because you can't be more than 95% confident that the results are due to chance
e.g if df=18 for test value of 2.07, have to accept the null hypothesis bc 2.07 < 2.10
*basically the higher the t-test value for a particular df, the more likely it is to be significant
What is a null hypothesis?
null hypothesis states that two variables are not related and any observed difference would be due to chance.
e.g There will be no significant difference in/of ....... compared with .......
MUST accept or reject null hypothesis
What does Spearman's rank correlation coefficient look for?
Relationships between data sets
whether they are correlated (negative correlation, positive correlation, no correlation)
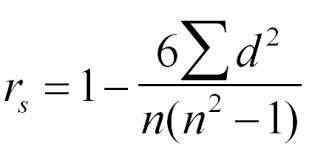
How is the correlation coefficient calculated (for Spearman's rank)?
rs = correlation coefficient
d = difference in ranks
Σ = sum of
n = no. of pairs of data
How do you work out the strength of correlation from a Spearman's rank?
might have to calculate df
OR
n = no. of pairs of data, find correct n row in table, go along to p=0.05 value, and compare rs value to p = 0.05 value
if rs is higher than p=0.005 value then only 5% chance the correlation was by chance i.e 95% confident that correlation was not due to chance
e.g if rs = 0.6500 when n=10, less than 5% that correlation was due to chance, however not less than 2% that correlation was down to chance
what is an adaptation?
characteristics that increase an organism's chance of survival and reproduction
What are the three types of adaptation?
Anatomical
physical features internal + external
behavioural
the way an organism acts
physiological
processes that take place inside an organism
examples of anatomical adaptations
Body covering
e.g feathers help bird to fly, fur helps bears stay warm, waxy cuticle, spikes to deter hebivores
camouflage
harder for predators to spot it
teeth
for diet e.g sharp teeth for meat, continuously growing teeth for tough plants
mimicry
fool predators into thinking its harmful
examples of behavioral adaptations
survival e.g playing dead
courtship e.g dance
increases chance of reproduction
migration
get better food, climate
hibernation
save energy
examples of physiological adaptations
poison production
antibiotic production
water-holding (e.g cacti, camel)
reflexes
temperature regulation
what are analogous structures?
structures that have evolved differently on different species for the same function
e.g tails on whales and fish perform same role but diff. structures
What is the term for when unrelated species share similar traits?
Convergent evolution
example of convergent evolution
marsupial mole and placental moles
similar because they have adapted to similar climates and food supplies
different reproduction methods reflect that they are still different
CHECK WITH CGP BOOK
what are selection pressures?
factors that affect the organisms chance of survival or reproductive success
e.g predation, competition for mates & resources, disease
natural selection process
organisms within a species show variation in characteristics due to different genes
organisms whose characteristics are best adapted to selection pressures have an increased chance of survival and successful reproduction (less well-adapted species die)
successful organisms pass the allele with the advantageous characteristic onto their offspring (organisms w/o aa less likely to successfully pass it on)
repeated for every generation and over time the proportion of individuals with the advantageous adaption increases. Frequency of the allele that codes for particular characteristic increases in populations gene pool.
over long time can lead to evolution of new species
How to answer question on why a particular characteristic increases in a population
identify adaptation
explain how it helps organism survive and reproduce
state this organism passes on allele with advantageous characteristic
state how this increases the alleles frequency in the population
4.1.3 CLASSIFICATION AND EVOLUTION
4.1.3 CLASSIFICATION AND EVOLUTION
4.1.2 BIODIVERSITY
4.1.2 BIODIVERSITY
What are the three levels at which biodiversity can be studied?
Habitat, species and genetic
what is a habitat?
where an organism lives
e.g woodland, stream
What is species richness?
The number of different species in an area
What is species evenness?
A comparison between the numbers of each different species in an area
what is genetic biodiversity?
Variety of genes that make up a species leading to different characteristics
e.g diff breeds in a species
what are the two types of sampling?
random and non-random
Random sampling
selecting individuals by chance
random generation of co-ordinates
Three types of non-random sampling
opportunistic
stratified
systematic
Which method of sampling is weakest?
Opportunistic
least likely to be representative
Which method of sampling uses organisms that are conveniently available?
Opportunistic
Which method of sampling divides a population into sub-groups and takes proportional samples?
Stratified
subgroups (strata) of a given population are each adequately represented within the whole sample population e.g male and female
Which method of sampling uses a transect line?
Systematic
transect = marking a line and taking samples at specified points
why isn't a sample fully representative?
how can you reduce this effect
sampling bias
use random sampling
chance
use a large sample size
Which method of sampling best reduces bias?
Random
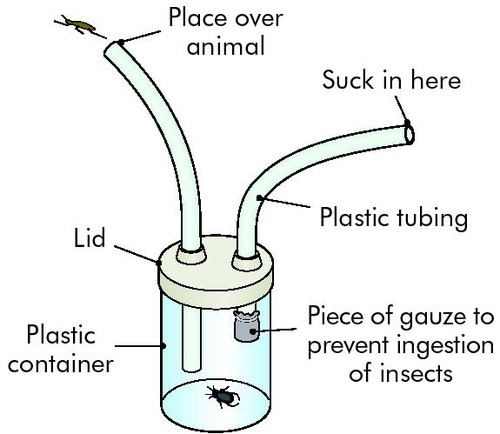
Pooter
used to catch small insects
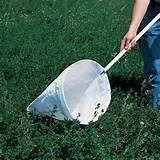
sweep nets
used to catch insects in areas of long grass
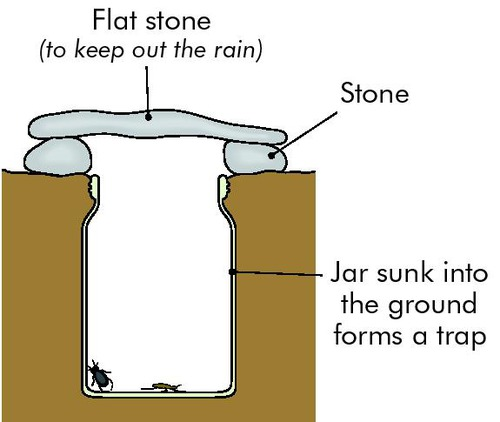
Pitfall traps
used to catch small invertebrates such as beetles, spiders and slugs
tree beating
Hitting the branches of a tree and collecting small animals that fall out on white sheet
collect small invertebrates
kick sampling
used for organisms in a river
river bank/bed is kicked to disturb the substrate
net is held downstream to capture organisms released into flowing water
What is measured using an anemometer?
Wind speed
ms-1
how is light intensity measured?
light meter
units = lux
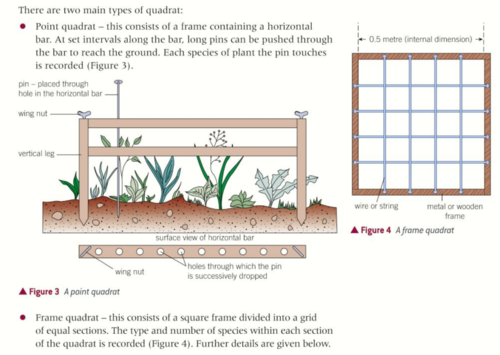
What is used to sample plants?
Quadrats
two types of quadrat
how to measure species richness
all above techniques e.g quadrats, pooters etc
how to measure species evenness
count total amount of different organisms
then calculate how many diff species present
e.g 10 total organisms:
if 9 aphids found and 1 ant this is less even then 2 ants, 3 aphids and 5 spiders
3 ways calculate number of species in a quadrat
frequency - count number of squares where the species present
percentage cover
Capture-mark-release-recapture
used for estimating population size
lots of individuals of a species captured
organisms marked and released
Another sample of individuals captured
By comparing the no. of marked individuals with the number of unmarked individuals in 2nd sample, can estimate population size.
What is the formula of Simpson's index of biodiversity?
N = total number of organisms of all species
n = the total number of organisms of a particular species
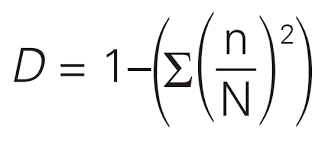
what does it mean when the Simpson's index of biodiversity is closer to 1?
closer to 1 = more diverse
closer to 0 = less diverse
higher the value the more diverse the habitat
What is monoculture?
Planting only a single species of crop
low biodiversity
how is genetic biodiversity created?
differences in alleles among individuals of a species
more alleles present, more genetically biodiverse
why are species with greater genetic biodiversity less likely to go extinct?
more likely to adapt to changes in the environment
bc more likely there are organisms within the population that have an advantageous allele
What can increase genetic biodiversity?
possible no. of alleles in population must increase
mutations in the DNA to create a new allele
interbreeding between different populations - alleles transferred
What can decrease genetic biodiversity?
possible no. of alleles in population must decrease
selective breeding (artificial selection) e.g pedigree animals
captive breeding programmes → small no. of individuals available to breed
artificial cloning
natural selection → species evolve w/o advantageous alleles die out
genetic bottlenecks → few individuals survive an event and only alleles of surviving members available to pass onto offspring
founder effect → small no. of individuals create a new colony
genetic drift → random nature of alleles being passed on means frequency of occurrence of an allele will vary, can lose alleles
How to measure genetic biodiversity?
measure polymorphic genes (genes w/ more than 1 allele)
greater the no. of polymorphic genes, greater the genetic biodiversity

factors affecting biodiversity
deforestation
agriculture
climate change (burning fuel leads global warming)
how does deforestation affect biodiversity?
reduces no. of trees present
species diversity reduced
destroys habitats
how does agriculture affect biodiversity?
deforestation
remove hedgerow habitat
pesticides and herbicides
monocultures - only a few animal species supported by 1 plant
What are the three major reasons for conserving biodiversity for humans?
Aesthetic, economical and ecological