week 9 graphs
1/12
There's no tags or description
Looks like no tags are added yet.
Name | Mastery | Learn | Test | Matching | Spaced | Call with Kai |
|---|
No analytics yet
Send a link to your students to track their progress
13 Terms
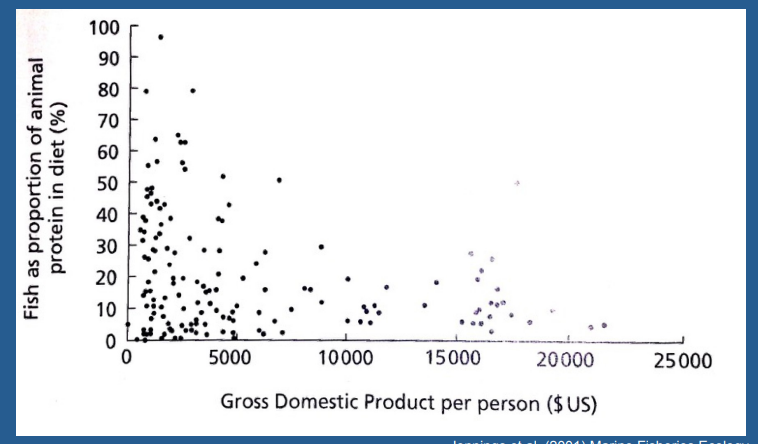
What does this graph show
Developing nations rely more heavily on fish than rich countries, with proportion of fish in diet increasing with decreasing gross domestic product. This tells us that sustainability of the fishing industry is ethically important for global food security and economic stability.
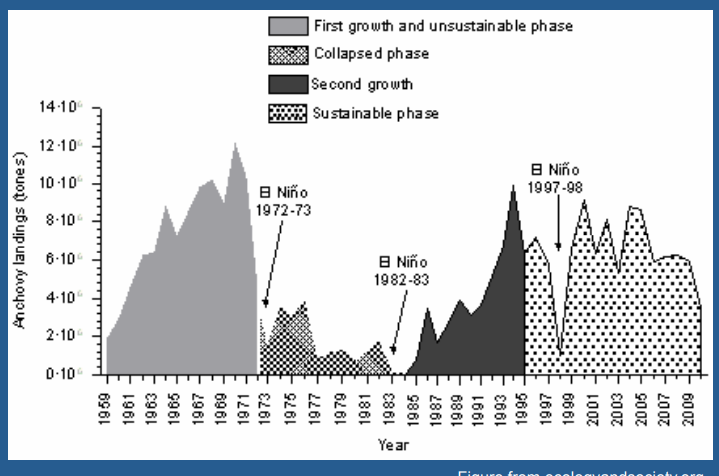
What is happening in this image
Demonstrates repeated collapse of fish populations of the peruvian anchoveta, with collapses occuring at times of environmental change due to el nino events. This is because environmental cahnge affects population growth rate, competition outcomes and food web structure, which means the maximum sustainable yield varies on these years.
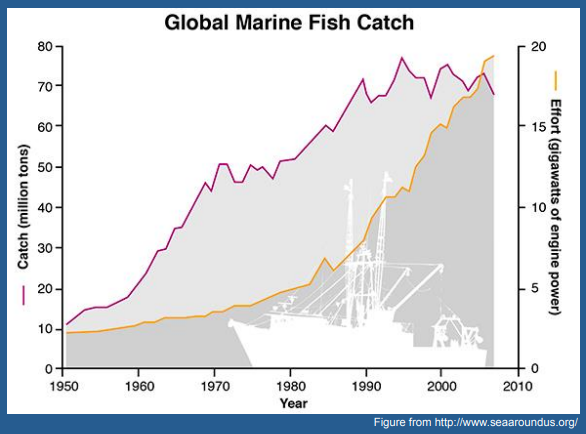
Explain
THis graph shows that the effort (in terms of energy) used to catch fish is increasing disproportionately to the increase in fish catchment. This indicates that there is a depletion in fish stocks in fisheries increasing the energy neccesary to catch the same amount of fish. This is due to overfishing, which leads to population declines or population crashes which are unable to recover.
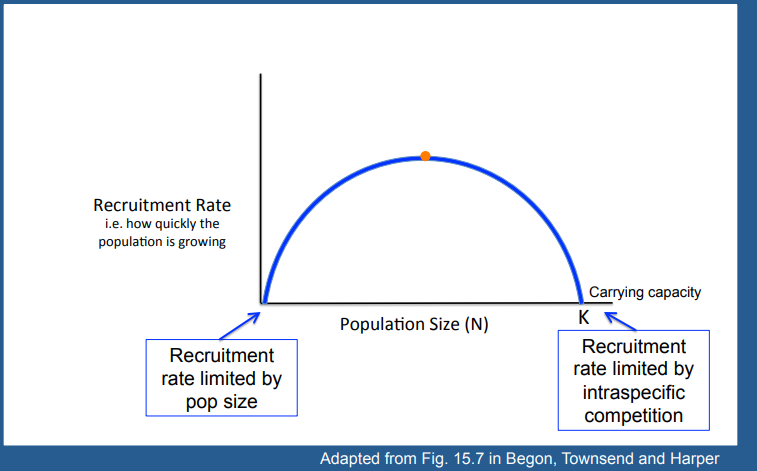
Explain this graph
Graph shows how maximum sustainable yield is determined, with the maximum sustainable number sitting at the point where population size is half its carrying capacity. At this point the population is also experiencing exponential growth, or its fastest rate of increase, which at higher levels, as in logistic growth models is limited by intraspecific competition. Therefore fisheries should aim in theory to keep fish populations at the equilibrium size to prevent depletion and ensure long-term sustainability.
What is occuring in this graph
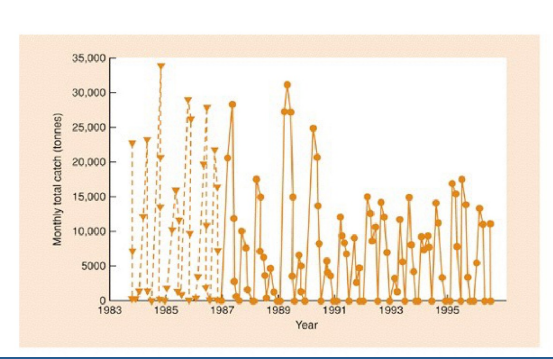
Constant escapement, where fish populations are not fished during breedijng season, seen in the routine dips in monthly total catch. This allows population recovery ensuring the sustainability of fish stocks over time.
Explain graph
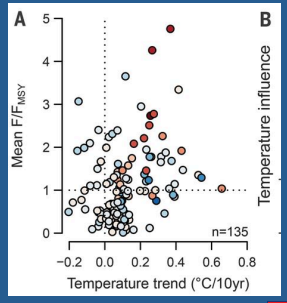
Shows that the most overfished populations are those with the greatest increase in temperature, this indicates that heavily fished populations are more vulnerable to climate change effects, leading to further declines in fish stocks.
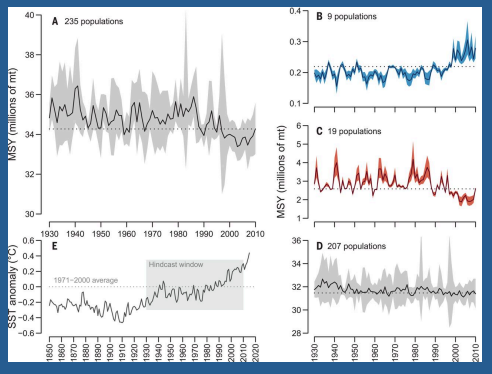
Shows that maximum sustainabble yields in many populations are decreasing over time.
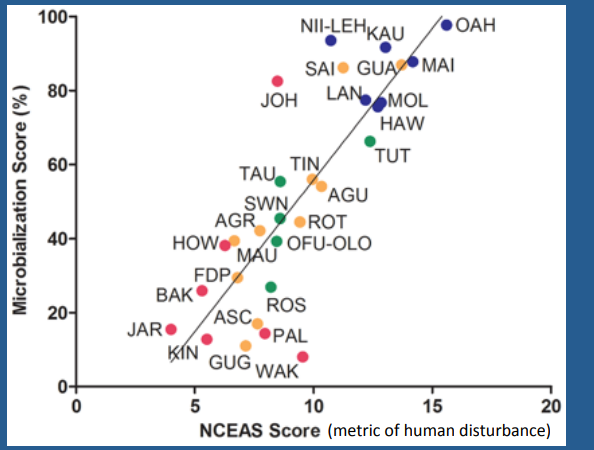
Shows that human disturbance correlates with reef microbialisation. This is because fishing down the food web causes changes in mean trophic level, altering the strength of top down control on microbial communities, causing them to proliferate
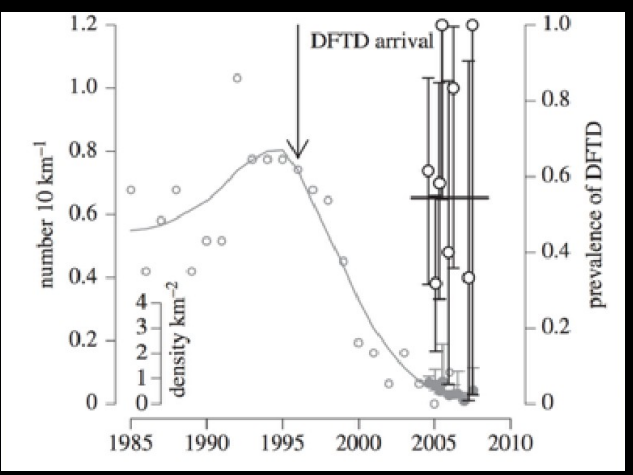
Showing that devil tumour facial disease is density independent, The prevalance of the disease does not decrease despite a dramatic decrease in population size.
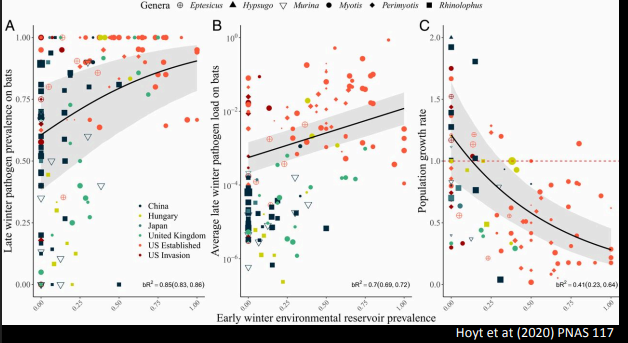
Shows that the prevalance and pathogen load of white nose syndrome increases with an increased prevalance in environmental reservoirs, while the population growth rate declines in increased prevalance. Shows that the greatest impact is on introduced populations (red and orange dots).
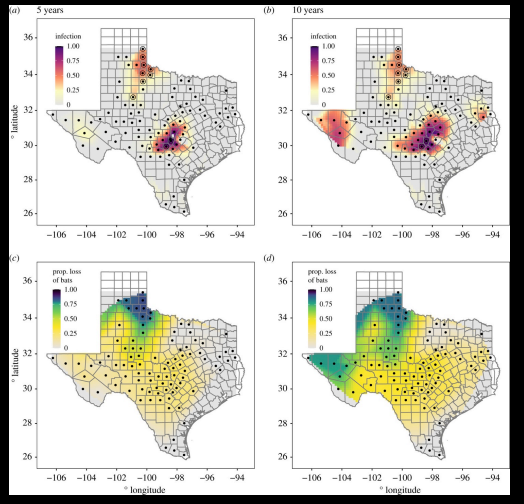
suggests that higher lattitude increases the likelihood of population extinction with WNS. This is attributed to colder temperatures affecting bat hibernation patterns and susceptibility to the pathogen. despite higher infection intensity in patches in low lattitudes populatiion loss is less pronounced due to warmer temperature.
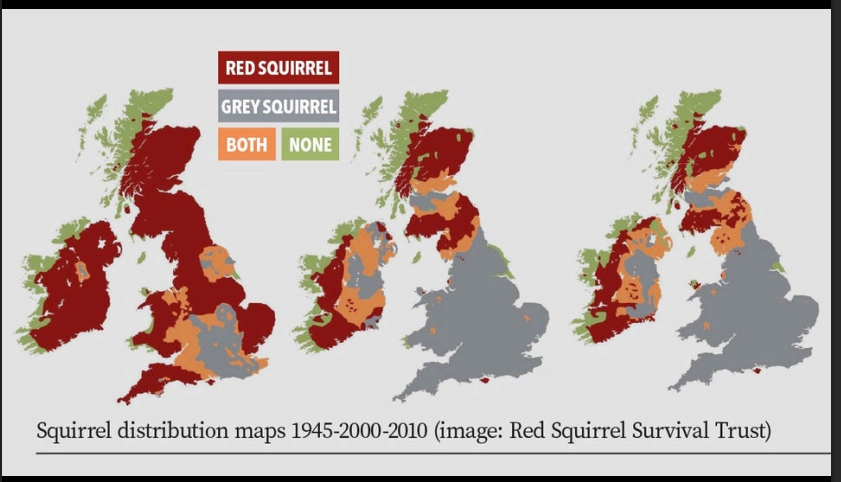
Shows how distrubution of red and grey squirreld has changed over the years, with the invasive grey squirrel increasingly replacing the native red squirrel in various regions. THis is attributed to the grey squirrel acting as a carrier for squirrel pox, causing population decline in red squirrels.
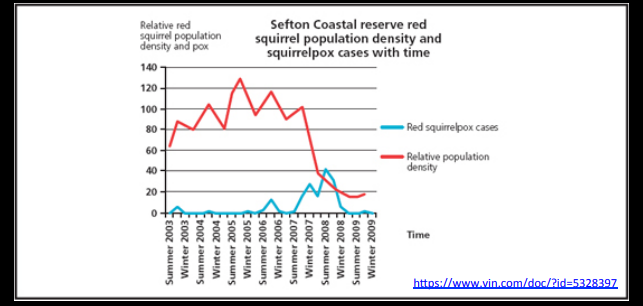
Shows squirrel pox is lethal to red squirrels. shows squirrel pox is density dependent, with cases decreasing with a decrease in the squirrel populations