Production Possibilities Curve
1/17
There's no tags or description
Looks like no tags are added yet.
Name | Mastery | Learn | Test | Matching | Spaced |
|---|
No study sessions yet.
18 Terms
Production of Possibilities Curve
maximum combinations of how different goods can be produced
Production Possiblities Curve
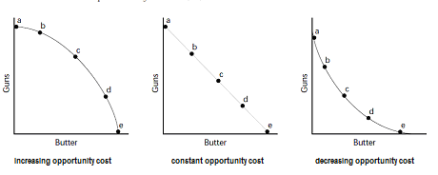
Increasing opportunity: this economy produces more and more corn, the opportunity costs in terms of robot production increases due to imperfectly adaptable resources
Graph 4: linear production possiblities curve
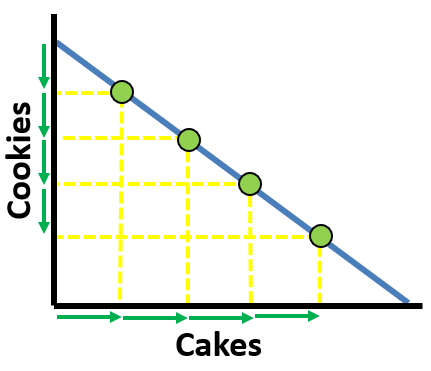
all productive possibilities curve
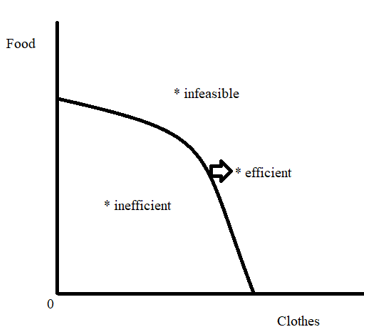
Graph 5 : points on the curve are inefficient
long-run equilibrium meaning that all resources are being used to their maximum potential
Graph 6: points on the curve are inefficient meaning indication of resources not being used to their maximum potential
Graph 8: points on the curve are impossible due to scarcity
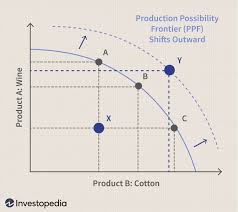
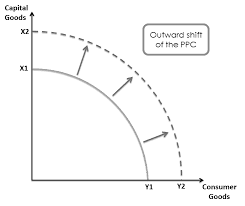
Outward shift of the production possibilities curve
comes from an increase quality and quantity of resources.
It is economic growth when increase in long run potential real GDP
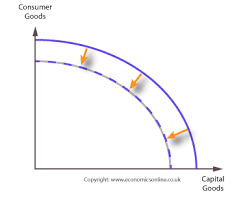
Inward shift
decrease in quality or quantity of resources
no longer be possible to produce as much as corn/robots in this economy
Opportunity cost
most desirable alternative given up when you make a choice
Factors of Production
land,labor,capital
Absolute advantage
the producer that can produce the most output or requires the least amount of inputs
Comparative advantage
the producer with the lowest opportuntiy cost
Countries should trade if they have a relatively lower opportunity cost
they should specialize in the good that is cheaper for them to produce
Formula: quantity of Good A for Country x/Quantity of Good B for Country x
Terms of tRADE
Both countries can benefit from trade if they each have relatively lower opportunity costs. The agreed upon conditions that would benefit both countries.
Ex. trade 1 ton of weight for 1.5 tons of sugar
circular flow model
an economic model that shows how money, resources, and products move through an economy. The model is also known as the circular flow of income model because the flow of money between sectors is used to measure a country's GDP or national income.
In a simplified circular flow model, there are two economic actors: households and businesses. Money flows from businesses to households in the form of wages and goods and services, and then back to businesses as payment for products. More detailed models include the government, banking systems, and foreign markets.
private sector
part of the economy that is run by individuals and businesses
public sector
part of the economy that is controlled by the government
factor payments
payment for the factors of production, namely rent, wages, interest, and profit
transfer payments
when the government redistributes income