Demand/supply and demand/supply curves
1/12
There's no tags or description
Looks like no tags are added yet.
Name | Mastery | Learn | Test | Matching | Spaced | Call with Kai |
|---|
No analytics yet
Send a link to your students to track their progress
13 Terms
Define demand
Demand is how much consumers are willing and able to purchase of a product at a given price
What happens to demand as prices rise
Demand falls as fewer people are willing and able to purchase the product
What happens to demand as prices fall
Demand increases as more people are willing and able to buy the product

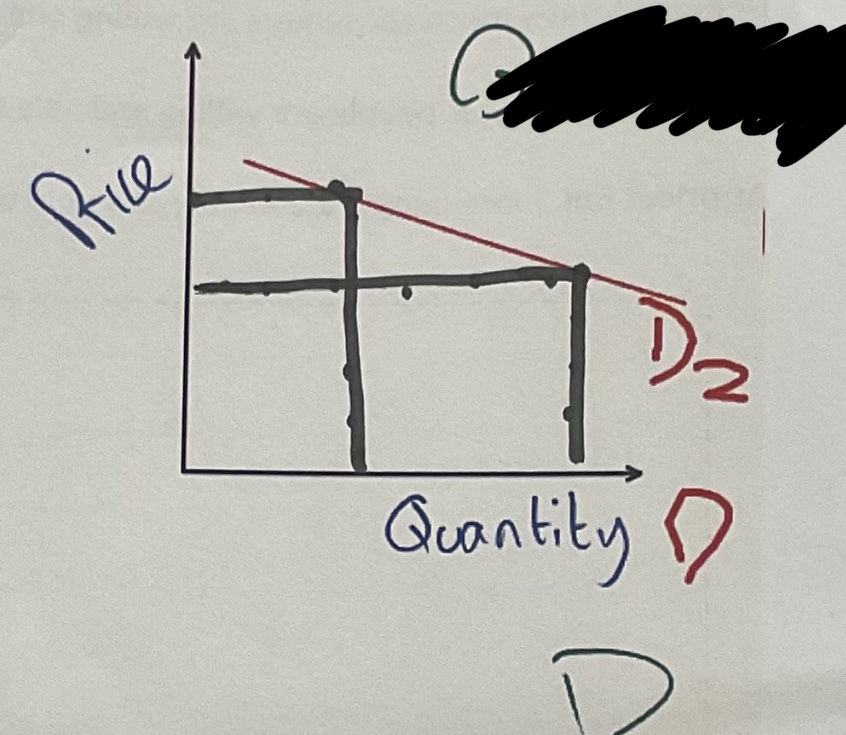
What does this graph represent demand for
Snacks

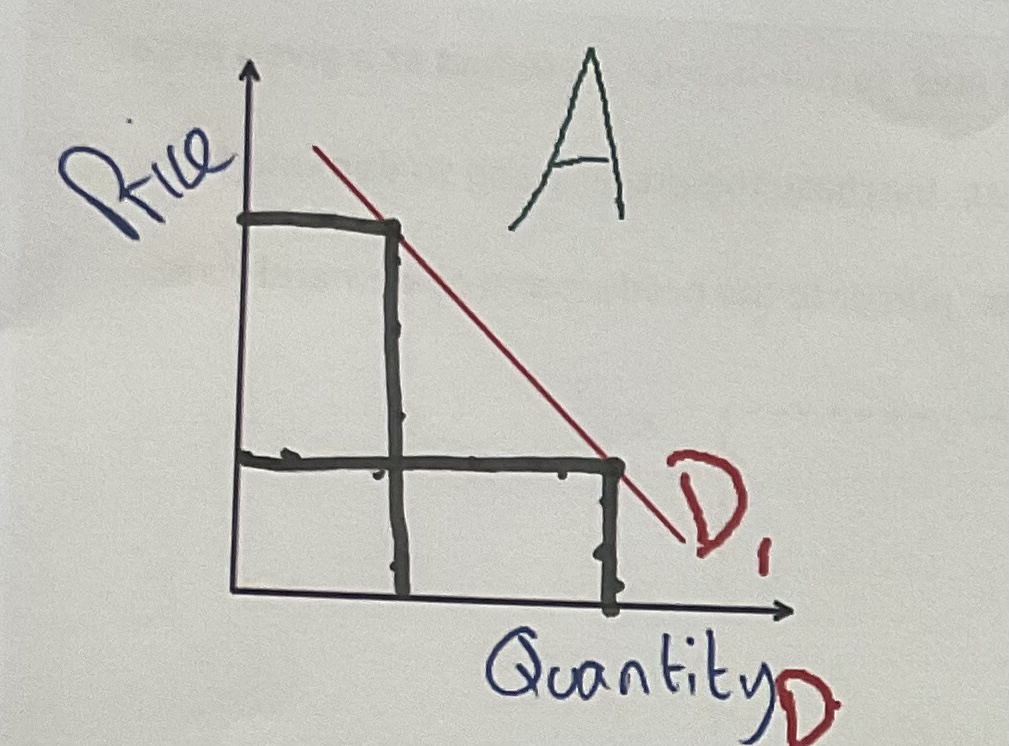
What does this graph represent the demand for
Luxury goods

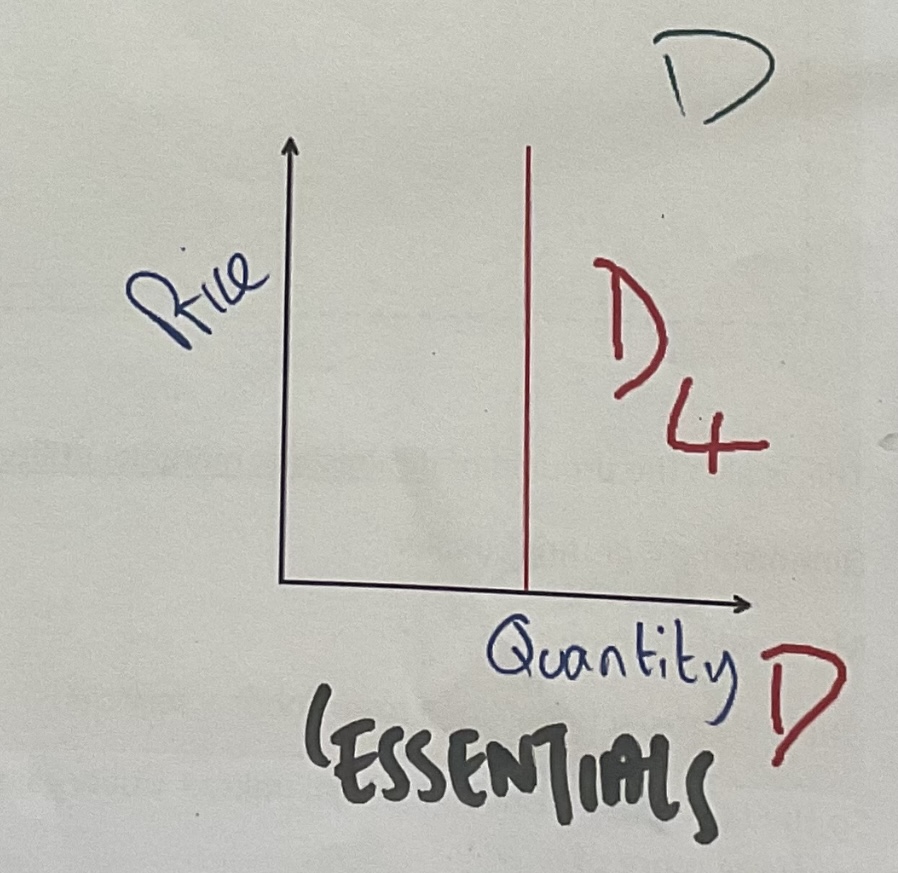
What does this graph represent the demand for
Essential items
Define supply
How much producers are willing and able to produce of a product at a given price
What happens to supply As prices fall
It also falls as firms are less willing and able to produce product
What happens to supply As prices rise
It also rises as firms are more willing and able to produce product
What causes supply curves to shift
things become easier to produce
Changes in production cost
Taxes
Subsidys

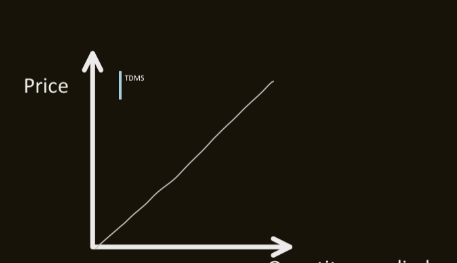
What kind of curve is this
Supply curve
What do supply curves represent
The quantity of goods able to be produced by producers at a given price
State the logic chain for supply
Higher price, more profit,more incentive to produce