06 - Game of Life: Rivals, Predators, and Coexistence Rules
1/95
There's no tags or description
Looks like no tags are added yet.
Name | Mastery | Learn | Test | Matching | Spaced | Call with Kai |
|---|
No analytics yet
Send a link to your students to track their progress
96 Terms
when does competition occur
Competition occurs when individuals or species vie for the same limited resources (e.g., food, light, space, mates), reducing availability for others
competition is a (__ , __) Interaction
( ‒ , ‒ ) Interaction
Competitive Interactions Have a Negative Effect on All Competitors
Types of Competition
Intraspecific Competition
Interspecific Competition
Intraspecific Competition
Occurs within the same species.
• Example: Two oak trees competing for sunlight and soil nutrients.
Interspecific Competition:
Occurs between different species.
• Example: Lions and hyenas competing for prey in the same habitat
Forms of Competition
A. Resource (Exploitation) Competition
B. Interference (Direct) Competition
Resource (Exploitation) Competition
Indirect: Individuals or species use the same resource, reducing its availability to others.
Example: Plants absorbing soil nitrogen faster than neighbouring plants.
Interference (Direct) Competition
Direct interactions: Individuals actively prevent others from accessing resources.
Example: Allelopathy in plants (chemical inhibition) or territorial defence in animals.
niche overlap graphs between two species in three different situations:
no overlap
slight overlap
substantial overlap
niche overlap graph
The y-axes show resource use frequency by each species.
The x-axes show variation in the resource along a gradient
For example, if the resource is seeds, this could represent variation in seed size, lipid content, shell hardness, and so forth.
The Venn diagrams are another way to illustrate this overlap in resource use.
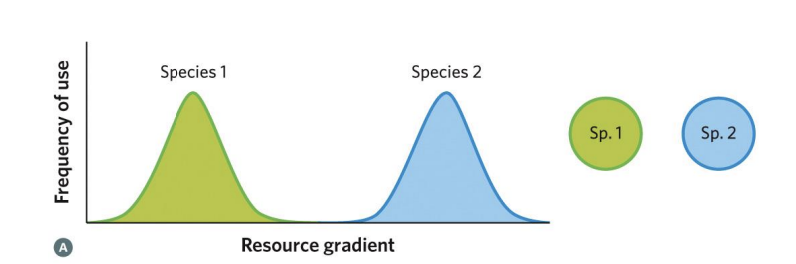
no overlap in resource use: the species do not compete
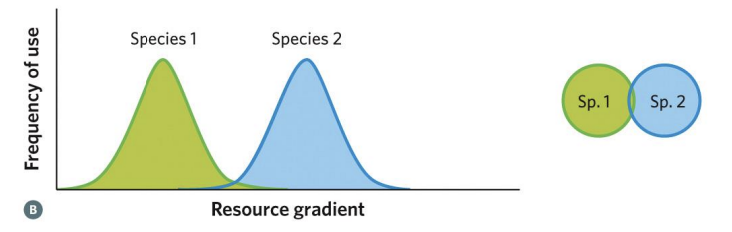
slight overlap: the species have some competitive effect on each other
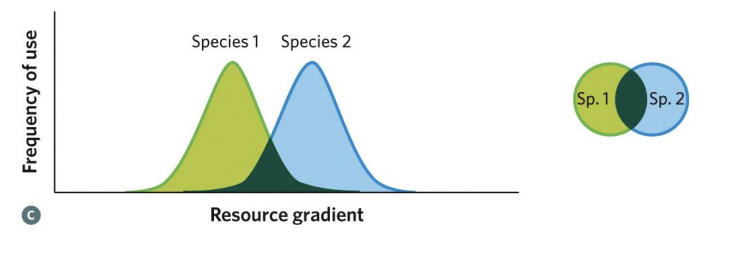
substantial overlap: the effects of interspecific competition increase
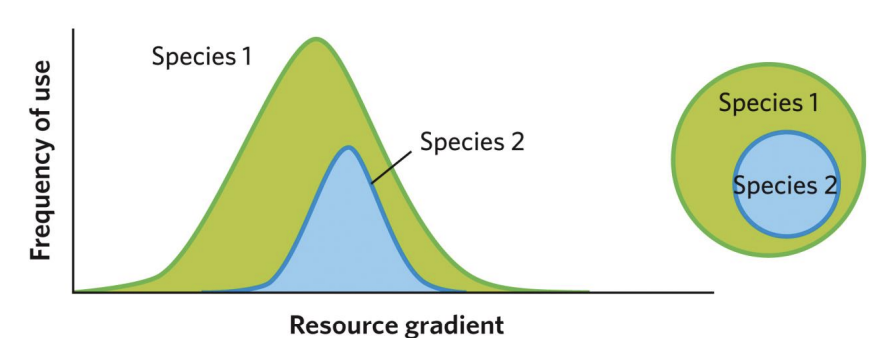
When there is complete overlap in resource use (or complete niche overlap), two species _____
cannot coexist due to competitive interactions. In this illustration, species 2 has no resource it can access outside the influence of species 1.
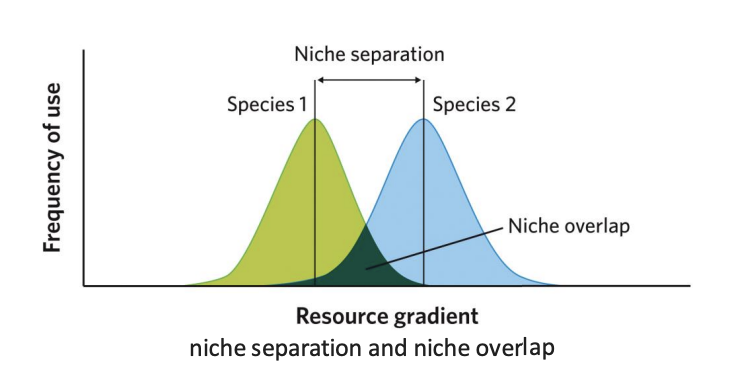
niche separation vs niche overlap
niche separation - When species use different resources or occupy different parts of the same resource gradient.
niche overlap - When two species use some of the same resources (e.g., food, habitat, time of activity).
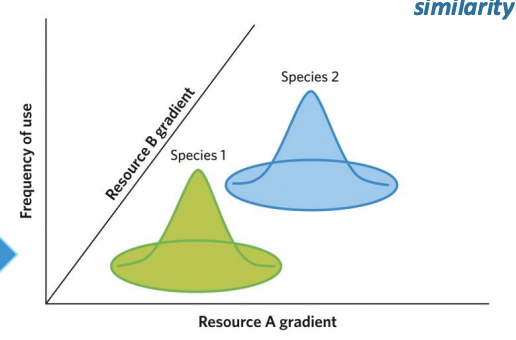
In this configuration, showing two species’ resource use along two different resource axes, there is no overlap between the two species along the resource B gradient, but some overlap along the resource A gradient.
Georgii F. Gause’s experiment in 1930: Two species of paramecia used in the interspecific competition experiments:
A. Paramecium aurelia and
B. Paramecium caudatum
Gause grew two species of paramecia, separately and together, and looked at the population growth in each situation
• When the two species were grown apart, they exhibited logistic growth;
• When grown together, there was interspecific competition, in which P. aurelia “won” and P. caudatum “lost” (Gause [1934] 2019).
![<p>• When the two species were grown apart, they exhibited logistic growth;</p><p>• When grown together, there was interspecific competition, in which P. aurelia “won” and P. caudatum “lost” (Gause [1934] 2019).</p>](https://knowt-user-attachments.s3.amazonaws.com/6f6900c1-b9d2-4539-97a6-6eaebddbf679.png)
fundamental niche
the set of environmental conditions that a species could tolerate
realized niche
the set of environmental conditions where the species occurs
typically smaller than its fundamental niche as species are typically excluded from the extrremes of their niche by better adapted, superior competitors and other factors
Competition restricts species to
Competition restricts species to only part of their fundamental niche, i.e., their realized niche.
Species may be excluded from certain areas by
superior competitors, or, in the extreme case, even go extinct.
It is _____ to demonstrate that a specific absence is due to competitive effects
difficult
Ghost of Competition Past
If a species does not occur somewhere, how do you distinguish between whether it previously went extinct due to competition or alternative hypotheses?
Past competition may explain many current ecological patterns, but in most cases, we will never know.
What did Taniguchi and Nakano (2000) find about the effects of water temperature on competition between white-spotted char and Dolly Varden trout?
At warmer temperatures, both species showed more aggression when raised alone, but when raised together, white-spotted char were much more aggressive than Dolly Varden trout. This suggests that increasing temperatures could lead to competitive exclusion of Dolly Varden. Growth rate differences between the two species were minimal when raised separately, regardless of temperature.
mountain lions - fundamental and realized niche
In theory, mountain lions can thrive across a vast range of ecosystems—from Canadian coniferous forests to Patagonian grasslands— feeding on various prey, including deer, guanacos, and smaller mammals. (fundamental niche)
In North America, human development and competition with wolves restrict mountain lions mainly to rugged, forested, or mountainous regions.
In South America, despite their wider potential, they are mainly limited to remote parts of the Andes and Patagonia because of livestock farming and habitat loss
(realized niche)
While the fundamental niche of the mountain lion spans most of the Americas across diverse ecosystems, its realized niche has become fragmented and reduced due to ecological pressures and human encroachment.
The principle of competitive exclusion suggests that species are more likely to co-exist when they use
resources in different ways
Long-Term Competitive Outcomes
Resource partitioning and character displacement are consequences of the pressures exerted by competition
Resource partitioning:
species use a limiting resource in different ways.
Ex: Warblers in Coniferous Forests:
MacArthur’s classic study showed that five species of warblers coexist by feeding in different parts of spruce trees(top, middle, outer branches).
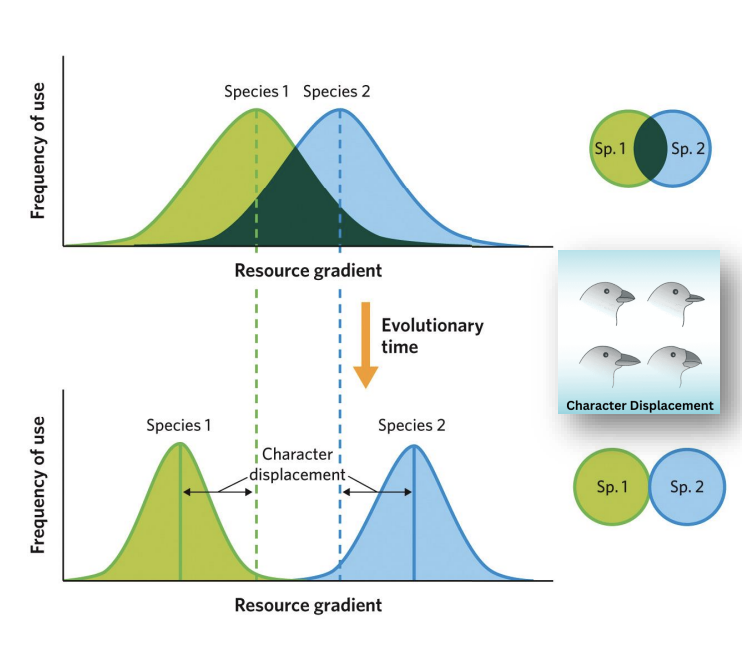
Character displacement:
an adaptive shift in the population-level of a trait that is critical to resource acquisition and other competitive interactions
Autotrophs
Autotrophs are organisms that can produce their own food from inorganic substances such as carbon dioxide and water,
where do autotrphs get energy from
typically using energy from sunlight (photosynthesis) or from chemical reactions (chemosynthesis).
autotrophs example
Example: Plants, algae, and some bacteria (e.g., cyanobacteria).
Heterotrophs
Heterotrophs are organisms that cannot produce their own food
where do Heterotrophs get their energy from
must obtain energy and nutrients by consuming other organisms (plants, animals, or decomposed organic matter).
Heterotrophs example
Example: Humans, animals, fungi, and most bacteria.
Exploitative Interactions
Predation, Parasitism, Herbivory, and Detritivorism
Predation
an interaction in which one organism (the predator) kills and consumes another organism (the prey) for energy and nutrients.
Example: A Tiger hunting and eating a deer.
Parasitism
a relationship in which one organism (the parasite) lives on or inside another organism (the host) and derives nutrients at the host’s expense, often without immediately killing it.
Example: parasitic wasp cocoons feeding on hornworm caterpillar
Herbivory
an interaction where an organism (the herbivore) consumes parts of plants or algae. It may reduce plant fitness but usually doesn’t kill the entire plant.
Example: Caterpillars feeding on leaves; deer grazing on grass.
Detritivory
the process by which organisms called detritivores feed on dead organic matter (detritus), playing a key role in decomposition and nutrient cycling.
Example: Earthworms, millipedes, and dung beetles feed on decomposing plant and animal material.
specialist species
A specialist species is adapted to thrive in a narrow range of environmental conditions or depends on a limited type of resource (e.g., specific food, habitat, or host).
Specialists often have highly specific adaptations that make them efficient in their niche but vulnerable to environmental changes.
specialist species - advantage
❑ Advantages: High efficiency in stable environments.
specialist species - disadvantage
❑ Disadvantages: Poor adaptability to change or resource loss.
specialist species - example
Koala (Phascolarctos cinereus): Feeds almost exclusively on eucalyptus leaves
Panda (Ailuropoda melanoleuca): Specializes in eating bamboo.
generalist
A generalist species can survive in a wide range of environments and utilize a variety of resources. They are adaptable and can shift diets, habitats, or behaviours when conditions change
generalist - advantage
❑ Advantages: High adaptability to environmental variability and human disturbance.
generalist - disadvantage
❑ Disadvantages: Less efficient at exploiting any single resource.
generalist - example
Most carnivores are generalists with broad diets,
•Raccoon (Procyon lotor): Omnivorous and thrives in urban, rural, and forest environments.
•Crows and rats: Consume diverse food sources and occupy varied habitats.
Consumer-Resource Coevolution
Adaptations to avoid being eaten
Many species have evolved adaptations to avoid being eaten. Similarly, many consumers have evolved adaptations to overcome defences.
life-lunch principle
the stakes are higher for the resource species in a consumer-resource encounter: it might lose its life, while the consumer might just lose out on a meal if unsuccessful
in general, evolutionary forces tend to act more strongly on resource species (prey, plants, etc.) due to the life-lunch principle
Primary Defenses
(prevent being found by the consumer)
Secondary Defences
(deter consumers from attacking)
Tertiary Defenses
(escape or fight back when attacked)
Exploitation is a ( ___ , ___ ) Interaction
(+ , ‒) Interaction
Exploitation is an interaction in which individuals of one species increase in fitness by consuming individuals (or parts of individuals) of another species, who experience a decrease in fitness
When two species interact with one another in an exploitative relationship, they influence each other’s population growth rates: an _______ in consumer abundance leads to a ______ in resource abundance, while an ______ in resource abundance leads to an ______ in consumer abundance.
an increase in consumer abundance leads to a decrease in resource abundance, while an increase in resource abundance leads to an increase in consumer abundance.
Possible outcomes of Exploitation include:
1. Resource extinction
2. Consumer Extinction
3. Consumer-Resource Cycles
4. Coexistence
Resource Extinction
Occurs when a consumer overexploits its resource population to the point that the resource cannot recover, leading to its extinction. Once the resource is gone, the consumer population also eventually declines due to a lack of food.
Resource Extinction example
Overfishing: The collapse of Atlantic cod populations in Newfoundland (1990s) due to overfishing by humans
Locust outbreaks: When locusts consume all vegetation in an area, leaving nothing for regeneration.
Resource extinction is common when
reproduction rates of the resource cannot keep up with exploitation pressure.
Consumer Extinction
Happens when the resource population becomes too low or inaccessible, leading to starvation or failure of the consumer population to persist.
Specialist consumers are more vulnerable than generalists because they cannot easily switch to alternative food sources.
Consumer Extinction example
Specialist predators: If a predator (like the Canadian lynx) depends on a single prey (snowshoe hare), and hare numbers crash, the lynx population also declines sharply.
Koalas: Depend on eucalyptus; if their food trees are destroyed, they can’t easily switch resources.
Consumer–Resource Cycles:
Dynamic oscillations in the population sizes of consumers and their resources over time.
Typically, resource populations increase first, followed by an increase in consumers, which then overexploit the resource, causing both populations to decline, and the cycle repeats
These cycles are stabilizing over evolutionary timescales and often lead to coevolutionary adaptations.
Consumer–Resource Cycles example
Lynx–Hare Cycle: In boreal forests of Canada, snowshoe hare and Canadian lynx populations fluctuate in 10- year cycles, as recorded in Hudson’s Bay Company furtrade data.
Coexistence
Occurs when both consumer and resource populations persist over time at stable equilibrium densities
This balance happens when exploitation is moderate and resource regeneration compensates for losses.
Most consumer-resource systems coexist without regular intrinsic cycles. Stabilizing effects include, for example, prey switching by consumers when prey are low (cf. below) and multispecies interactions.
Coexistence results from
feedback mechanisms such as predator switching, refuges for prey, or density-dependent controls.
Wolves and Deer: In Yellowstone - cooexistence
wolves control deer populations without wiping them out, maintaining ecosystem stability
Herbivores and Grasslands: coexistence
Grazing maintains plant diversity and prevents dominance by a few species
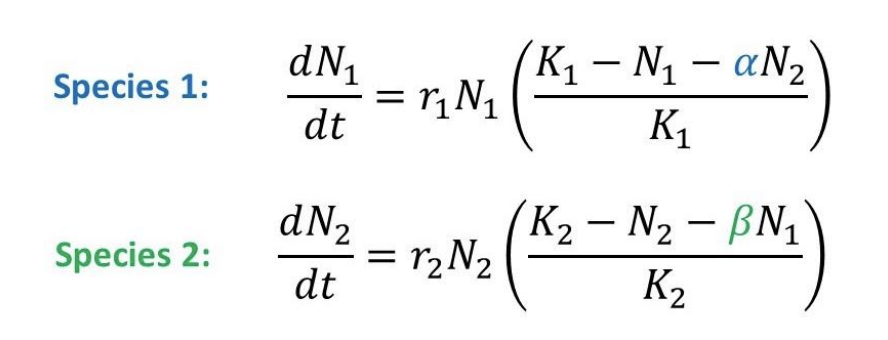
The Lotka-Volterra Model
describes how two species compete for shared resources and how their population growth affects each other over time.
The Lotka-Volterra Model equations
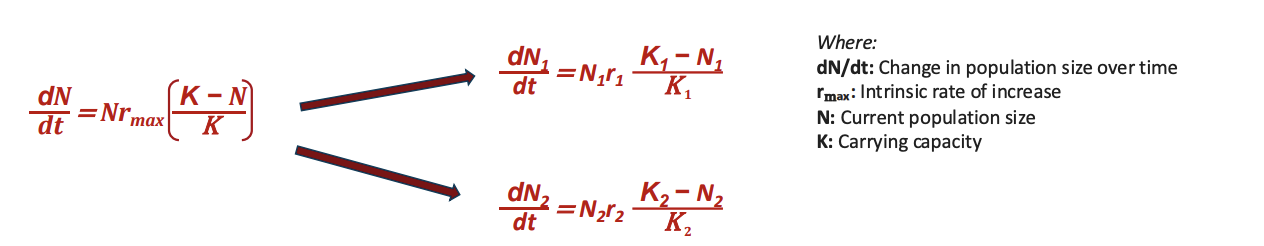
what does k-n/k mean
means that “the population will grow up to, but not exceed the carrying capacity.”
The Lotka-Volterra model helps explain
how interspecific competition shapes population dynamics, species coexistence, and ecological balance.
lotka-Volterra model predicts
several possible outcomes depending on α, β, K₁, and K₂:
1.Coexistence – when interspecific competition is weaker than intraspecific competition.
2.Competitive exclusion – one species drives the other to extinction.
3.Unstable equilibrium – small shifts in population determine which species dominates.
interspecific competition: lotka-Volterra model
Where:
N₁, N₂ = population sizes of species 1 and 2
r₁, r₂ = intrinsic growth rates
K₁, K₂ = carrying capacities
α = effect of species 2 on species 1
β = effect of species 1 on species 2
Competition Coefficients: α (alpha)
The effect of an individual of Species 2 on the growth of Species 1.
Example: If α = 0.5, one individual of Species 2 reduces Species 1’s growth half as much as one individual of its own species does.
Competition Coefficients: β (beta)
The effect of an individual of Species 1 on the growth of Species 2.
Example: If β = 1.2, one individual of Species 1 reduces Species 2’s growth 1.2 times more than one individual of its own species.
Example of Competitive Exclusion - Gause’s Paramecium Experiment
Species 1: Paramecium aurelia
Species 2: Paramecium caudatum
Grown separately → both reach carrying capacity
Grown together → P. aurelia dominates → P. caudatum declines
Example of Context-Dependent Coexistence - Grizzly Bears (Ursus arctos horribilis) & Black Bears (Ursus americanus)
Compete for salmon resources
When salmon abundant → coexistence (low α, β)
When scarce → grizzlies dominate (high β), black bear numbers drop
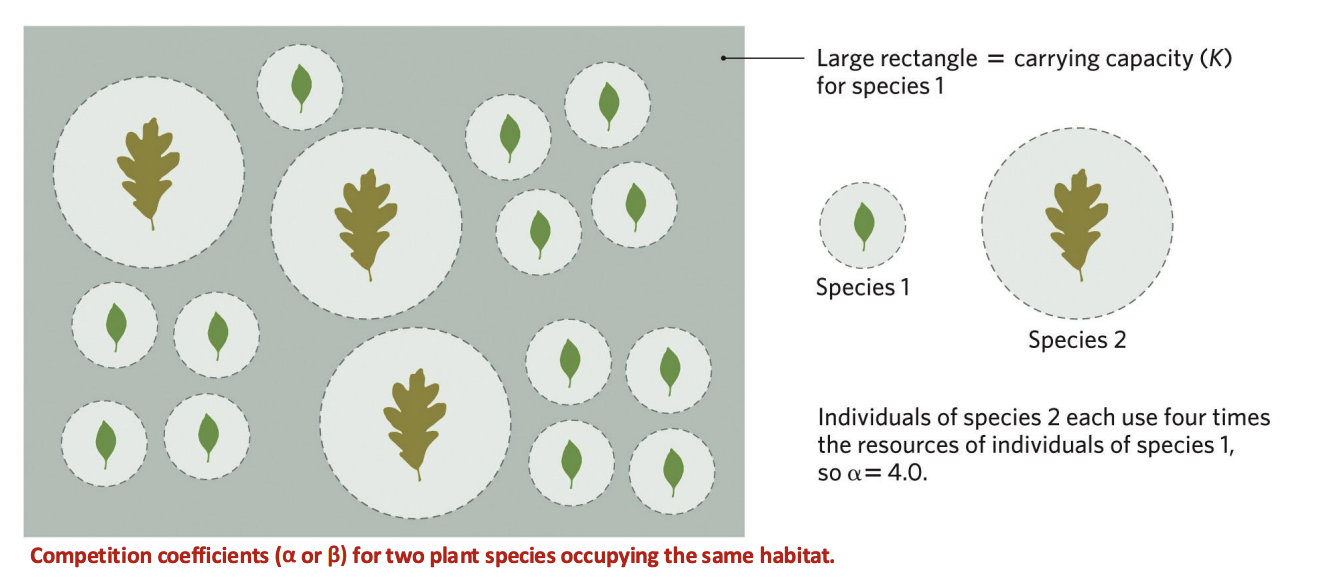
If the resource is space, then each individual of species 2 monopolizes or uses four times the resources that an individual of species 1 uses.
Thus, the competition coefficient (α) to convert resource use by individuals of species 2 into units of resource use by species 1 is equal to 4.
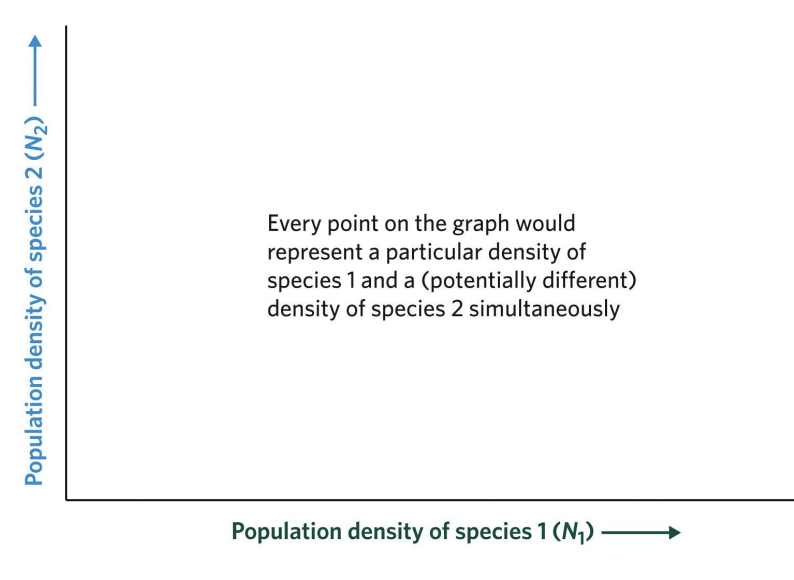
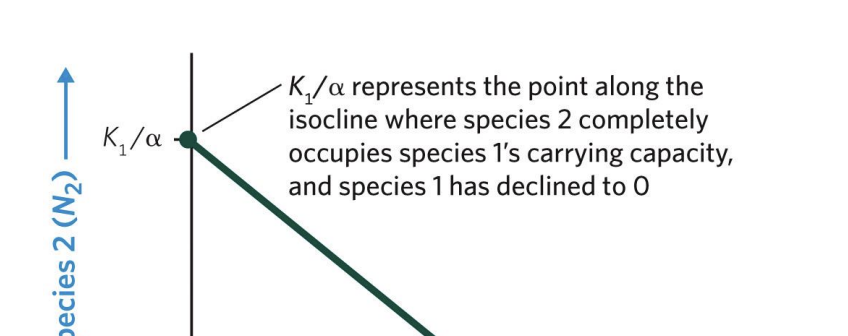
This is the basic layout of a phase-plane graph for the Lotka-Volterra two-species competition equations.
Each axis represents the population density of one competitor species (i.e., either N1 or N2 ), and
any point on the graph represents a population value for species 1 and a population value for species 2 simultaneously.
Example: 102, 37 or 20, 85
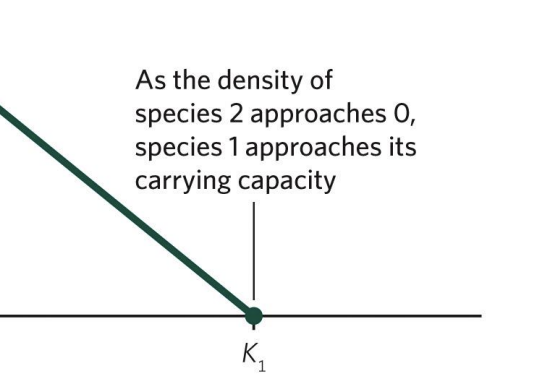
phase-plane graph: K₁
Carrying capacity of Species 1 — the maximum number it can sustain alone.
phase-plane graph: K₁/α
The equivalent number of Species 2 individuals that have the same limiting effect on Species 1 as one of its own individuals
α (alpha) = competition coefficient — the impact of Species 2 on Species 1.
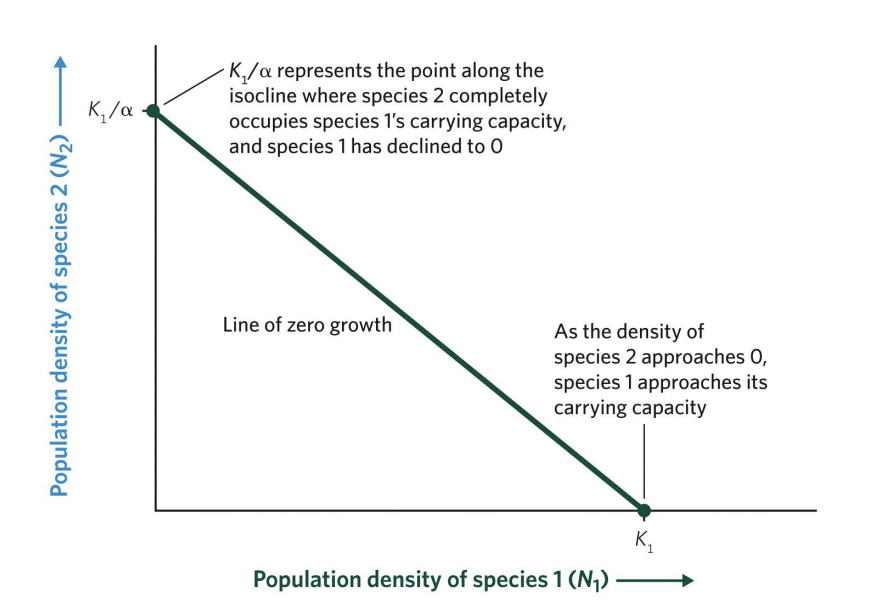
x and y axis, and what is the graph demonstrating
The x-axis (N₁) represents the population density of Species 1 (e.g., P. aurelia).
The y-axis (N₂) represents the population density of Species 2 (e.g., P. caudatum
This graph demonstrates competitive exclusion, a principle that states: “Two species competing for the same limiting resource cannot coexist indefinitely; one will outcompete the other.”
line of zero growth
The line of zero growth shows where Species 1’s population stops growing — it neither increases nor decreases.
As P. aurelia (Species 1) approached its carrying capacity (K₁), it outcompeted P. caudatum (Species 2), driving it to extinction — represented by the point where Species 2 density = 0.
isocline
An isocline is a line (or curve) on a graph that represents all the points where the rate of change of a variable is zero.
Population trajectories
Population trajectories (represented by arrows) above and below the zero-growth isocline for species 1 show the expected direction of change in population density of species 1 in different portions of the phase plane.


Arrows pointing to the right
indicate that the population density of species 1 increases through time.
Each arrow starts at a random spot that represents a combined density of species 1 and species 2.
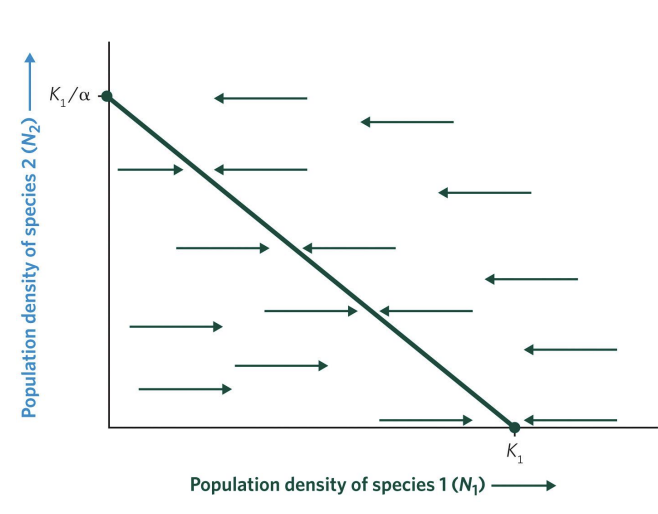
Arrows pointing left
indicate that the population density decreases through time.
Each arrow starts at a random spot that represents a combined density of species 1 and species 2.

At the line
Species 1’s population is stable — births balance deaths.

The line connecting K₂ to K₂/β
is the zero-growth isocline for species 2 — the set of points where species 2’s population remains stable (dN₂/dt = 0).

At the upper left of the line (near K₂)
species 2 is at or near its carrying capacity, meaning its population is stable because species 1’s density is very low (minimal competition).

move rightward, from upper left of the line
As we move rightward, species 1’s population density (N₁) increases, and competition intensifies.

K₂/β
The term K₂/β represents the point where species 1 completely occupies species 2’s carrying capacity — at this point, species 2’s population declines to zero.
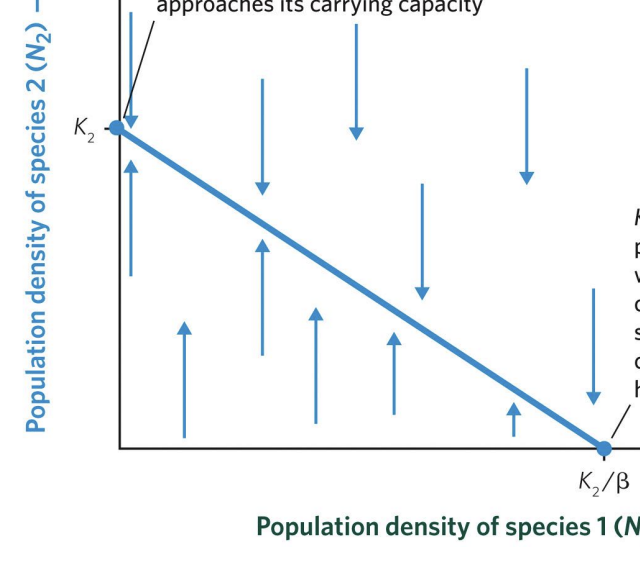
arrows
indicate the direction of population change:
• Below the isocline, species 2’s population grows (upward arrows).
• Above the isocline, species 2’s population declines (downward arrows).
This shows that the zero-growth isocline divides the space into two zones: growth vs. decline for species 2.
in a phase-plane graph if a line is higher than another what does that mean
higher line = superior competitor
The green line (Species 1) lies above the blue line (Species 2), meaning Species 1 can persist even when Species 2 is present
Conversely, Species 2 cannot survive at higher densities of Species 1 because its carrying capacity is surpassed.
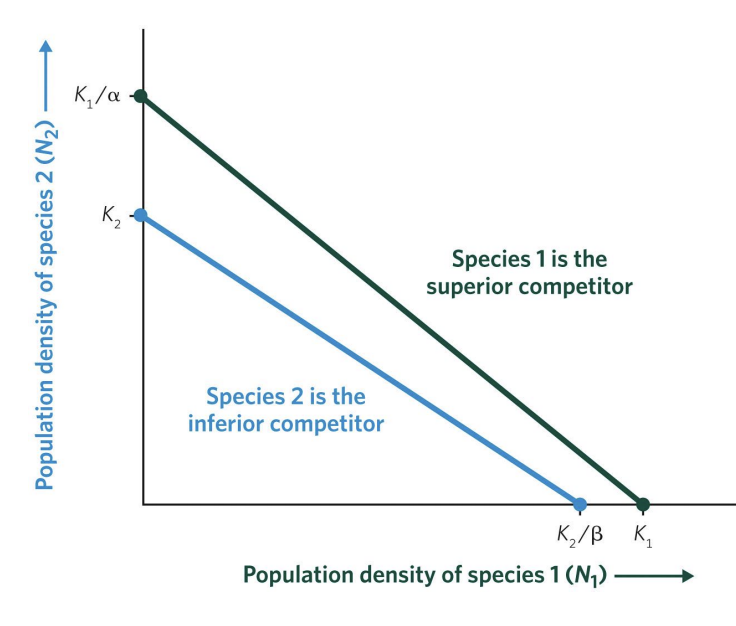

what is the green line and blue line:
Green line (Species 1): K1/αK₁/αK1/α indicates the maximum population density of Species 2 that Species 1 can tolerate before it stops growing.
Blue line (Species 2): K2/βK₂/βK2/β indicates the maximum population density of Species 1 that Species 2 can tolerate

Ecological Meaning
This situation shows competitive exclusion — the ecological principle that two species competing for the same limiting resources cannot coexist indefinitely.
The superior competitor (Species 1) has a higher carrying capacity (K₁) or lower competition coefficient (α or β), enabling it to outcompete the other.