Exam 3 Bios 230 uic
1/113
There's no tags or description
Looks like no tags are added yet.
Name | Mastery | Learn | Test | Matching | Spaced | Call with Kai |
|---|
No analytics yet
Send a link to your students to track their progress
114 Terms
Biotic:
living interactions
-Spruce tree, mosses, bacteria and fungi
Abiotic
nonliving (physical and chemical) interactions
-sunlight, nutrients, water
Population
a group of individuals of the same
species that inhabit a given area-potential for interbreeding
Distribution
The distribution of a species or population describes its spatial location
Geographic range
The area that encompasses all individuals of a
species
Crude density
number of individuals per unit
area
•Dispersion
refers to the evenness of the population's distribution through space. There are three population disperson patterns
- Random—an individual's position is independent of others
- Uniform—results from negative interaction among individuals
- Aggregated (or clumped)—results from patchy resources, social groupings
Abundance
the number of individuals in the population
and defines its size
Population density
the number of individuals per unit area
- The area over which the population is distributed
age structure
proportion of individuals in different age classes
- Prereproductive
- Reproductive
- Postreproductive
Range expansion
-can occur naturally through changes in
climate or other environmental conditions
-can result when humans introduce
species to a region where they did not previously exist
Invasive species
non-native, people have intentionally or
accidentally introduced to our region
Phragmites (common reed)
Spreading throughout the midwest.
Now fills many wetlands in Illinois
Demography
is the study of populations
• Population growth
• Age structure
• Life Tables
Population growth
how the number of individuals in a population increases or decreases with time
- Individuals added via birth and immigration
- Individuals removed via death and emigration
Closed Populations
births and deaths are only factors operating.
exponential growth
The intrinsic rate of increase, r, is a measure of a population's potential for growth
arithmetical increase
over a given interval of time, an unvarying number of new units is added to a population.
exponential increase
occurs when the number of new units added to a population is proportional to the number of units that exists.
Birthrate
number of individuals born as a proportion of the
total population
death rate
is the number of individuals who die in a given time period (expressed as a proportion) of the total population.
- If r is less than zero (deaths exceed births) the population is shrinking.
- If r is zero, the population is at zero population growth.
intrinsic rate of increase
a measure of a population's potential for growth
Rate of change
described by the derivative of the equation, dN/dt=rN
Life table
age-specific account of mortality
cohort
is a group of individuals born in the same period of time
Life table variables
- x = age classes (in units of years here)
- nx = the number of individuals from the original cohorts that are alive at the specified age (x)
- lx = the probability at birth of surviving to any given age (x)
-dx = age-specific mortality = the difference between
the number of individuals alive for any age class (nx)
and the next older age class (nx + 1)
- qx = age-specific mortality rate = the number of
individuals that died in a given time interval (dx)
divided by the number alive at the beginning of that
interval (nx)
mortality curve
plots the qx column against age (x)
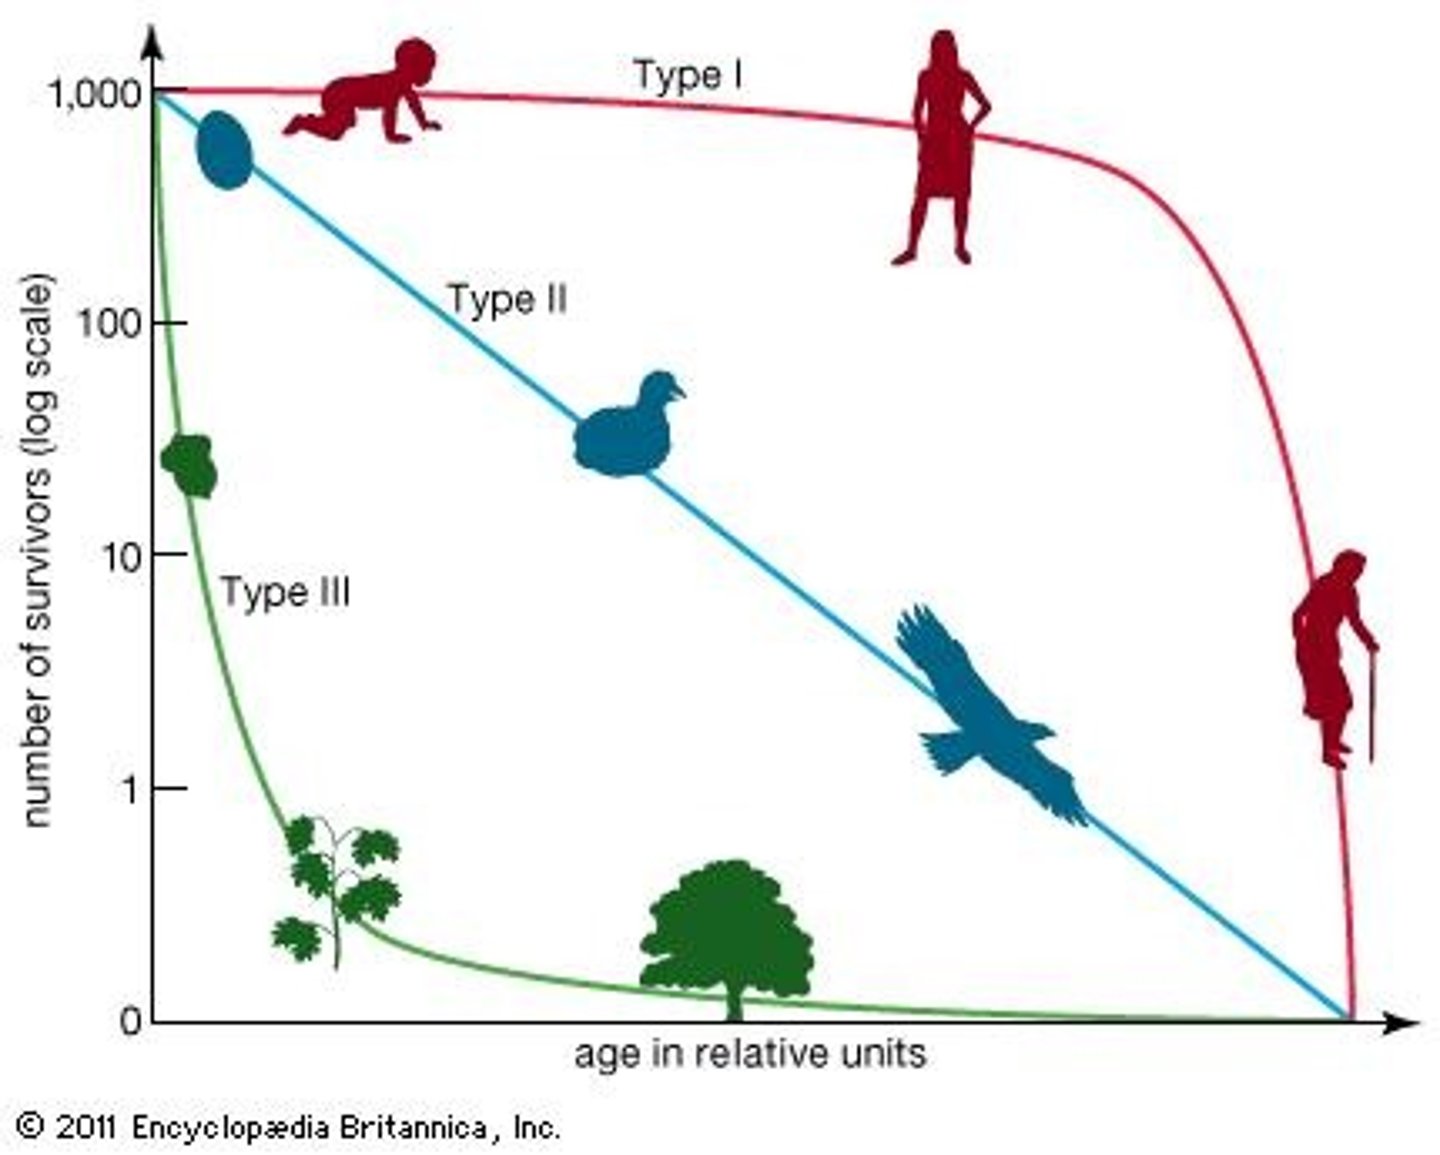
survivorship curve
plots the lx column against age (x)
Type I: Survivorship Curve
Type I: typical of populations in which individuals have long life spans, survival rate is high throughout the life span with heavy mortality at the end
-humans
-high parental care
-K-Strategists
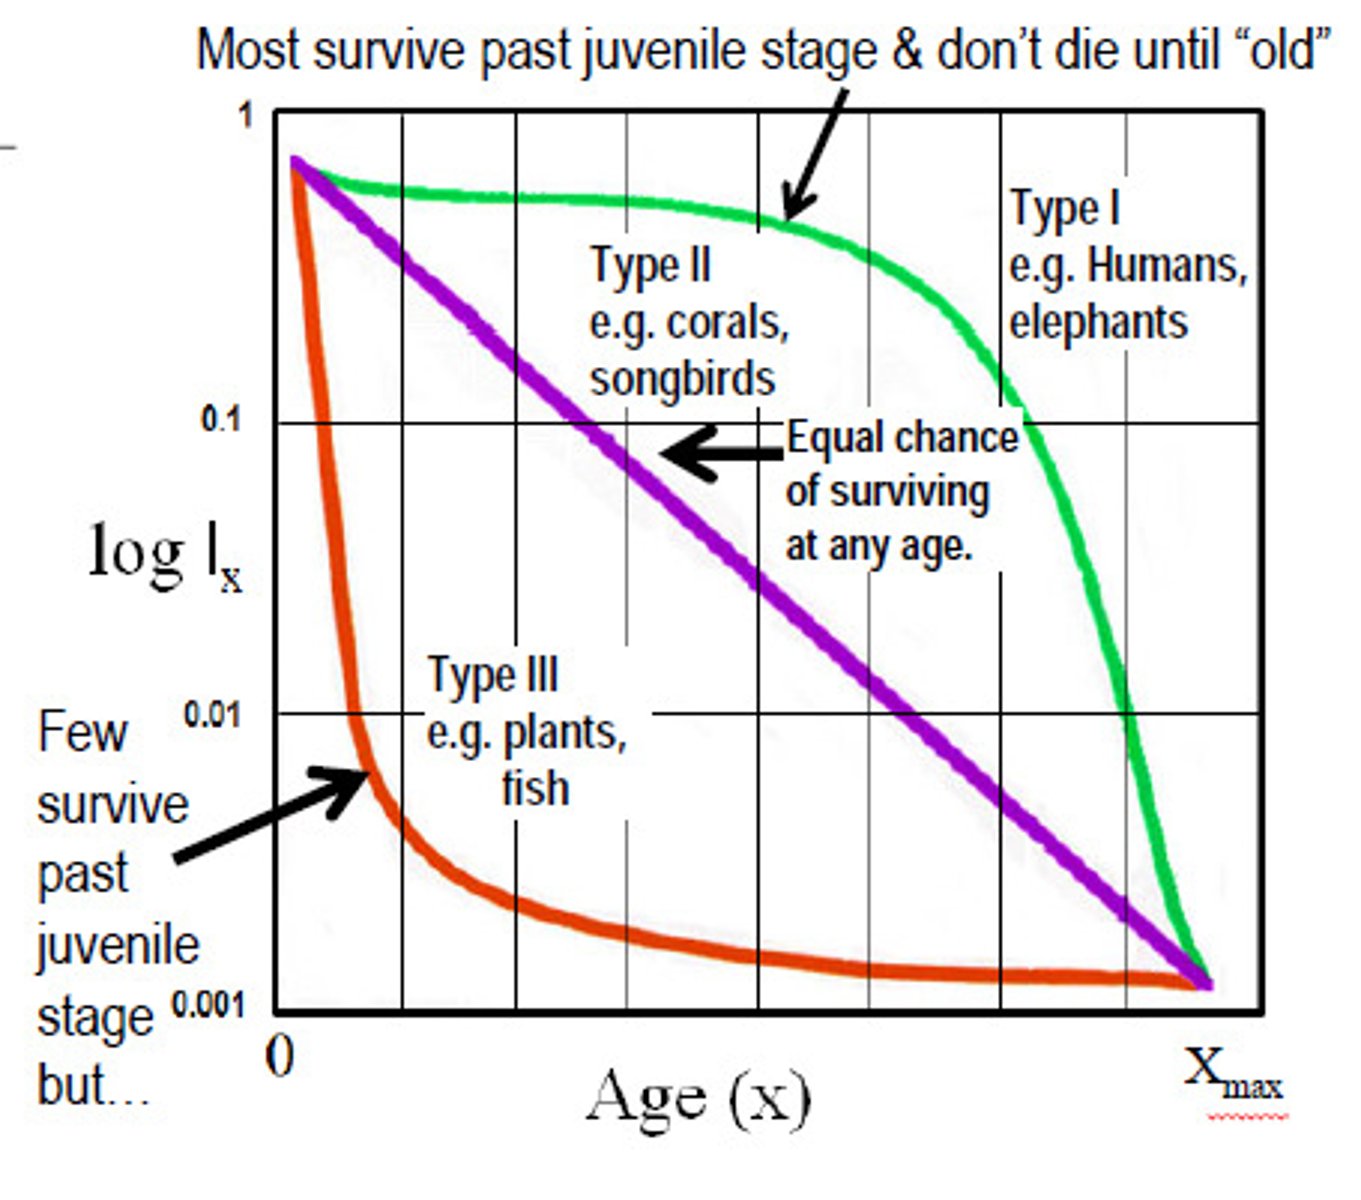
Type 2: Survivorship Curve
survival rates do not vary with age
-Adult birds, rodents, reptiles, perennial plants

Type 3: Survivorship Curve
mortality rates are extremely high in early life
-Fish, invertebrates and plants
-have many offsprings
-r strategists
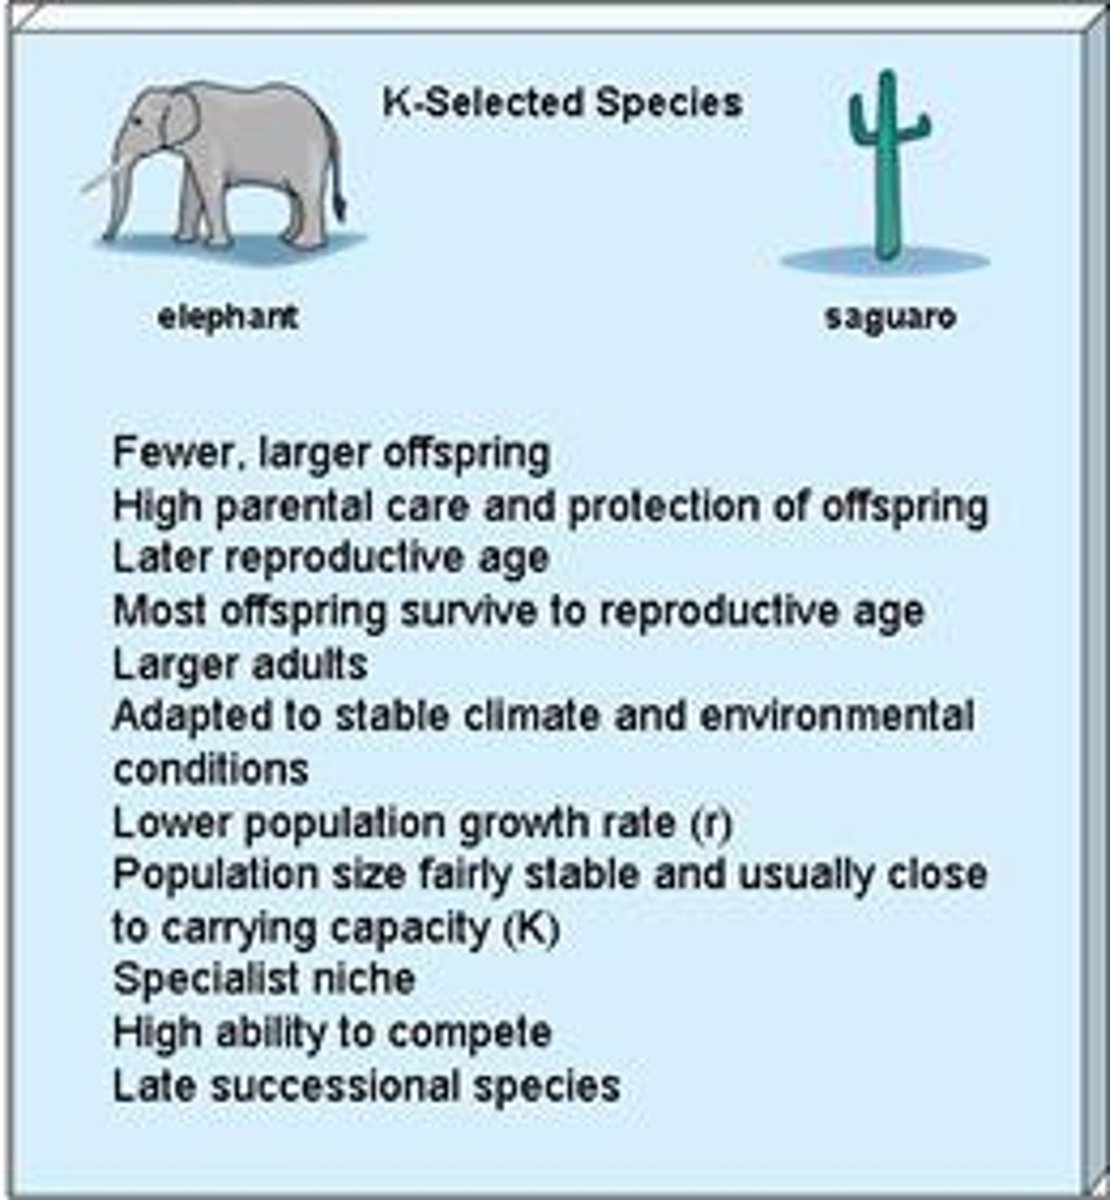
K-selected species
-population size fluctuates within narrow range
around carrying capacity (K)
-Reproductive rates (r) are lower, and often there is
parental investment in offspring
-stable environment
R (ruderal)
species rapidly colonize disturbed sites
C (competitive)
species are favored by predictable habitats
with abundant resources
S (stress-tolerant)
species survive in habitats where resources
are limited
reproductive effort
is the time and energy allocated to reproduction
Semelparity
the mode of reproduction in which an organism expends all of its energy in one suicidal act of reproduction
-The life span of semelparous species varies from several days (some insects)
to decades (cicada, bamboo)
Iteroparity
the mode of reproduction in which an
organism produces fewer young at one time and repeats
reproduction throughout its lifetime
- Vertebrates, perennial plants, shrubs, and trees
Altricial young
young are born or hatched in a helpless condition and
require considerable parental care (e.g., mice)
Precocial young
young emerge from the egg or womb ready to move
about and forage for themselves (e.g., ungulate mammals)
Density-dependent
effects influence a population in
proportion to its size
• As population density increases
a. The mortality rate increases (density-dependent mortality)
b. The fecundity rate decreases (density-dependent fecundity)
c. Or both the mortality rate increases and the fecundity rate decreases
logistic model of population growth
dN/dt = rN(1 - N/K)
Competition
occurs when individuals use a common
resource that is limited
Intraspecific competition
occurs among individuals of the same species
Scramble competition -
- when growth and reproduction are depressed equally across individuals
• can result in local extinction
Contest competition-
- when some individuals claim enough resources while denying others a share
• Only a fraction of the population may suffer
• Population is sustained by those that access resources
Exploitation
competition occurs when individuals indirectly interact with one another but affect the availability of shared resources (e.g., herbivores on the African savannas)
Interference
competition results when individuals directly interact and prevent others from occupying a habitat or accessing resources within it (e.g., bird species nesting sites)
Self-thinning
is the progressive decline in density and increase
in growth of remaining individuals caused by
- Density-dependent mortality
- Individual growth
home range
is the area that an animal normally
uses during a year
• Home range size varies with
- Food resource availability
- Mode of food gathering
- Metabolic needs
- Body size
- Sex
- Age
territory defense
By defending a territory, an individual secures sole access to an area and the resources that it
contains
• Methods of territory defense
- Song and call
- Spreading wings and tail (birds)
- Baring fangs (mammals)
- Attack and chase
- Marking with scents
Density-independent factors
factors influence population growth but are unrelated to population density
• They may influence birth and death rates of a
population but do not regulate population growth
Commensalism
A relationship between two organisms in which one organism benefits and the other is unaffected
Ecological niche:
The range of physical and chemical conditions under which a species can persist, and the
array of essential resources it utilizes.
Fundamental niche:
The ecological niche of a species in the absence of interactions with other species.
Interspecific competition
a relationship that affects the populations of two or more species adversely
Lotka-Volterra Competition Model
A modified form of the logistic equation used to model interspecific competition.
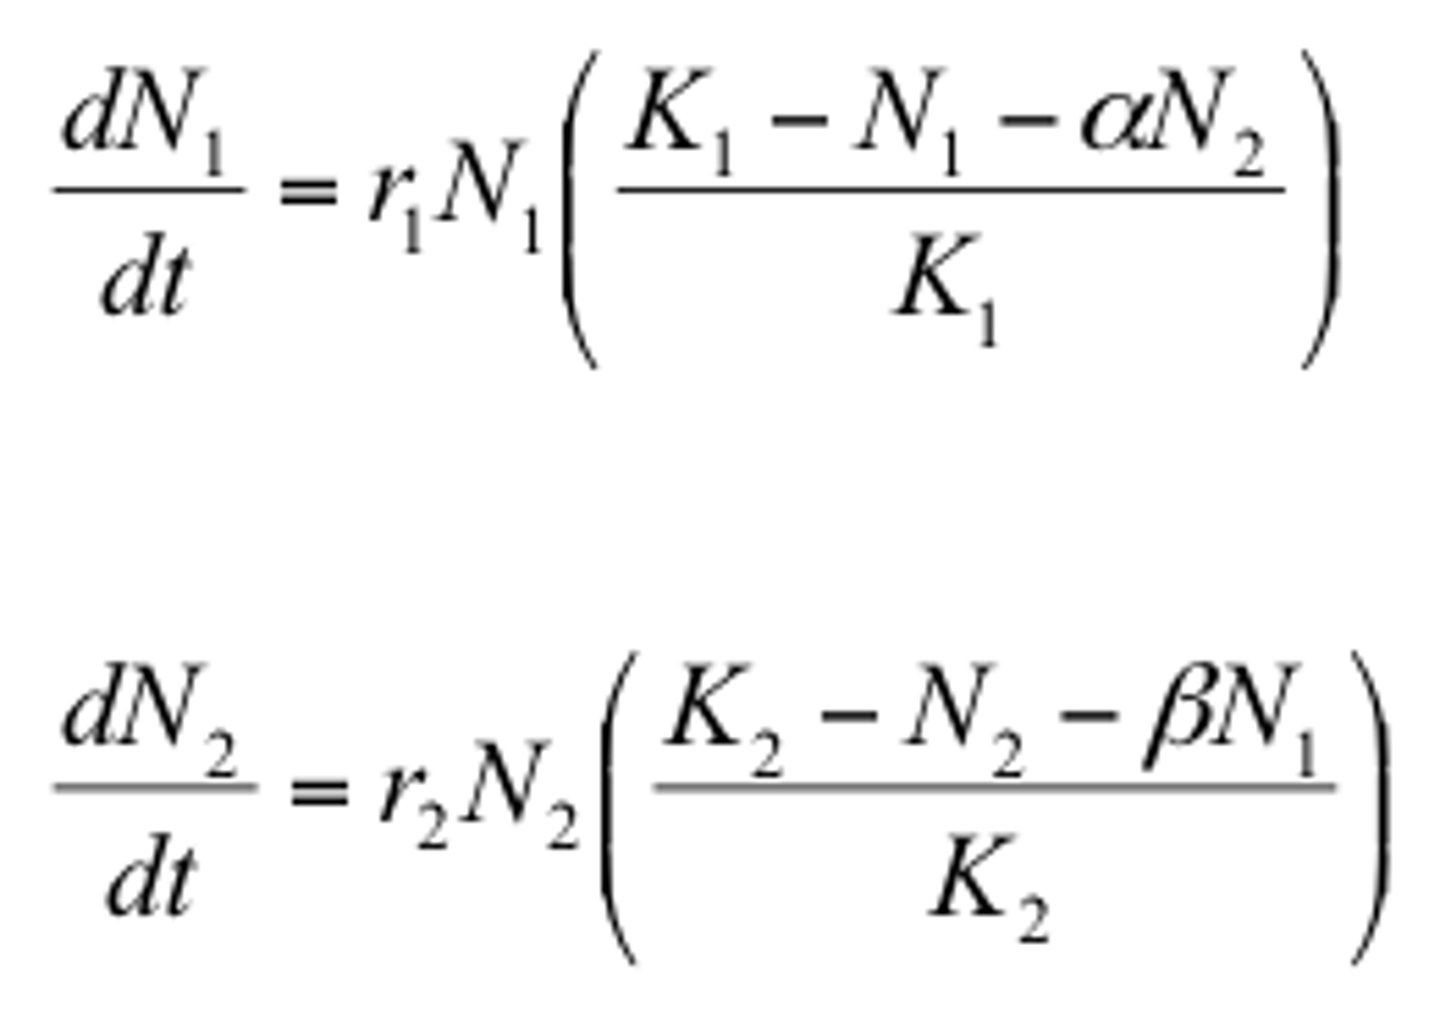
competitive exclusion principle
states that "complete competitors" cannot coexist
Complete competitors
two species that live in the same place and have exactly the same ecological requirements
resource partitioning
Similar species coexist by partitioning available resources
- Different kinds/sizes of food
- Feed at different times
- Forage in different areas
- Exploit the portion of resources unavailable to others
Character displacement
involves a shift in feeding niche that subsequently affects a species' morphology, behavior, or
physiology
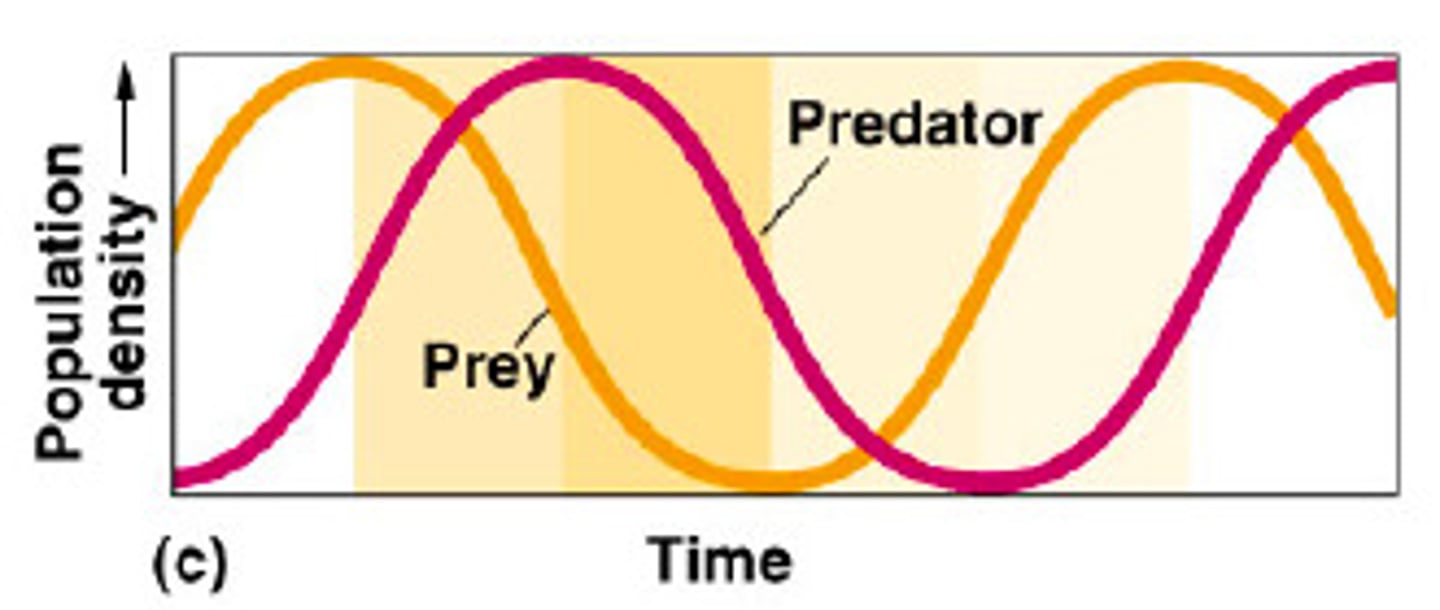
Predation
Is the consumption of one living
organism (the prey) by another (the predator)
• Simplest categories of predators: classes of
heterotrophic organisms
- Carnivore
- Herbivore
- Omnivore
predator (true predator)
kills its prey immediately upon capture, consumes multiple prey organisms, and functions as an agent of mortality on prey populations
herbivores (e.g., grazers and browsers)
consume only part of the plant and usually do not kill the plant
Parasites
feed on the prey organism (host) while it is still
alive, and their feeding activity is generally not lethal in the short term
Parasitoids
lay eggs on a host and when these eggs hatch,
the larvae feed on the host, slowly killing it
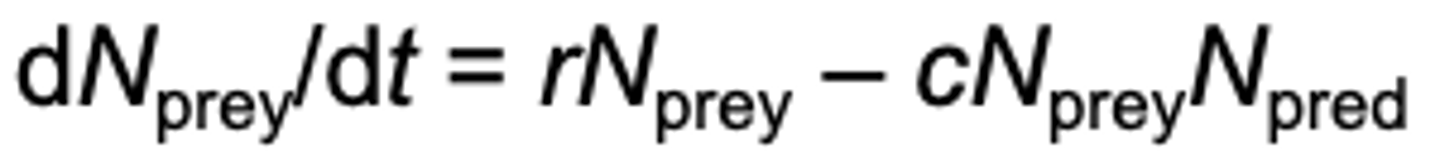
Prey
population growth equation includes two components
- The exponential model of population growth =
dN/dt = rN
Prey population growth equation
dNprey/dt = rNprey- cNpreyNpred
Predator population growth equation
dNpred/dt = b(cNpreyNpred) - dNpred
- Start with exponential model of population growth
• dN/dt = rN
- A birthrate term (b)
-A mortality rate

functional response
the relationship between the per capita rate of
consumption and the number of prey is the predator's
Type I Functional Response
There is a linear relationship between Nprey and the per capita rate of predation
- As # of prey increase, predators eat more of them
- Characteristic of passive predators (e.g., spiders, filter feeders)
- Predators are never satiated
Type II Functional Response
The per capita rate of predation increases in a decelerating fashion up to a maximum rate that is attained at some high prey density
- Predation approaches an asymptote
- Prey mortality rate declines with increasing prey density
Type III Functional Response
The rate at which prey are consumed is low at first, increasing in a sigmoid fashion as the rate of predation reaches a maximum
- The predator may prefer more abundant prey
- Initial rate of prey mortality increases with prey density but declines as rate of predation reached maximum
- This functional response that can potentially regulate a prey population
Availability of cover:
Availability of cover: the susceptibility of prey individuals will increase as the population grows and hiding places become filled
Search image
the ability of a predator to recognize a prey
species will increase as the prey population size increases
Prey switching
the act of a predator turning to a more abundant
(but maybe less preferred or palatable), alternate prey
numerical response
• reproduction by predators (b)
• movement of predators into an area of high prey density (aggregative response)
Coevolution:
as prey species evolve ways to avoid being
caught, predators evolve more effective means to capture them
Red Queen hypothesis
- For two interacting species, continuous change is needed just to maintain the fitness of one species relative to the other species it is coevolving with
Chemical defense (predator defense)
- Odorous secretions repel predators (e.g., arthropods, amphibians)
- Storage or synthesis of
toxins and poisons (e.g., arthopods, snakes)
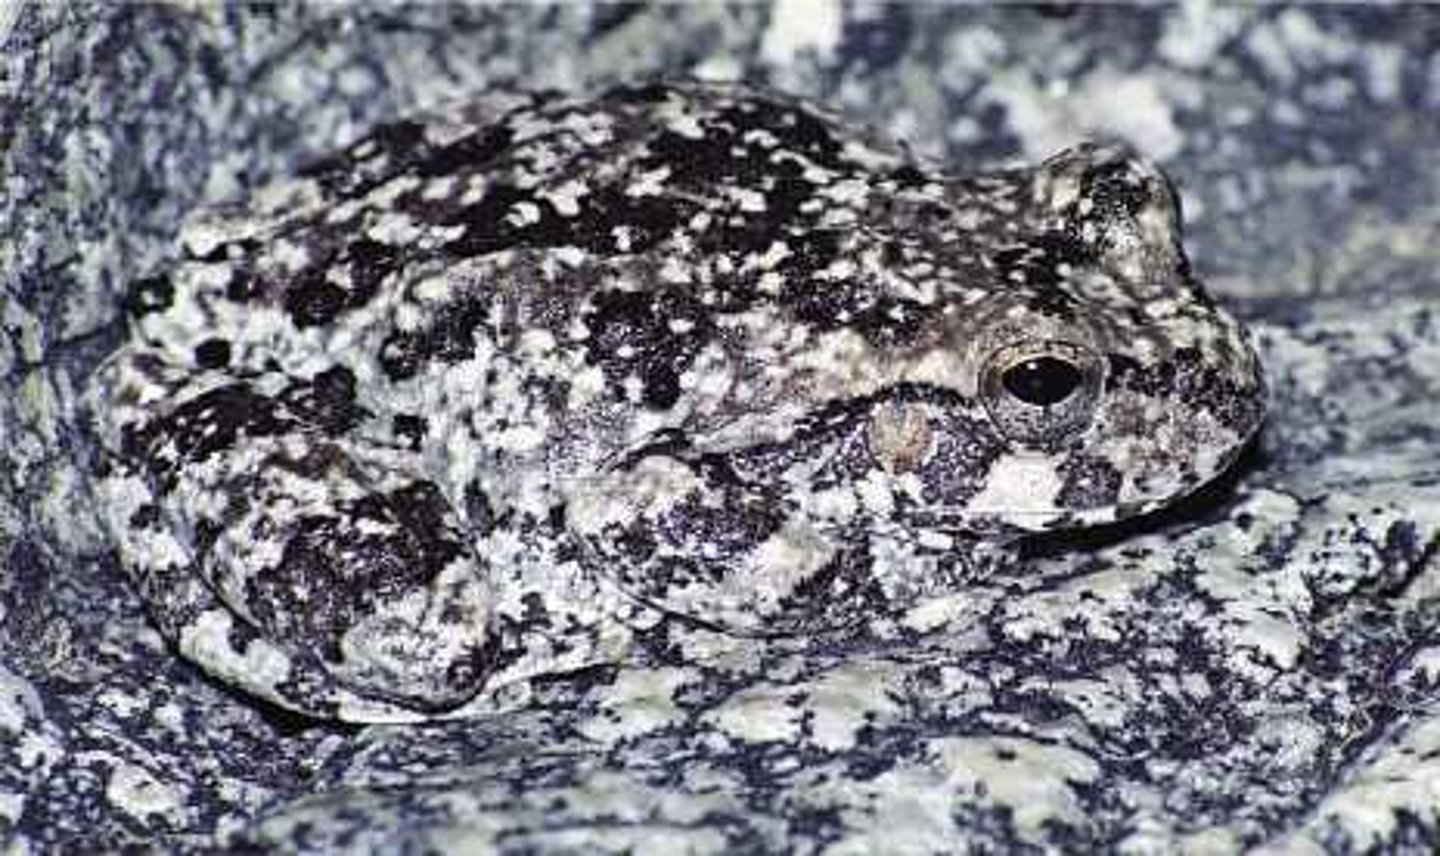
Cryptic coloration (predator defense)
includes colors and patterns that allow prey to
blend into the background
Object resemblance
an organism resembles an object in the environment to avoid detection from predators

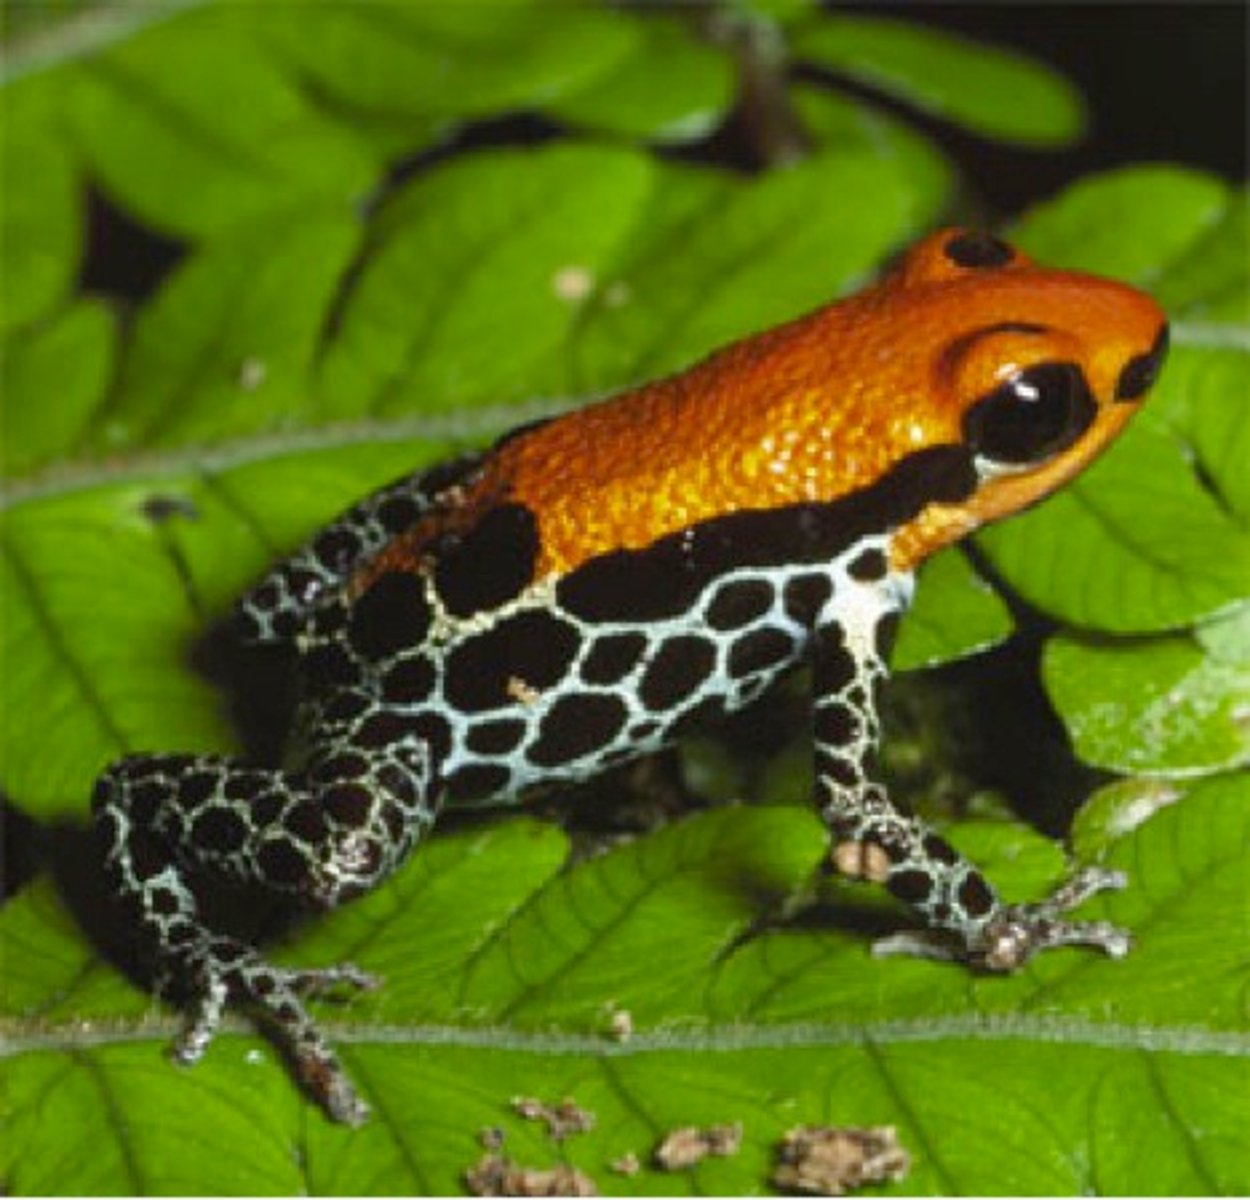
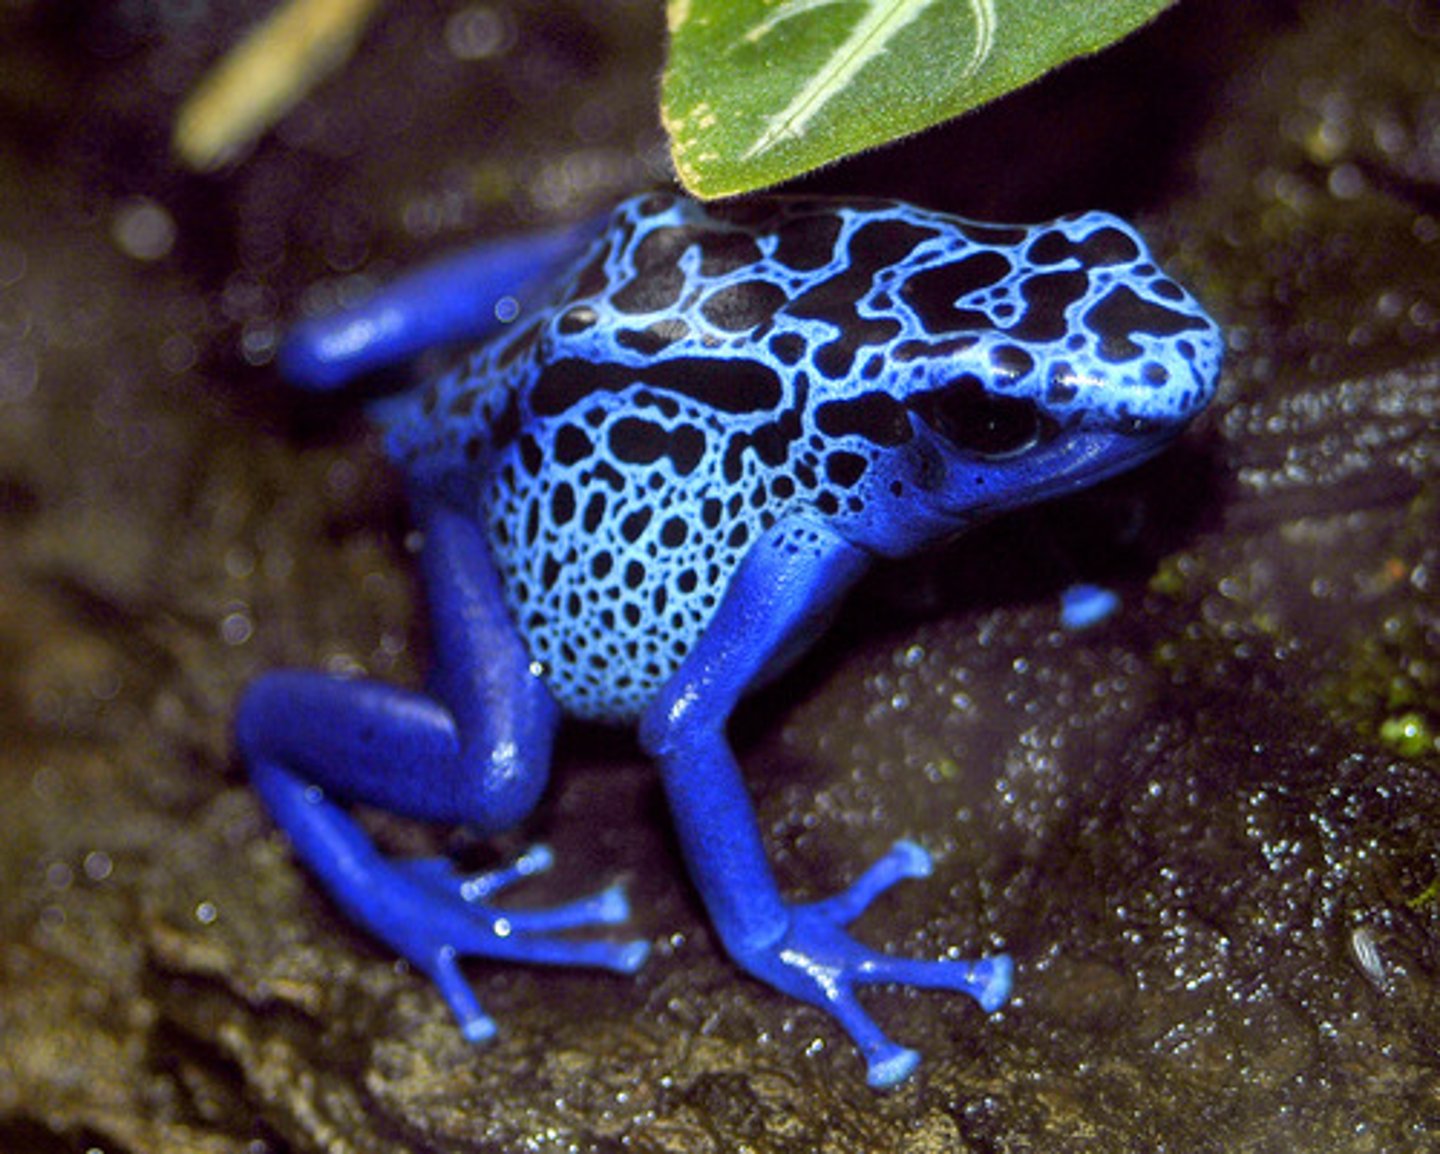
warning coloration (predator defense)
Animals that are toxic to predators or use other
chemical defenses often possess warning
coloration— these are bold color patterns that
serve to warn would-be predators
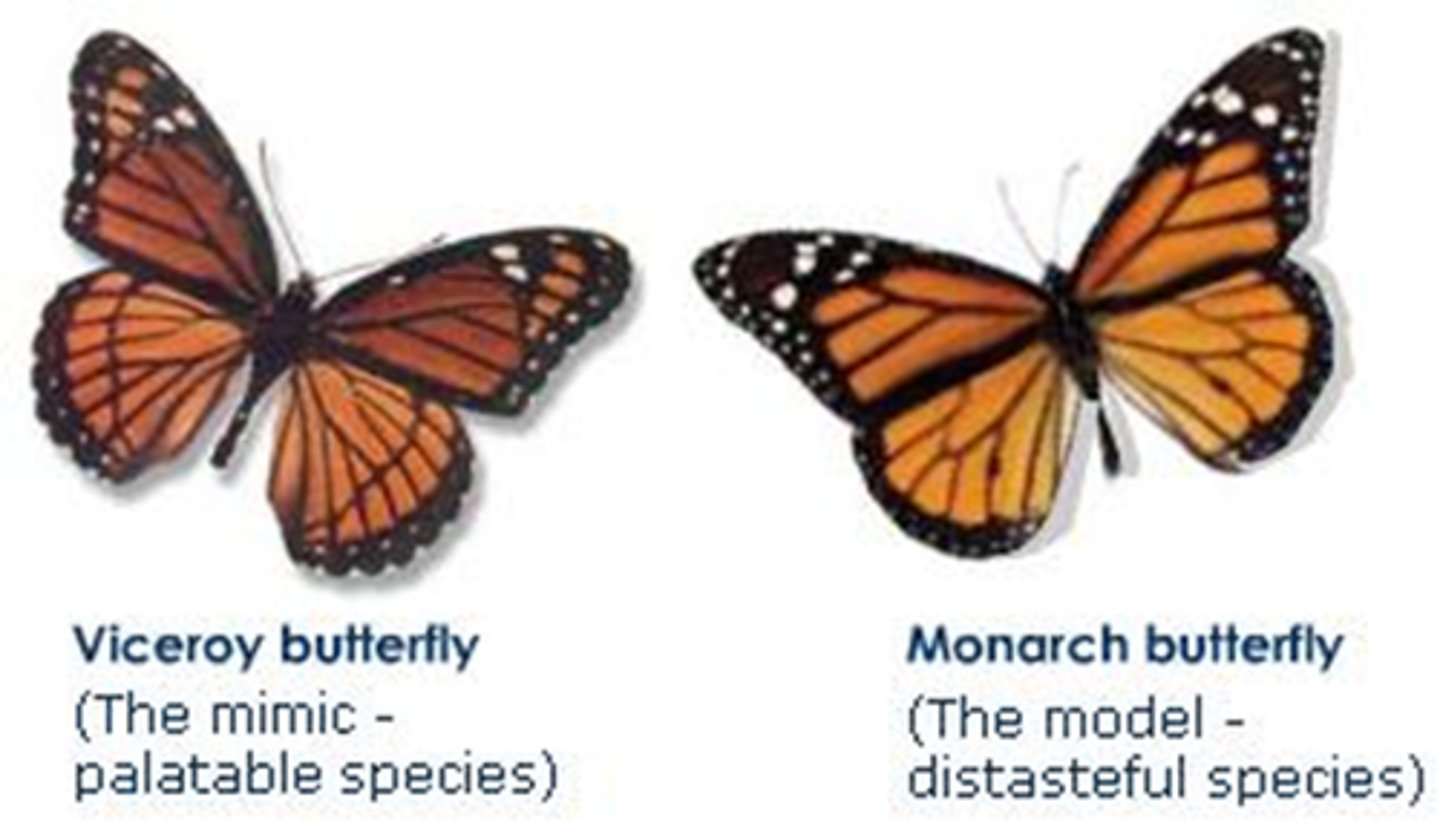
Batesian mimicry (predator defense)
--only one is dangerous
occurs when an edible species mimics the inedible species (the model)
- Butterflies and snakes
- Mimicry is not limited to color pattern (e.g., rattle-like sound)
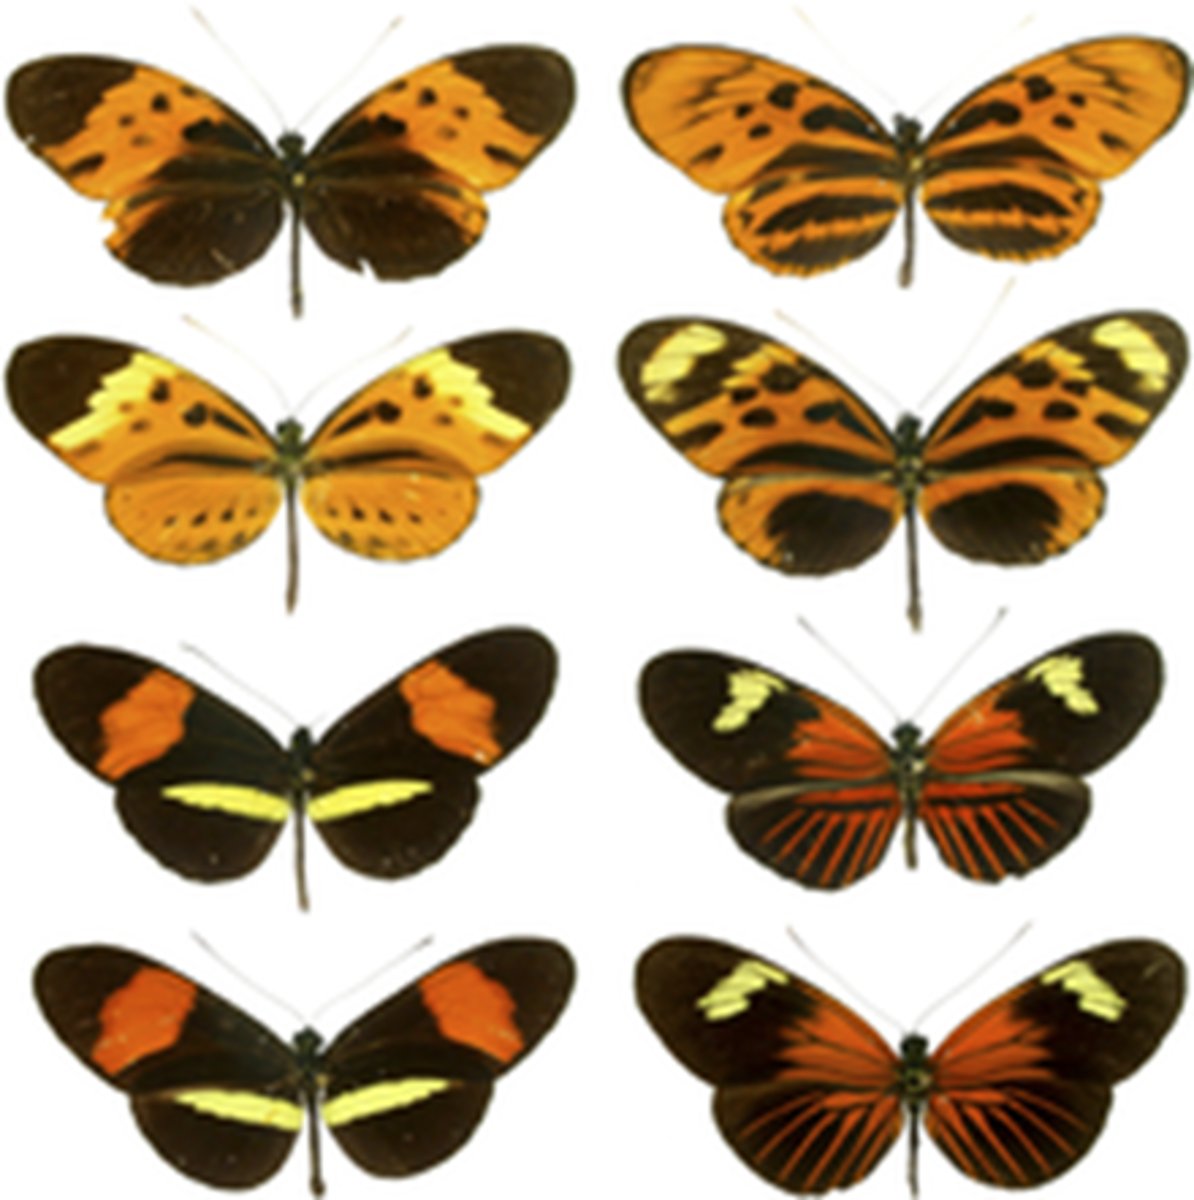
Mullerian mimicry
---all are dangerous
is the similar color pattern shared by many unpalatable or venomous species
- Predator has to be exposed to only one of the species before learning to stay away from all other species with the same warning color patterns
Protective armor (predator defense)
(shells, quills) is used by some animals for defense
• A wide range of behavioral defenses is known to help prey
avoid or escape predators
- Living in groups
parasitism
a close association between two species is
beneficial to one (the parasite) and harmful to the other (the host)
-normally don't kill the host, but can reduce their fitness
-they are normally smaller and reproduce faster than hosts
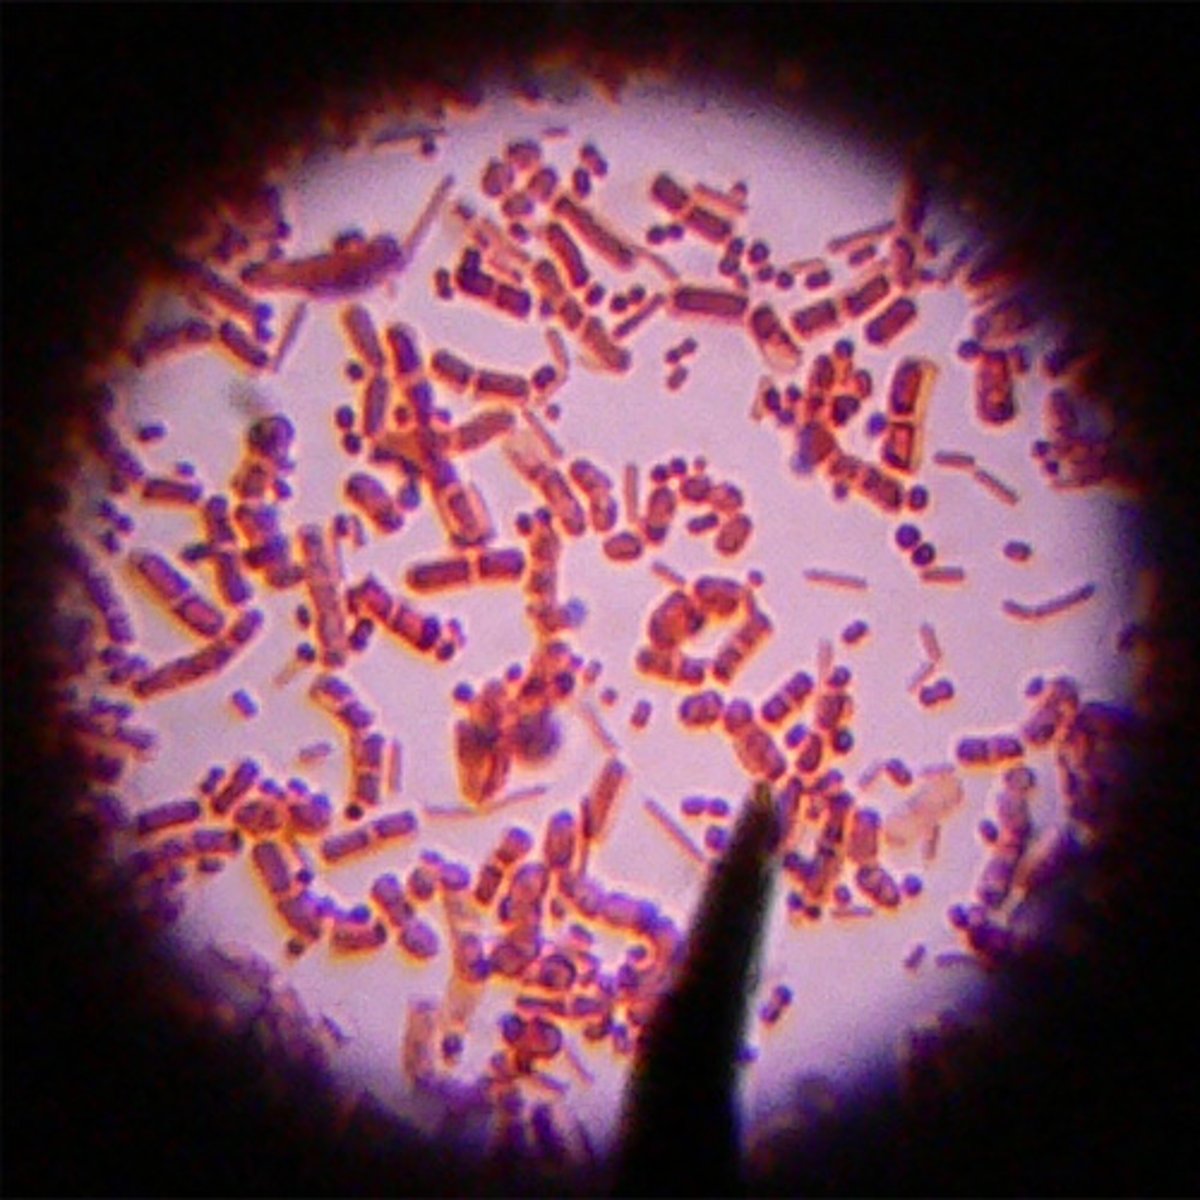
Microparasites
are characterized by small size and a short generation time
- Viruses, bacteria, and protozoans
Macroparasites
are relatively large with a comparativel long generation time and usually involve intermediate
hosts and carriers
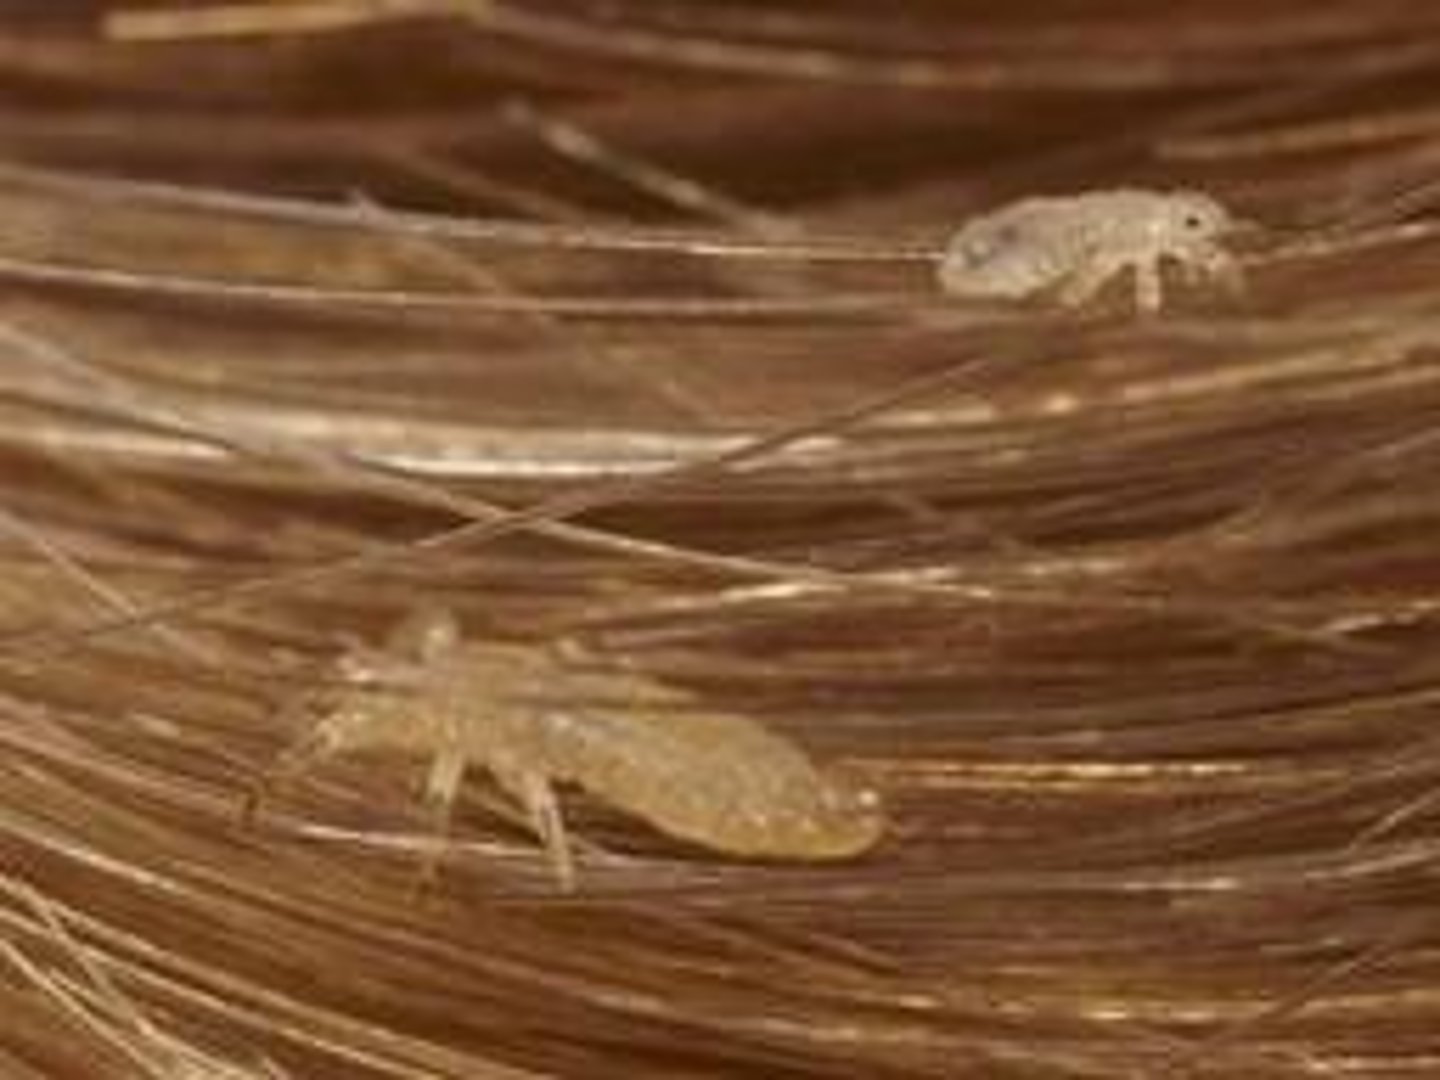
- Invertebrates (e.g., flatworms, ticks, lice) and fungi (e.g., rusts, smuts)
Hemiparasitic
plants take nourishment from host plant but also
photsynthesizes itself
Holoparasitic
plants are nonphotosynthetic completely
dependent on host for survival
Ectoparasites
are those that live on the host's skin within
the protective cover of feathers and hair
Endoparasites
live within the host (e.g., beneath the
skin, bloodstream, gills of fish, mouthparts)
definitive host.
The organism that is host to an adult parasite is known
as the definitive host
intermediate host.
The organism that is host to a juvenile parasite is known as an intermediate host
Mutualism
a relationship that is beneficial to both species
community
a group of species that occupy a given area, interacting either directly or indirectly
- A spatial concept
• A more restrictive definition of community is a subset of species
- E.g., bird community, plant community, etc
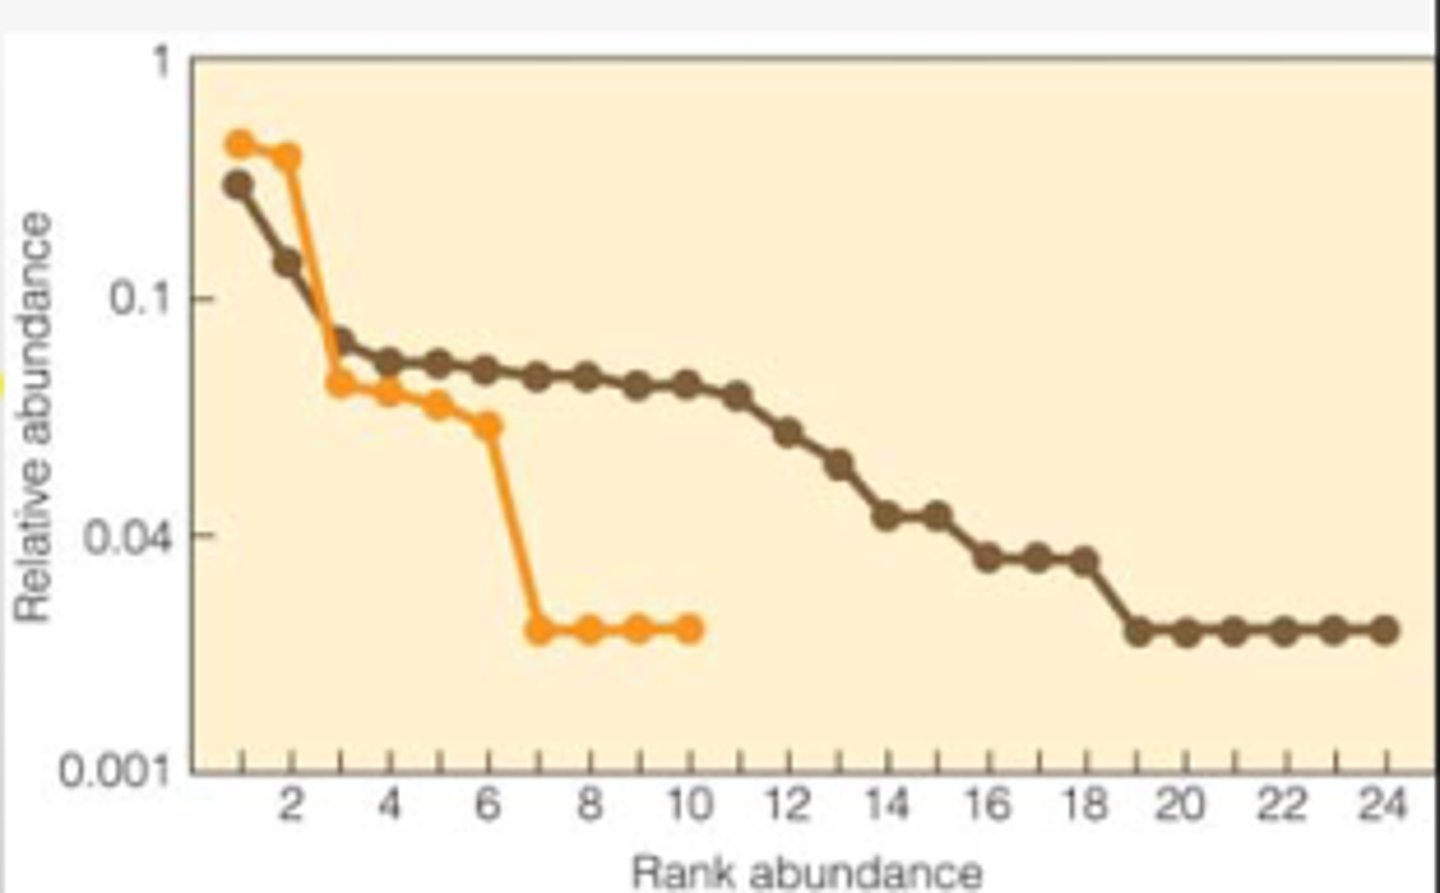
Species richness (S)
is the count of the number of species occurring within the community
Relative abundance
represents the percentage each species contributes to the total number of individuals of all species
rank-abundance diagram
common method to plot the relative abundance of each species against rank