PSYC 367: Midterm 1
1/212
Earn XP
Description and Tags
Name | Mastery | Learn | Test | Matching | Spaced | Call with Kai |
|---|
No analytics yet
Send a link to your students to track their progress
213 Terms
what are the steps of the sensory process?
physical stimulus → physiological response → sensory experience
easiest to study physical stimulus to sensory experience, skipping physiological response (just ask participant what they are sensing)
sensation
ability to detect stimulus and turn detection into a private experience
perception
giving meaning to a detected sensation
studying physical stimulus to physiological response
Animal single-unit recording
Human brain imaging (magnetoencephalography, positron emission tomography, functional magnetic resonance imaging, event-related potentials
difficult to study, expensive, specialized
studying physiological response to sensory experience
animal lesion studies
Human clinical studies, human brain imaging
methods for studying sensation (textbook)
thresholds
scaling (measuring private experience
signal detection theory (measuring difficult decisions)
sensory neuroscience
neuroimaging
computational models
Gustav Fechner (1801-1887)
pioneer of psychophysics, true founder of experimental psychology - preliminary work relating changes in physical world to changes in psychological experiences
invested in relationship between mind and matter - believed consciousness to be present in all nature (panpsychism)
His methods are still used today:
absolute threshold
psychometric function
method of limits
method of adjustment
method of constant stimuli
psychophysics
formally describing relationship between sensation and energy that gives rise to sensation - proposed by Fechner (inspired by Weber)
absolute threshold for detection
minimal amount of stimulation necessary to just detect presence of a stimulus 50% of the time
lower = higher sensitivity
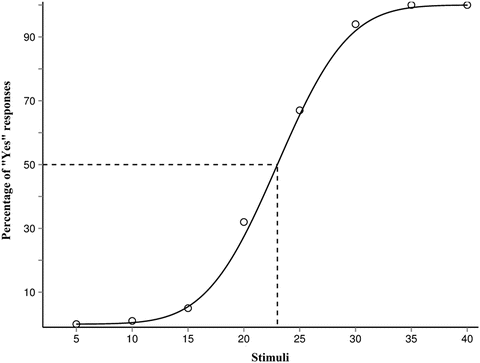
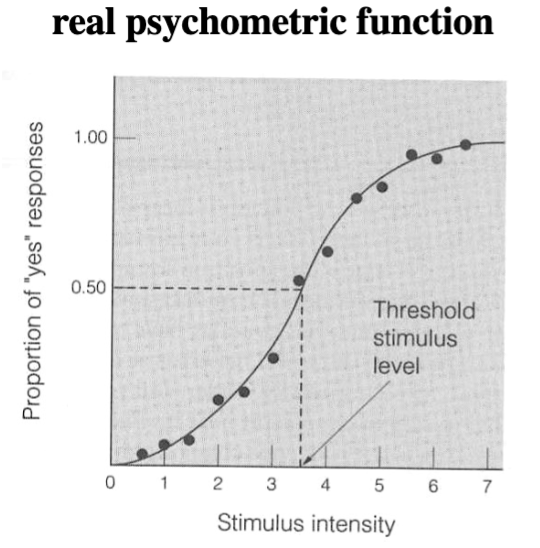
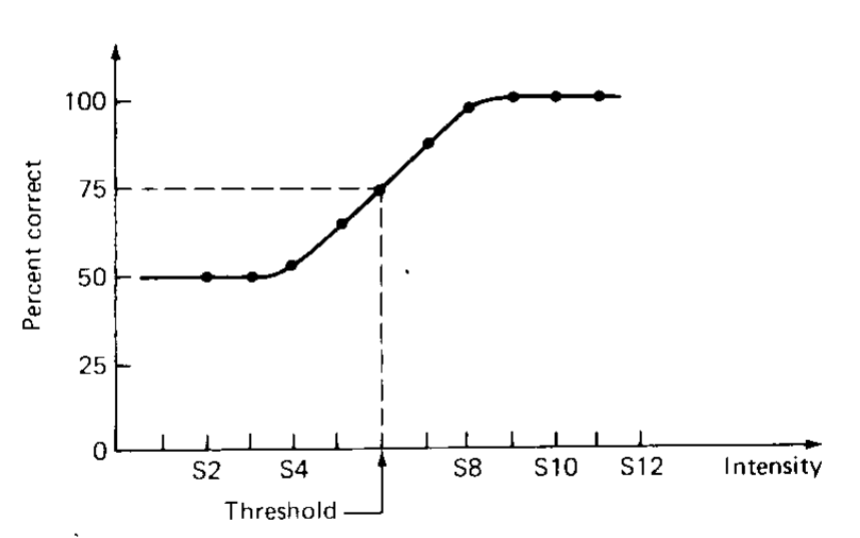
psychometric function
graph of stimulus value (intensity) on horizontal axis versus subject’s responses (proportion of yes or no) on vertical axis
vary depending on the person and the moment
Ogive = typical S shape of the functions
method of constant stimuli
select stimulus intensities above and below expected threshold - present many trials of each intensity in random order to identify average smallest intensity that can be detected
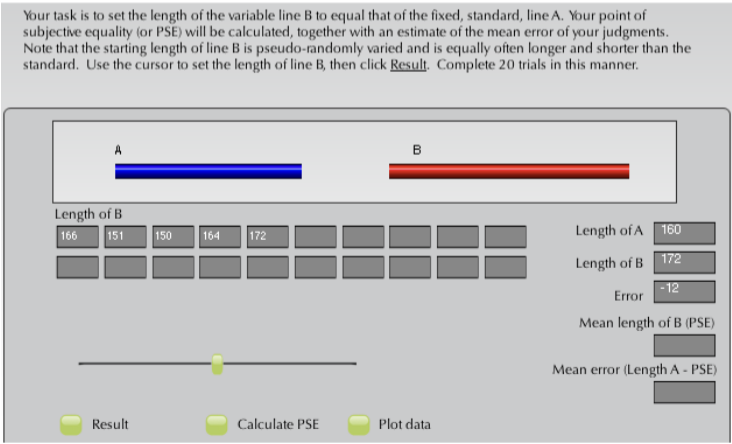
standard (fixed value) and comparison (value changes) stimuli presented together
identify point of psychometric function where stimulus is identified 50% of the time (absolute threshold)
interested in upper and lower limits - 0.75 point is upper limit, 0.25 point is lower limit read from graph
JND = (upper limit - lower limit)/2
0.50 point is point of subjective equality
difference threshold
size/level of stimulus difference for participant to notice a change between two instalments
advantages of method of constant limits
accurate and repeatable threshold values
disadvantages of method of constant stimuli
time consuming
not good for tracking thresholds that change over time
Not good for children or clinical patients
Lots of data collected far from threshold (inefficient)
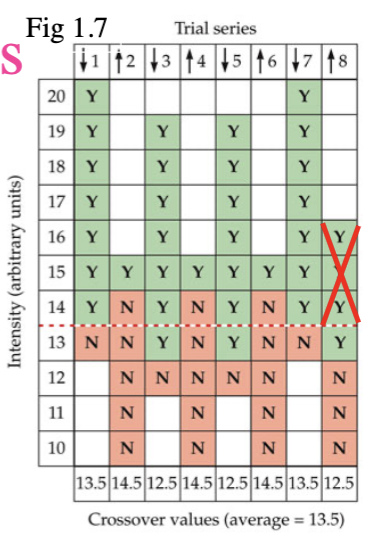
method of limits
alternate between descending intensity (until participant says they can’t hear) and ascending intensity during trials (until participant can hear) and determine cross-over point between each series (average)
not necessary to obtain a psychometric function, saves time
standard and comparison stimuli presented together
upper limit: crossover point stronger and equal on each series
lower limit: crossover point between equal and weaker on each series
JND = (average upper limit - average lower limit)/2
PSE = (average upper limit + average lower limit)/2
advantages of method of limits
saves time - don’t have to trace out whole psychometric function
disadvantages of method of limits
error of habituation (make same response too many times)
Reduce by alternating the series takes more time
Error of anticipation (change response after fixed number of trials)
Reduce by varying start point on each series — requires extra stimulus levels so becomes less efficient
method of adjustment
observer adjust stimulus intensity using a potentiometer until just detectable - calculate average of threshold adjustments
adjustment also varies between descending and ascending
JND = standard deviation of the matches x 0.6745
PSE = average of matches
method of adjustment advantages
quick
participants like it
method of adjustment disadvantages
not very accurate or repeatable
scaling methods
measuring how strong experiences are
magnitude estimation
Steven’s power law
cross-modality matching
detection experiments
measure absolute thresholds
suprathreshold stimulus
above absolute threshold, always detectable
just noticeable difference (JND)
smallest difference between stimuli or change in a stimulus that observer notices 50% of the time
modern improvements to Fechner’s methods
staircase method
2-alternative forced-choice paradigm
psychophysical scaling
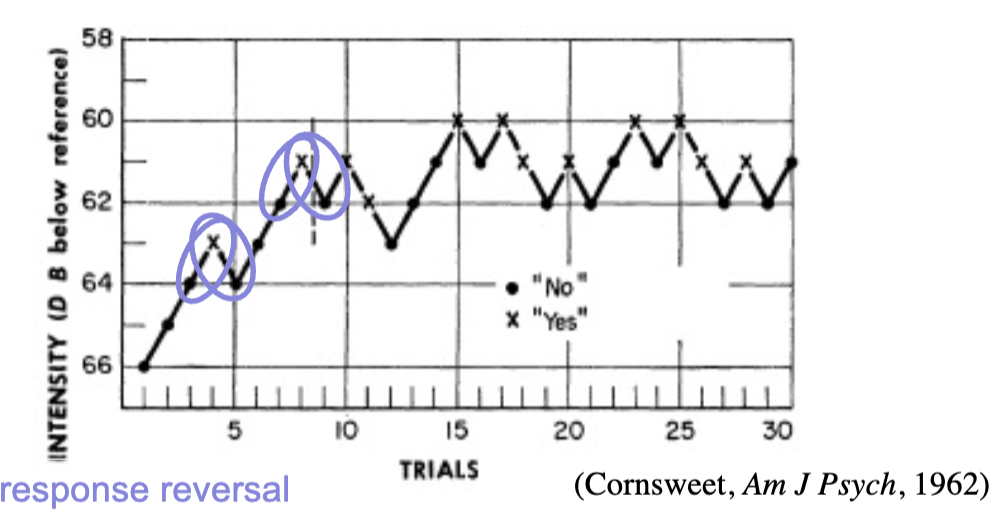
staircase method
stimulus intensity decreased (or increased) in equal steps until stimulus can’t (or can) be detected, then increased (or decreased) until stimulus can be detected
keeps going instead of stopping after ability to detect or not detect
stimuli kept hovering around threhold by adapting test sequence to participant’s response
response reversal = whenever response changed from yes to no
ends after fixed # of trials
absolute threshold = average of cross-over points at response reversal
staircase method advantages
efficient, most data collected around threshold
can be used to track threshold changes over time - wouldn’t level off
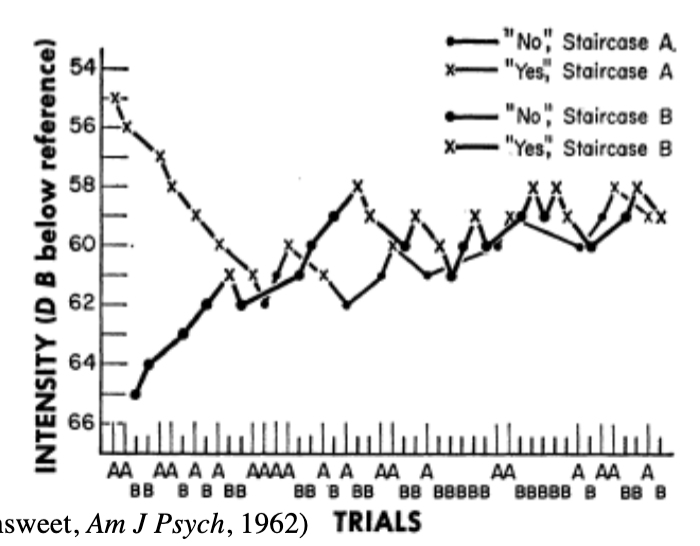
staircase method disadvantages
error of anticipation and habituation
randomly interleaved descending and ascending staircases can be used to prevent this (2 staircases)
2-alternative forced-choice paradigm
additive to experimental methods discussed above
participant has to choose one or the other - prove they can detect (where/when was this)/discriminate (what is different) stimulus
2-alternative forced-choice paradigm advantages
more accurate threshold
reduces non-sensory differences between participants (bias or criterion towards saying we detect saying something)
can be used with method of constant stimuli, method of limits, staircase method, but not method of adjustment
psychophysical scaling
difference thresholds are larger for larger stimuli - identified by Weber
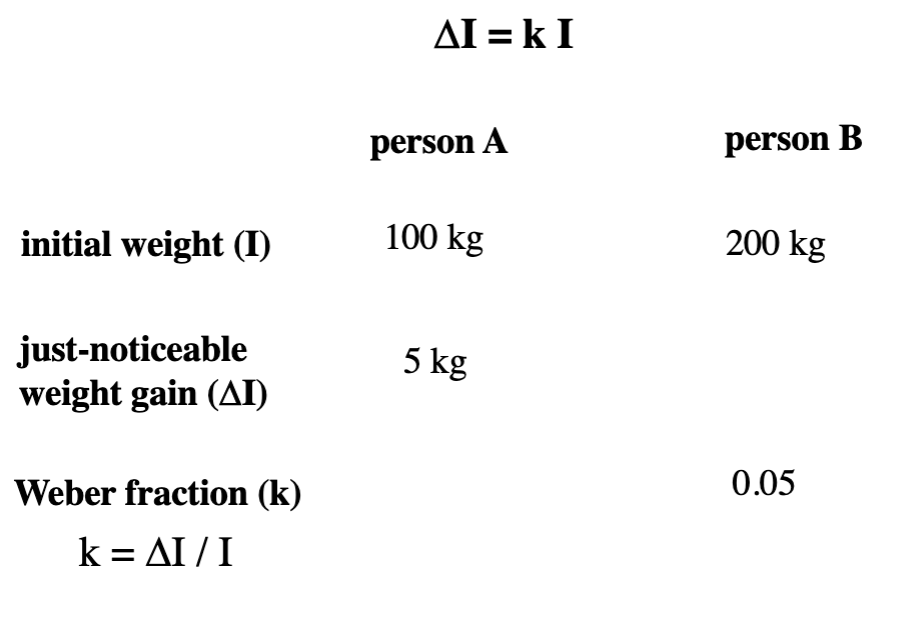
Weber’s law: ∆I = k I
∆I = difference threshold (JND)
I = physical magnitude of stimulus
k = constant that depends on sensory system
The difference threshold is a constant proportion of physical magnitude of stimulus
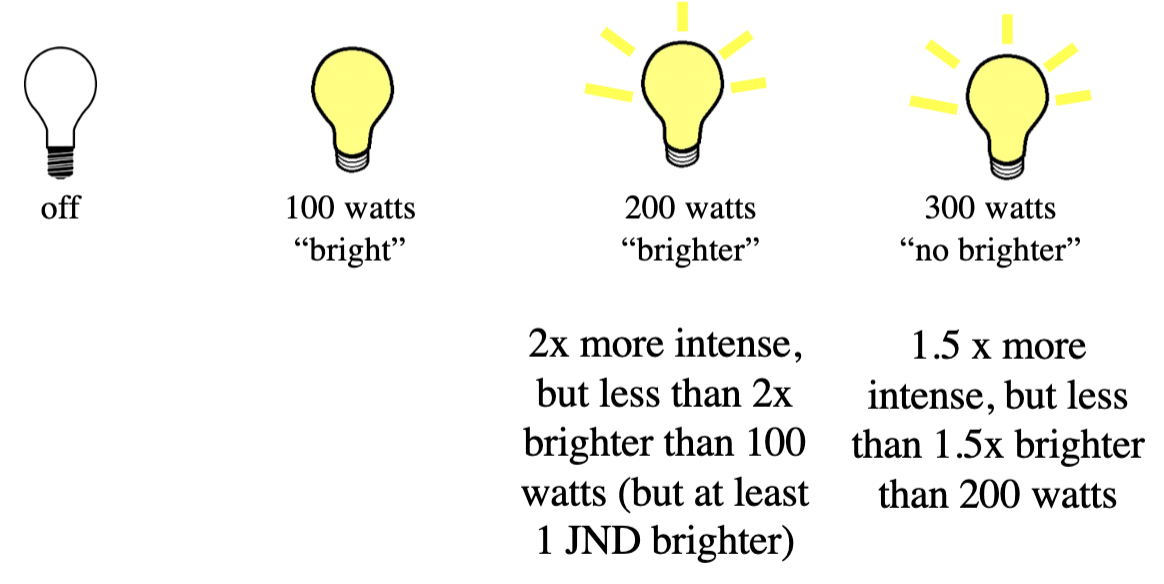
Fechner suggested using JNDs to describe perceived intensity (produce equal steps in sensation)
In reality, sensory steps at upper end of scale require larger increases in stimulus intensity to get equal sensation increasing steps
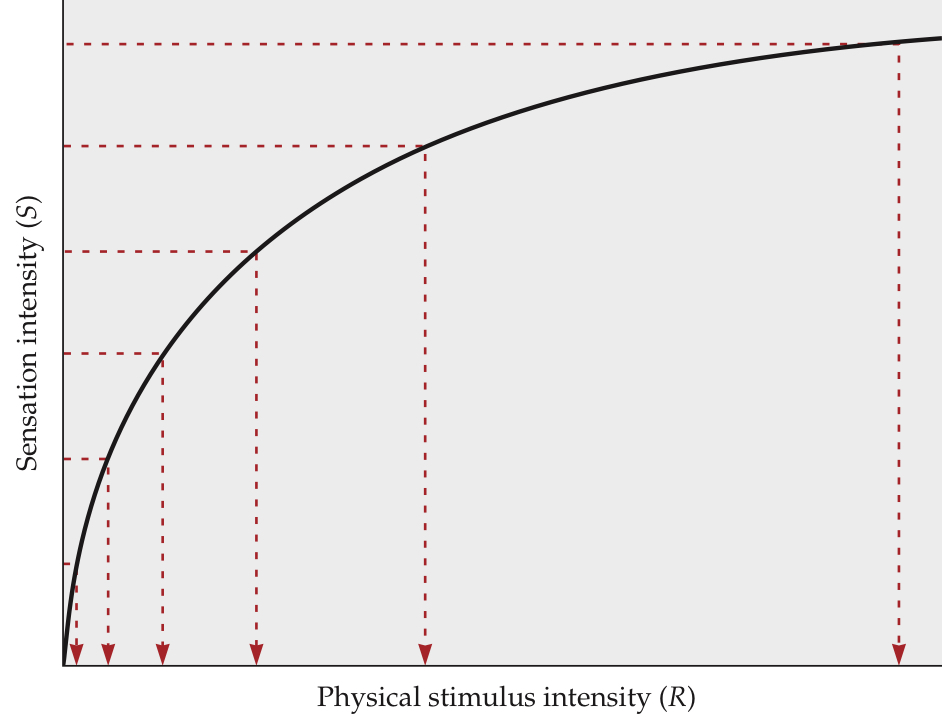
Fechner’s Law
principle describing relationship between stimulus magnitude and resulting sensation magnitude (scaling) - as stimulus intensity increases, sensation intensity increases rapidly at first, but then more slowly
S = k log R
S = sensation intensity
k = Weber fraction
R stimulus level (also = I)
Weber’s Law
∆I = k I
∆I = just detectable difference
k = constant
I = stimulus intensity
JND is a constant fraction of the comparison stimulus
numerical example of Weber’s law (ΔI = k I)
150 watts is just noticeable different from 100 watts (JND = 50, have to increase by at least 50 to notice a change)
450 watts is just noticeable different from 300 watts (JND = 150, have to increase by at least 150 to notice a change)
k = 0.5 (JND/initial watts value [I])
numerical example of Fechner’s Law
150 watts (S = 1.1) looks 0.1 brighter than 100 watts (S = 1.0); ΔS = 0.1
k = 0.5
450 watts (S = 1.3) looks 0.1 brighter than 300 (S = 1.2); ΔS = 0.1
k = 0.5
magnitude estimation
participant assigns number to describe stimulus intensity
ex. whiteness of standard dot pattern is 100
sensory magnitude of a stimulus increases with its physical magnitude, within limits, but rate of increase varies with different sensations - curves are different but can be describe with a power law
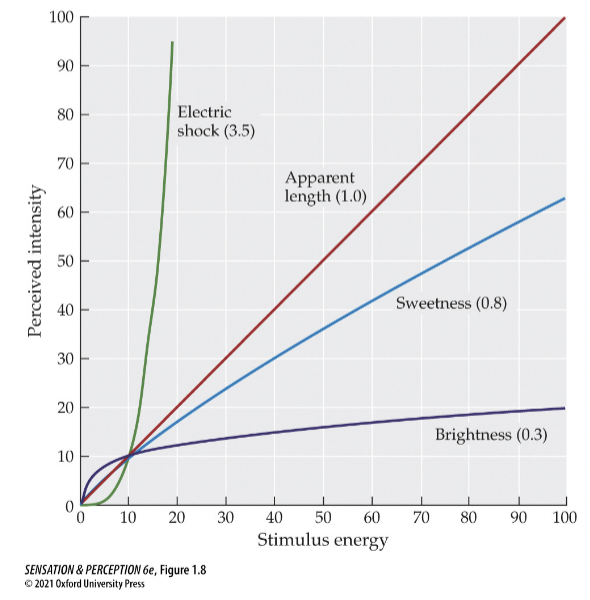
Steven’s power law
magnitude of subjective sensation is proportional to stimulus magnitude raised to an exponent (power)
S = aI^b
S = sensation
a = constant
I = stimulus intensity
b = exponent (determines shape of curve)
Exponent value curves line
identifies sensory modalities that do not follow Fechner’s laws
Predicts same scaling result as Fechner’s law
If exponent is less than one, it means sensation grows less rapidly than stimulus
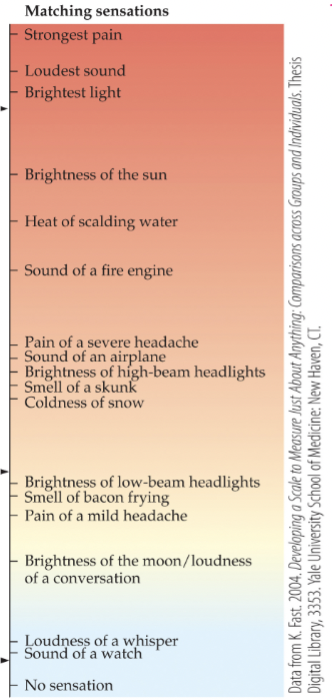
cross-modality matching
scaling method in which intensities of sensations that come from different sensory modalities are matched
signal detection method
quantifies response of an observer to presentation of signal in presence of noise - 2-alternative forced-choice paradigm reduces perceiver bias, bias free estimate of sensitivity
recognized perceptual measurements are influenced by motivational state/sensory capacities by perceiver (other methods don’t do this) - how we make decisions under uncertainty
catch trials
outcome matrix: when stimulus is present 50% of the time
sensitivity (d’: d prime)
catch trials
trials in a signal detection experiment on which stimulus/signal is absent
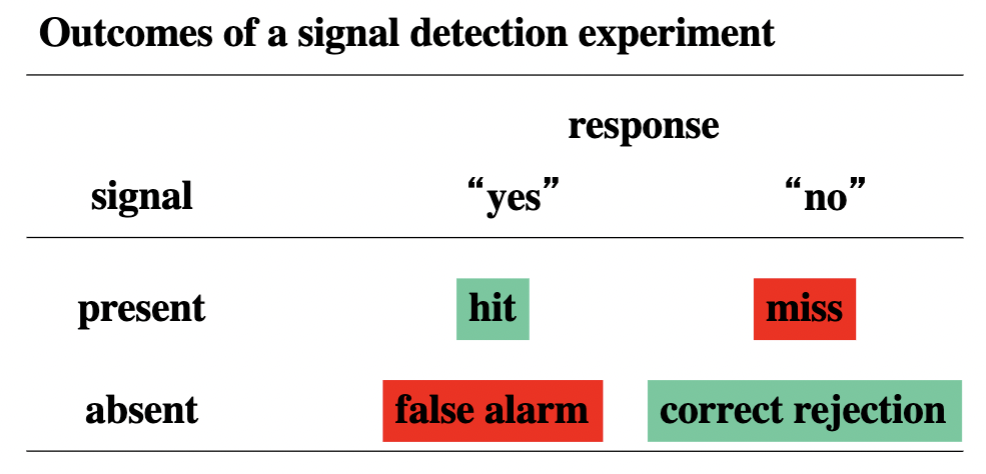
outcome matrix (signal detection)
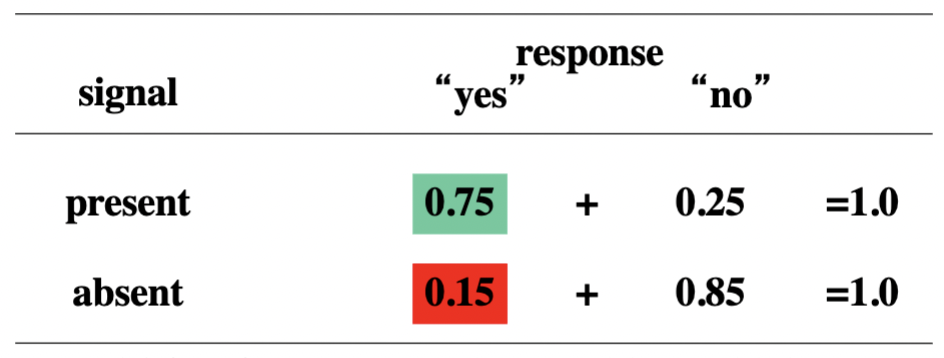
response rate has to add up to 1 (know percentage of Yes, you also know percentage of No)
no dependent relationship between present and absent scores
Hit rate and false alarm rate together provide sensitivity measure
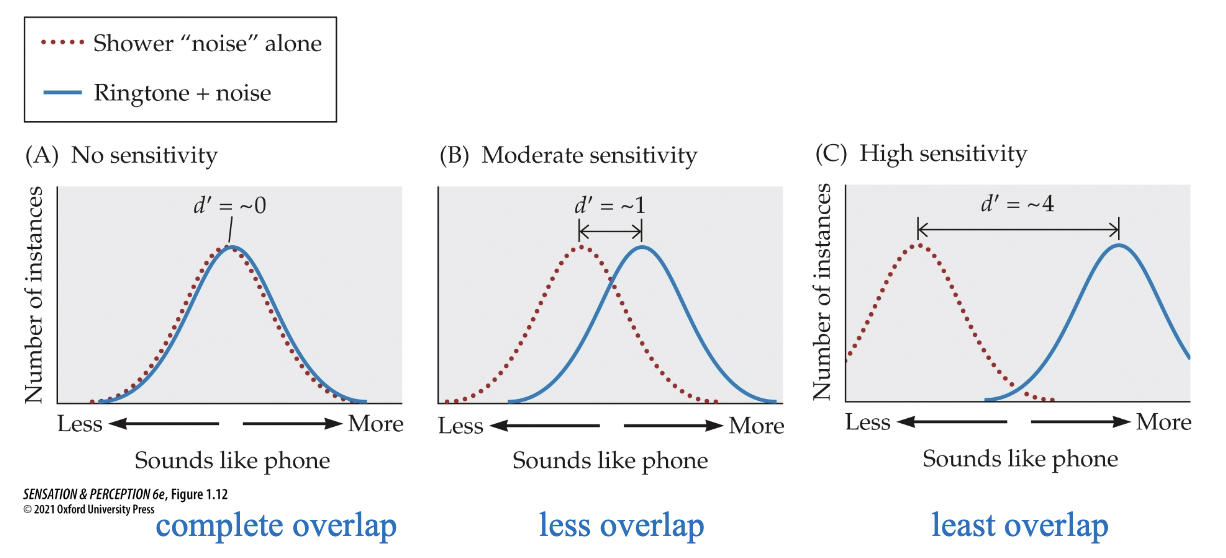
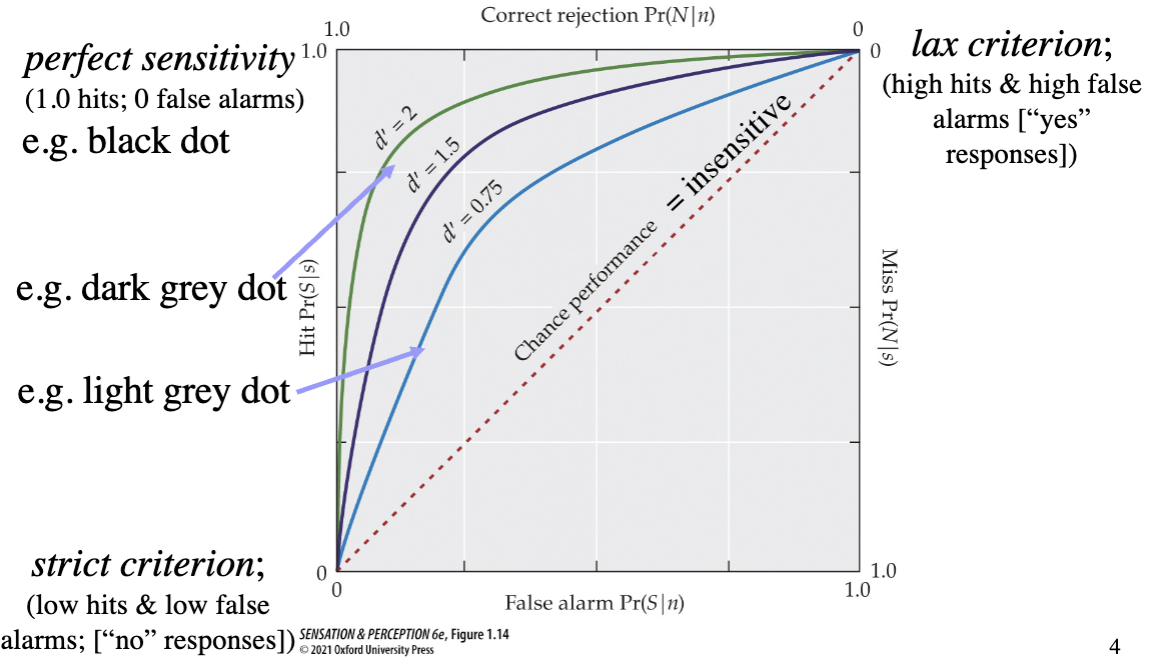
sensitivity (d’) (signal detection)
ease with which perceiver can tell difference between presence and absence of a stimulus
insensitive = hit rate and false alarm rate are equal
manipulated by changing intensity of the stimuli - ex. lightening/darkening the colour
depend on overlap of signal absent and signal present distributions
distance between means of N and S+N distributions (doesn’t change with changes in criterion
why do people make false alarms? (signal detection)
endogenous noise: spontaneous neural activity - affects measurement of threshold and sensitivity (sensory reason)
criterion (𝞫): response bias within a perceiver - depends on expectations and motivation (non-sensory)
Manipulating motivation/expectations can change it
Bigger the criterion, the stricter it is
manipulated by changing the probability of a stimulus appearing (reducing it increases criterion strictness)
signal detection and endogenous noise
when signal is present, it adds to noise (S + N (sensory activity during catch trials))
sensory activity for signal + noise is on average, more intense than noise alone
noise can produce sensation as strong as that produced by signal
criterion is the level above attribution to signal and not to noise
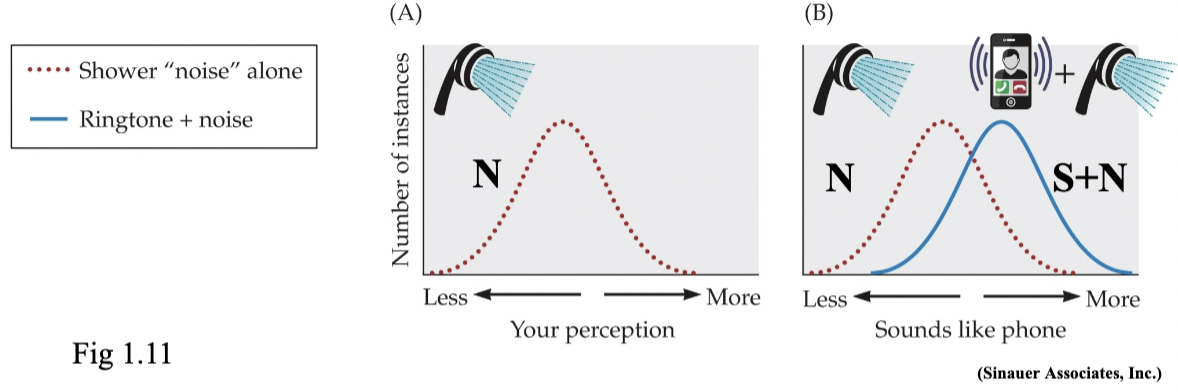
correct rejection
correctly identify signal as absent (activity to left of criterion)
hit
correctly identify signal as present (activity to right of criterion)
miss
incorrectly identify signal as absent (activity to left of criterion)
false alarm
incorrectly identify signal as present (activity to right of criterion)
size of criterion
small = high hits and high false alarms
large = low hits and low false alarms
strong motivation = small beta
receiver operating characteristic (ROC) curves
used to compare performance of two+ tests - curves show a different level of decline/sensitivity - different levels of criterion indicated
d’ is lower with lighter stimulus
biology of sensation
physiological response to stimulus
ignored by psychophysics
transduction
information processing
sensory coding
doctrine of specific nerve energies
cranial nerves
synapse
neurotransmitters
transduction
how energy in environment gets transformed into electrical energy by the nervous system
different for each energy system
information processing
what happens to electrical signals as they travel
different routes for each sensory system
sensory coding
how brain understands what electrical signals reaching it mean
doctrine of specific nerve energies (Muller, 1801-1858)
nature of a sensation depends on which nerves are stimulated, not on how nerves are stimulated
neural signals are identical across sensory modalities and we have specific nerves for each sensory system
cranial nerves
12 pairs of nerves that originate in brain stem or thalamus and reach periphery through opening in the skull
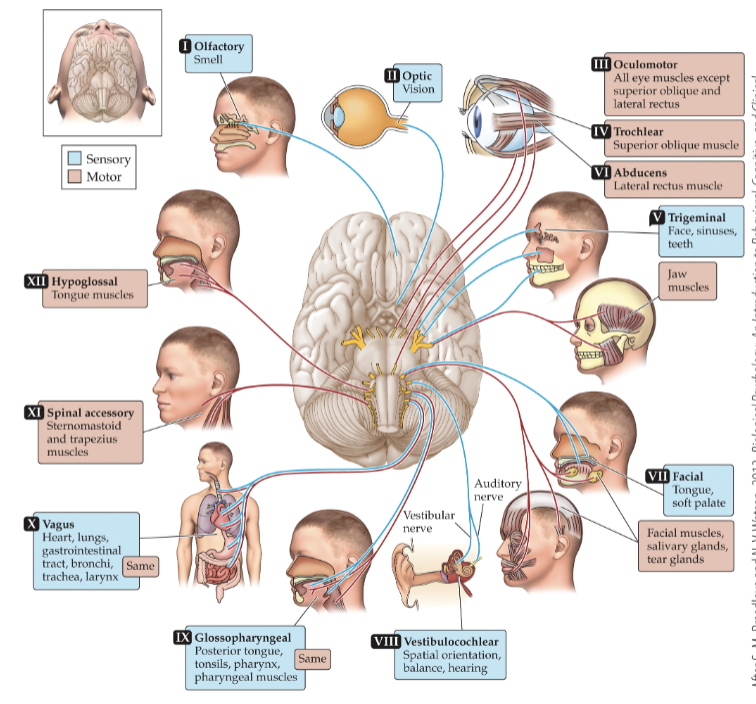
nerve pairs carrying sensory info (7)
sensory only
olfactory (I)
optic (II)
vestibulocochlear (VIII) - auditory + vestibular nerves
sensory and motor
trigeminal (V)
facial (VII)
glossopharynegal (IX)
vagus (X)
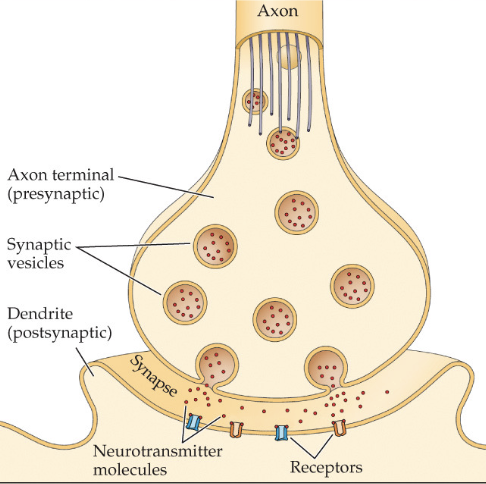
synapse
junction between neurons that permits information transfer
occurs between axon terminal and dendrites of post-synaptic neuron
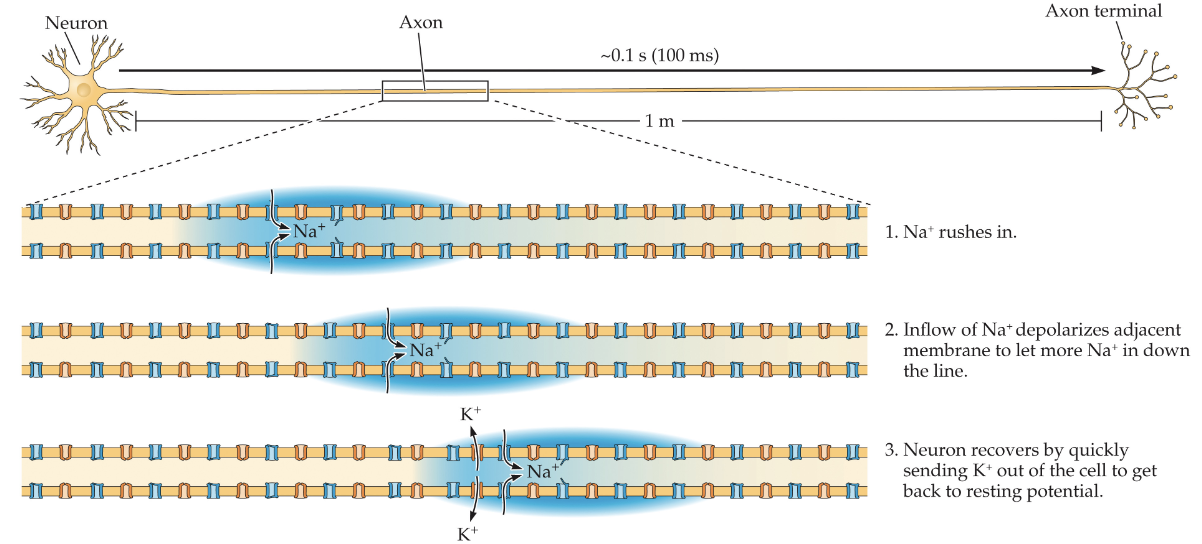
neuron electrochemical responses
Na+ rushes in
Inflow of Na+ depolarizes adjacent membrane to let more Na+ in down the line
Neuron recovers by quickly sending K+ out of the cell to get back to resting potential
neurotansmitter
chemical substance used in neuronal communication at synapses
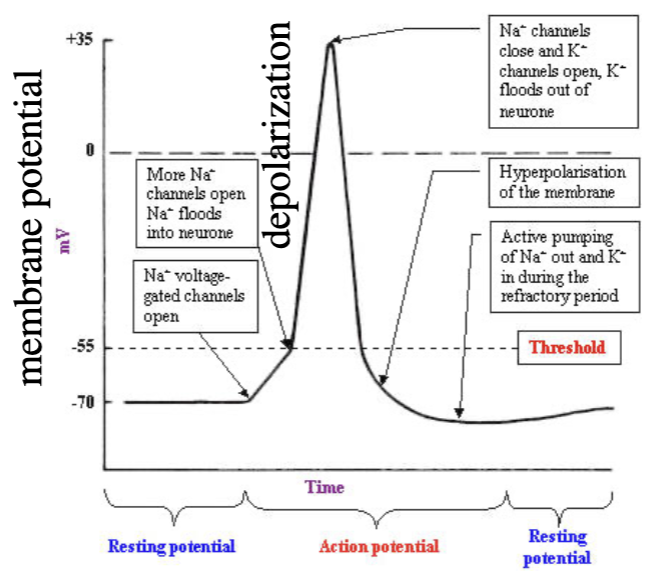
action potential
rapid depolarization of membrane potential during neuron activity
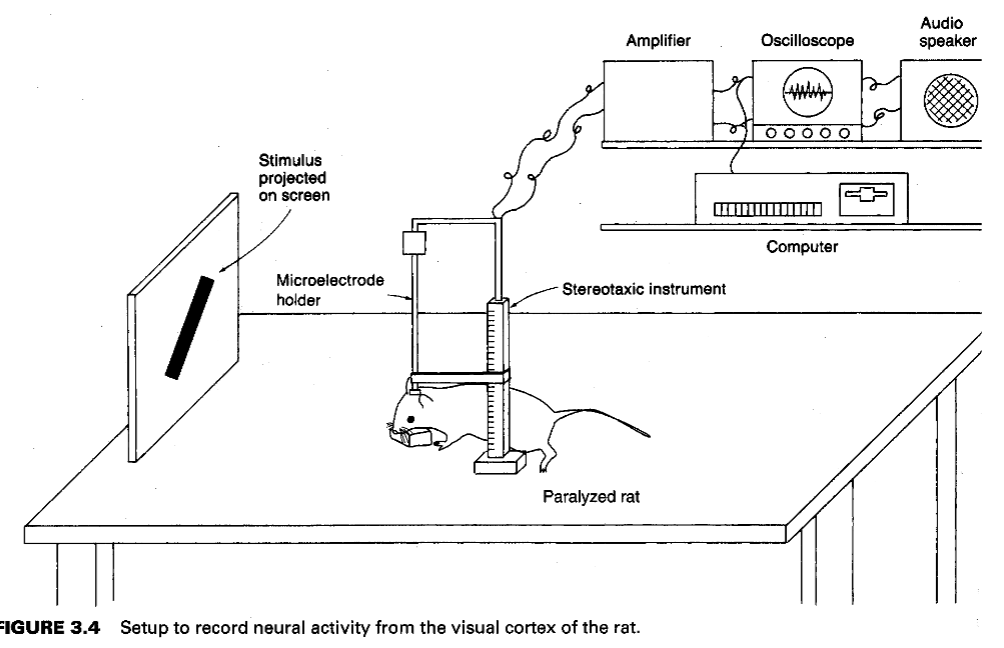
animal single-unit recording
can look at individual neurons this way - only can with animal studies
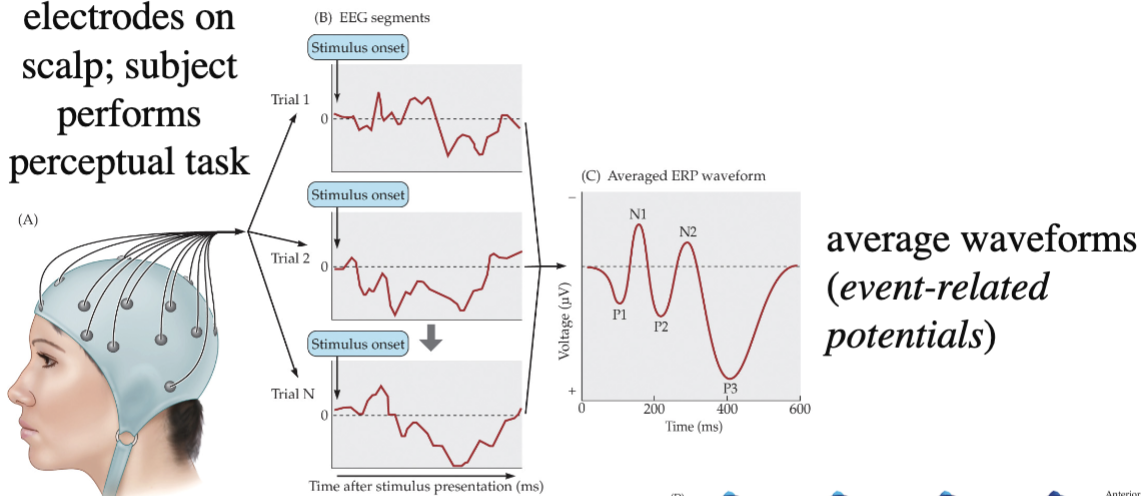
electroencephalography (EEG)
electrodes on subject’s scale and they perform perceptual tasks, measuring voltage changes
map signal strength over time across scale through many neurons
good temporal resolution (looking at changes over time)
poor spatial resolution (looking at specific point of occurrence)
most similar to animal single-unit
voltage change averages = event related potentials
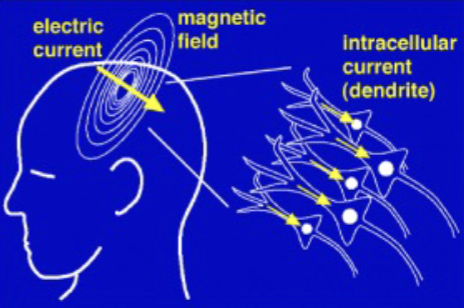
magnetoencephalography (MEG)
measures magnetic fields created by flow of ion currents between neuron with magnetometers (superconducting quantum interference devices (SQUID))
see where activity is occurring in the brain
not good at seeing activity deep in the brain
positron emission tomography (PET)
radioactive tracer injected into participant and as tracker decays, positrons are emitted and picked up by scanner
areas of high radioactivity are associated with neural activity (based on blood flow)
good for studying disease (cancer) or brain chemicals
poor spatial resolution (used with MRI to improve)
invasive
structural MRI
large magnet obtains high res images of body based on differences in water content
gets a good picture of the brain
can’t look at brain function
functional MRI (fMRI)
same scanner as MRI, but images blood-oxygen levels instead
neural activity → increase in blood flow/volume → increase in oxygen consumption → increase in oxygen in venous blood (gets redder) → stronger MRI signal
display as activation map - 2 conditions
non-invasive procedure
best spatial resolution, but response changes very slowly
See where something is happening
studying physiological response to sensory experience
animal lesion studies
human clinical lesion studies
animal lesion studies
MT lesion disrupts motion perception
V4 lesion disrupts colour perception
human clinical lesion studies
ex. damage to Broca’s area = problems with speech production, damage to Wernicke’s area = problems with understanding speech
sense of hearing
physical stimulus = sound → physiological response = pattern of electrical activity in sensory receptors, nerves, brain → sensory experience = hear something
components of physical stimulus
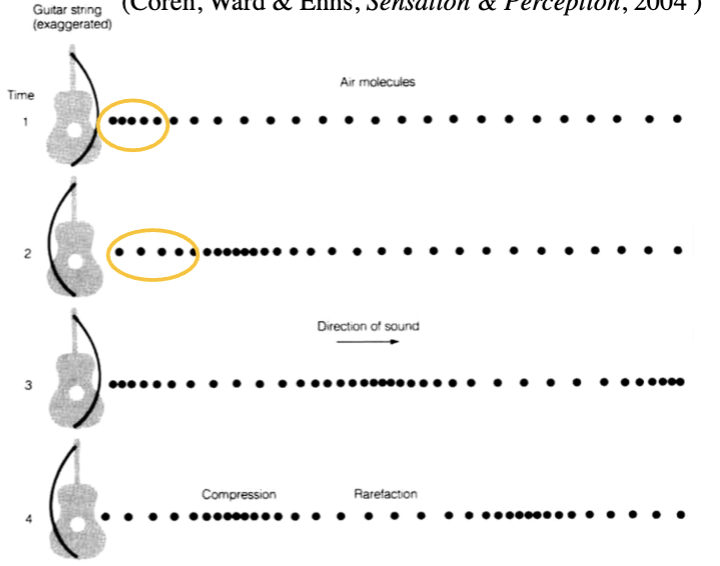
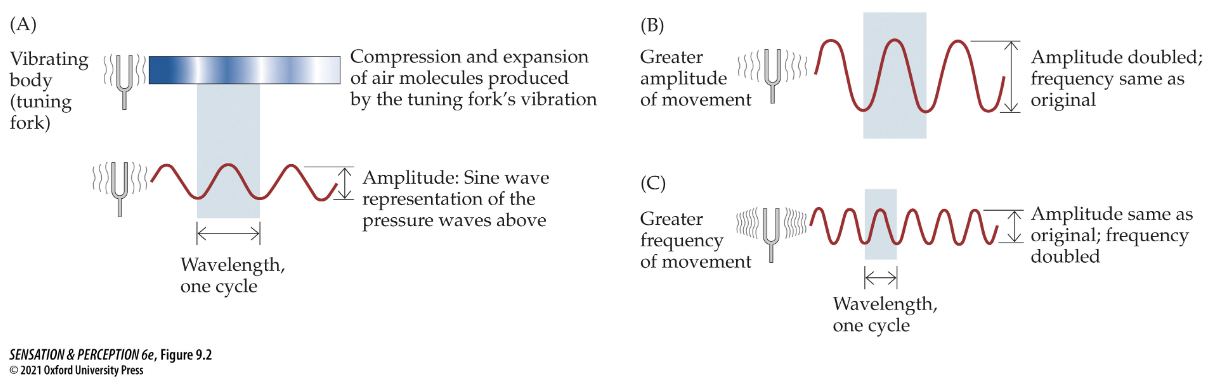
sound produced by physical vibrations
compression
refraction
frequency
phase
amplitude
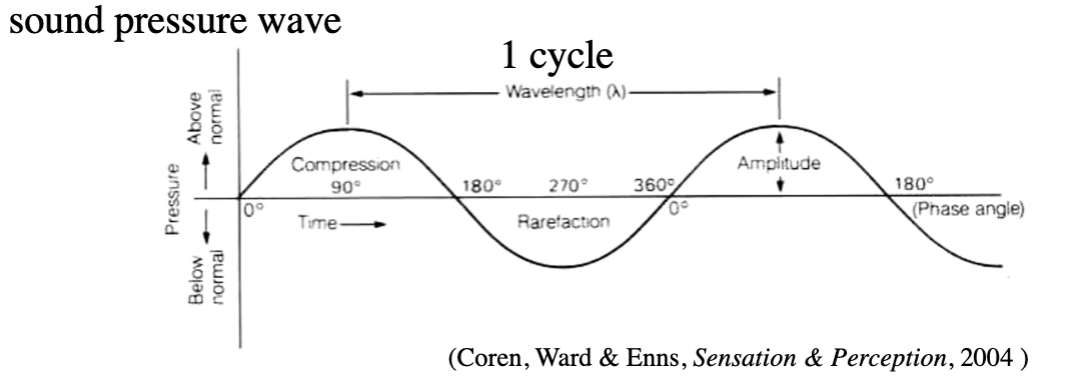
compression and rarefaction
compression: air molecules bunch together
rarefaction: air molecules spread apart
frequency
rate of fluctuations of sound pressure per second
measured in cycles/second or hertz (Hz)
perceived as pitch
phase
part of cycle sound pressure wave has reached at given point in time
measured in degrees (∘)
amplitude
max pressure change of wave above normal atmospheric pressure, difference between highest and lowest pressure of the wave - several different units
sound pressure: force against eardrum - dynes/cm2 or pascals (newtons/m2)
absolute threshold of 1000 Hz tone = 0.0002 dynes/cm2
painful 1000 Hz tone = 2000 dynes/cm2
sound intensity is proportional to pressure2
sound pressure level (amplitude or intensity): ratio of sound pressures converted to log scale - decibels (dB)
dB = 20*log (P/Po) - P is sound pressure of tone, Po (”P not”) is reference pressure of 0.0002 dynes/cm^2 or 0.00002 pascal)
Measuring intensity = dB = 10 * log (P^2/Po^2)
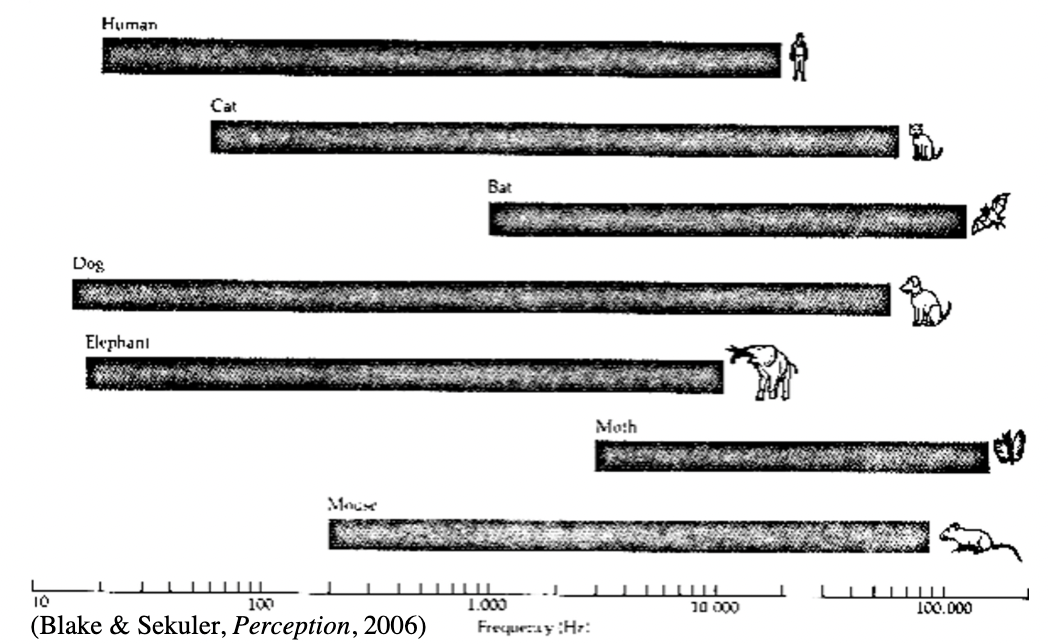
human hearing range
20-20000 Hz
lose highest frequency sounds first
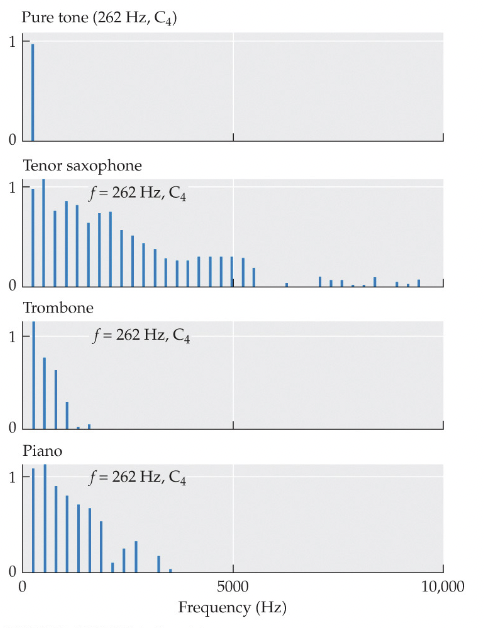
pure tones
Made by tuning forks - represented by single sine waves (only they achieve this)
sound frequency corresponds to perceived pitch
sound pressure level corresponds to perceived loudness
frequency and amplitude are independent from each other
complex tones
most sounds we hear - set of sine waves (according to Fourier’s theorem)
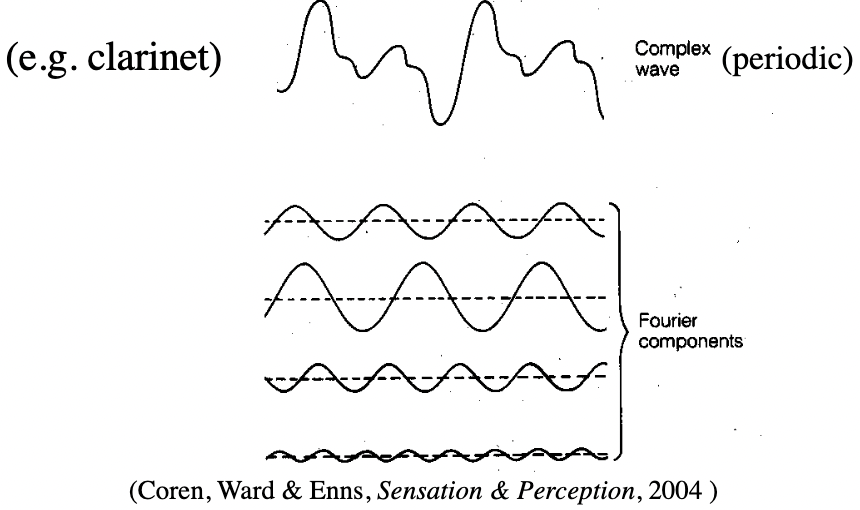
fourier theorem
mathematical procedure for separating a complex pattern into component sine waves that vary over time (hearing) or space (vision)
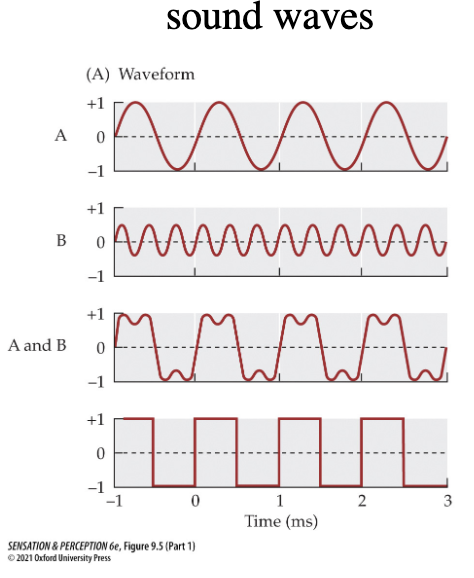
amplitude spectra (from Fourier analysis)
extracts sine wave components from complex sounds - shows frequency of sine wave, complexity of sound wave, amplitude, phase
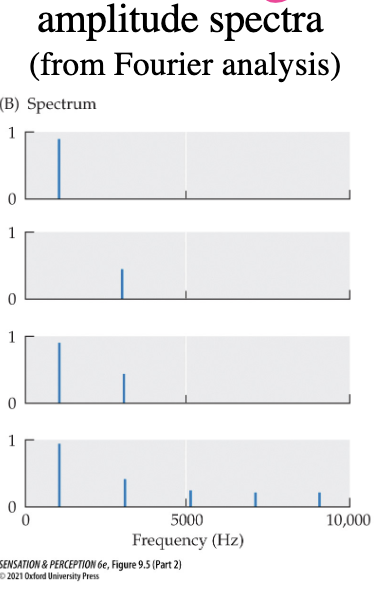
fundamental frequency
lowest sine-wave frequency in a complex sound - usually determines perceived pitch
harmonic frequency
higher frequency sine-wave components - integer multiples of fundamental frequency
differences determine psychological attribute of quality or timbre (why different musical instruments sound different)
Instruments can have same pitch but differ in timbre
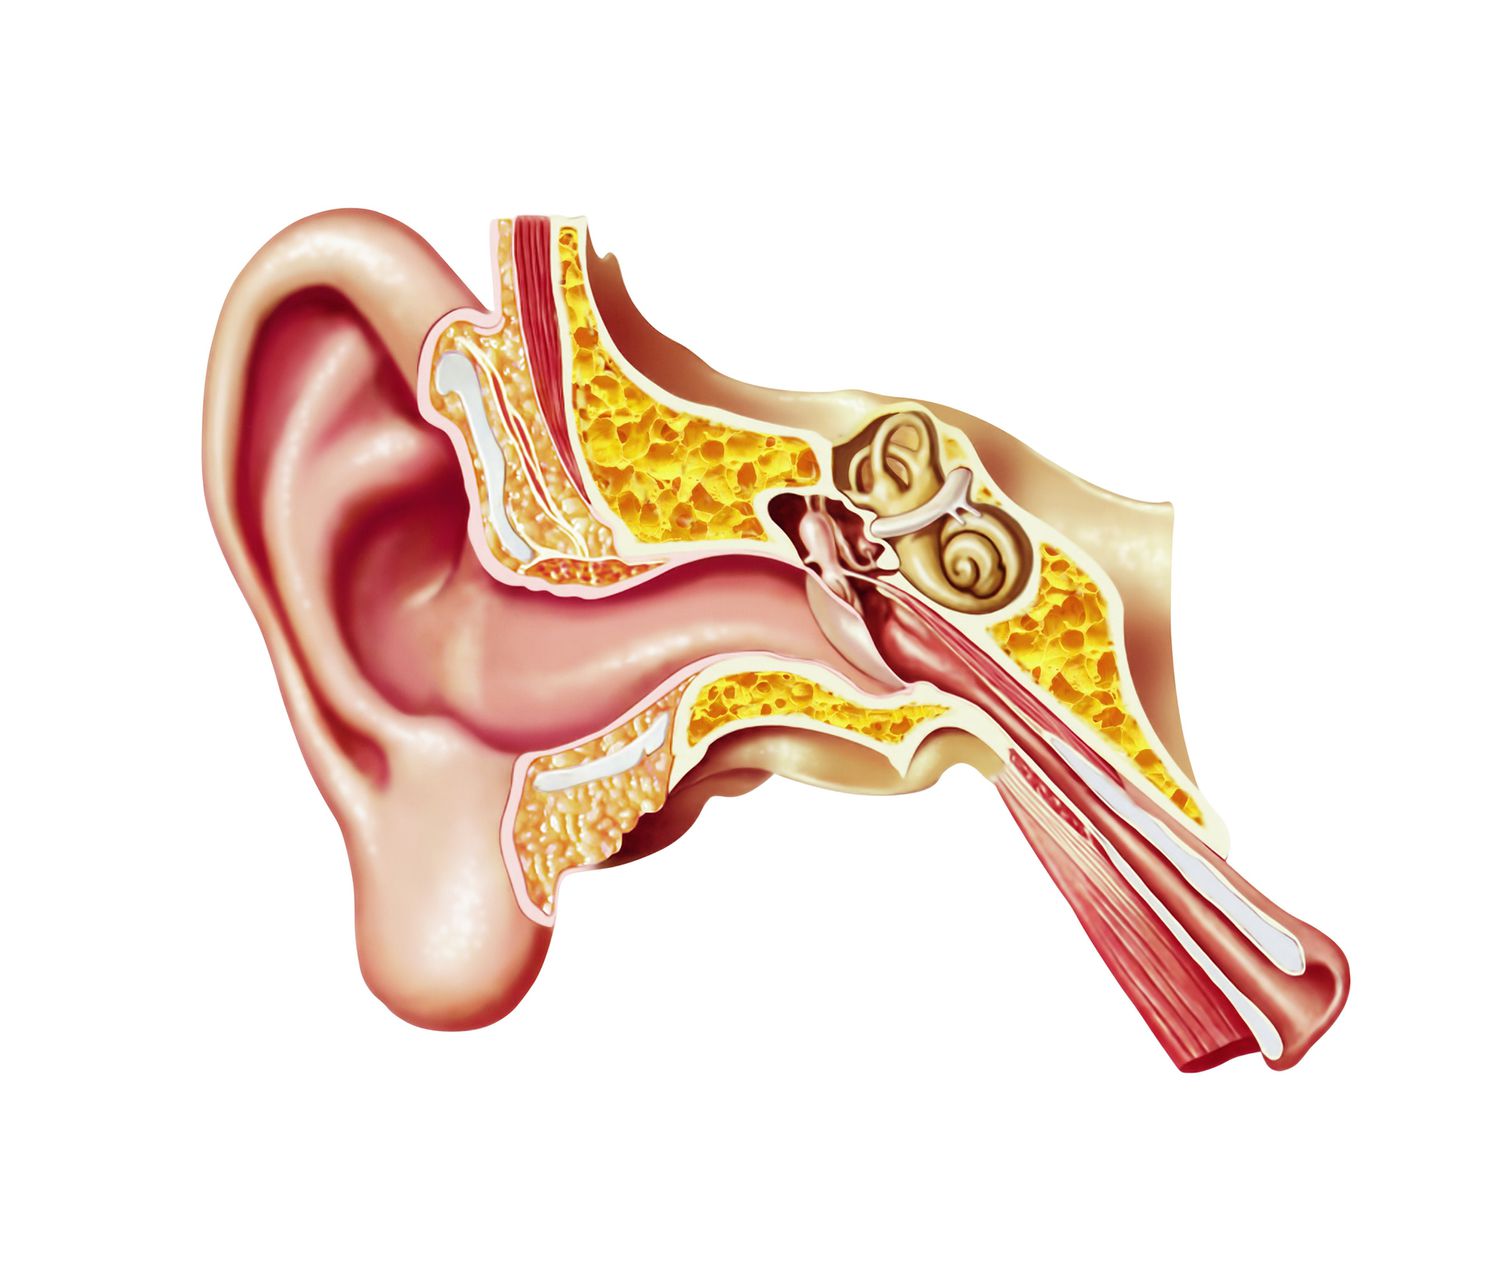
outer ear
gathers sound energy and funnels it to the tympanic membrane (eardrum)
ear canal
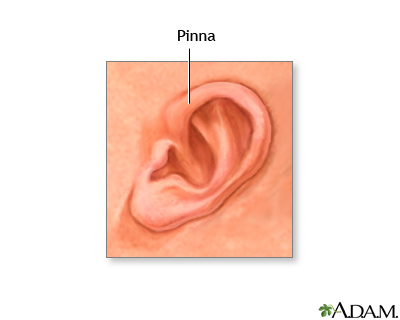
pinna
pinna
external ear shape - helps with sound localization
ear canal
outer ear to middle ear - length/shape enhances sounds between 2000 and 6000 Hz
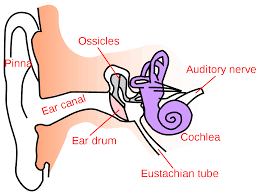
middle ear
amplifies sound energy and protects inner ear from harmful loud sounds
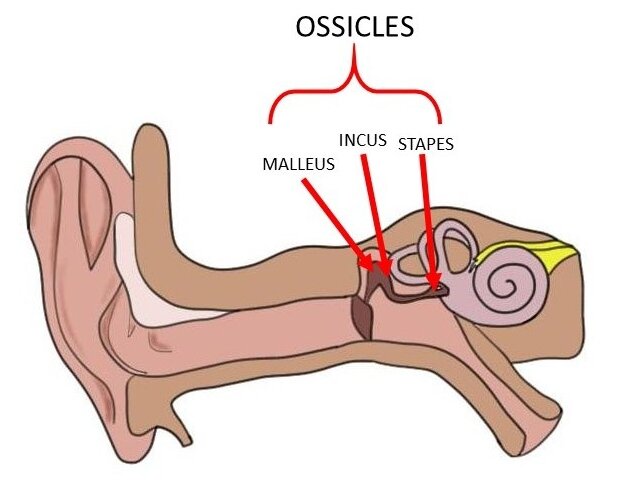
ossicles
impedance matching
tympanic membrane
acoustic reflex
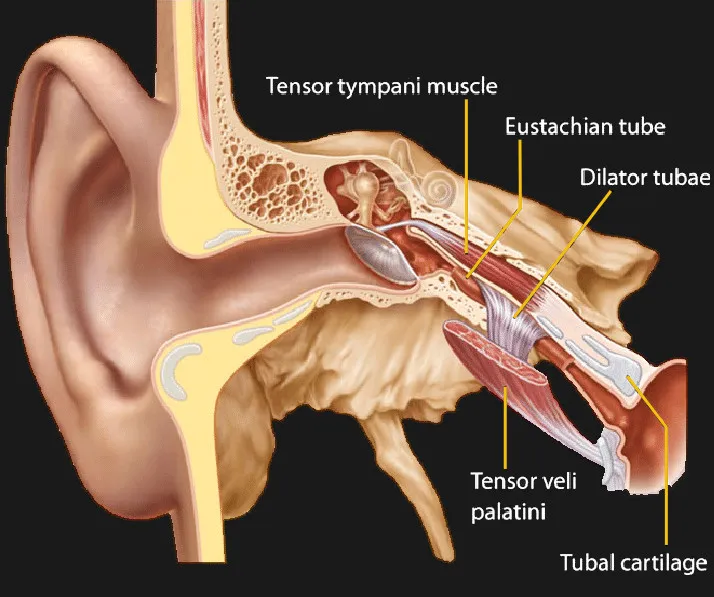
eustachian tube
tensor tympani
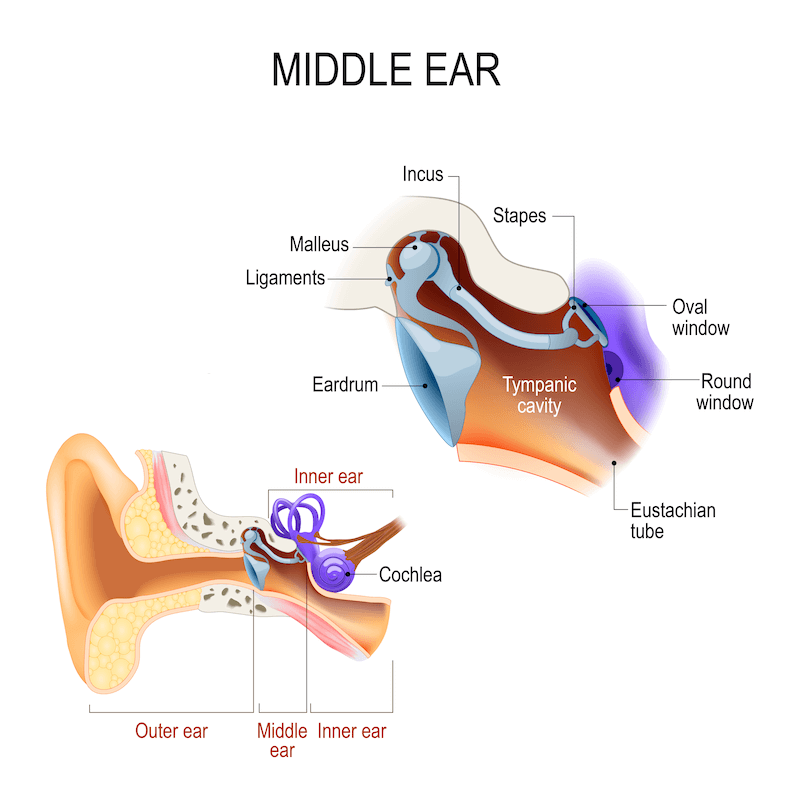
ossicles
malleus, incus, stapes - small bones in middles ear that transmit air vibrations from outer ear to inner to be processed as sound
act like levers - even out the weight from tupanic membrane (factor of 1.3)
impedance matching
middle ear amplifies sound energy to reduce loss due to reflection at oval window - middle ear is filled with air and inner with fluid
middle ear contains low-impedance sounds, inner ear has high-impedance fluid
tympanic membrane
aka eardrum, separates outer ear from middle ear - larger than neighbouring stapes footplate and increases pressure change at oval window by ~17x
sound waves at it cause it to vibrate, transfer vibrations to ossicles who transfer the signals to inner ear
pressure = force/unit area
like a high heel stepping on your foot
tensor tympani
muscle that contracts and pulls the malleus to tense the tympanic membrane and dampen vibration in the ear ossicles, reducing perceived amplitude of sounds
stapes do the same thing
acoustic reflex
in response to prolonged loud sounds, tensor tympani and stapedius muscles contract to reduce magnitude of auditory signal transmitted to inner ear
reduce sound pressure level by 30 dB
eustachian tube
equalizes air pressure between middle and outer ear
pressure needs to be the same on both sides or it is painful for the ear (like plugged ears on an airplane)
every time we swallow, air flows into middle ear to equalize pressure
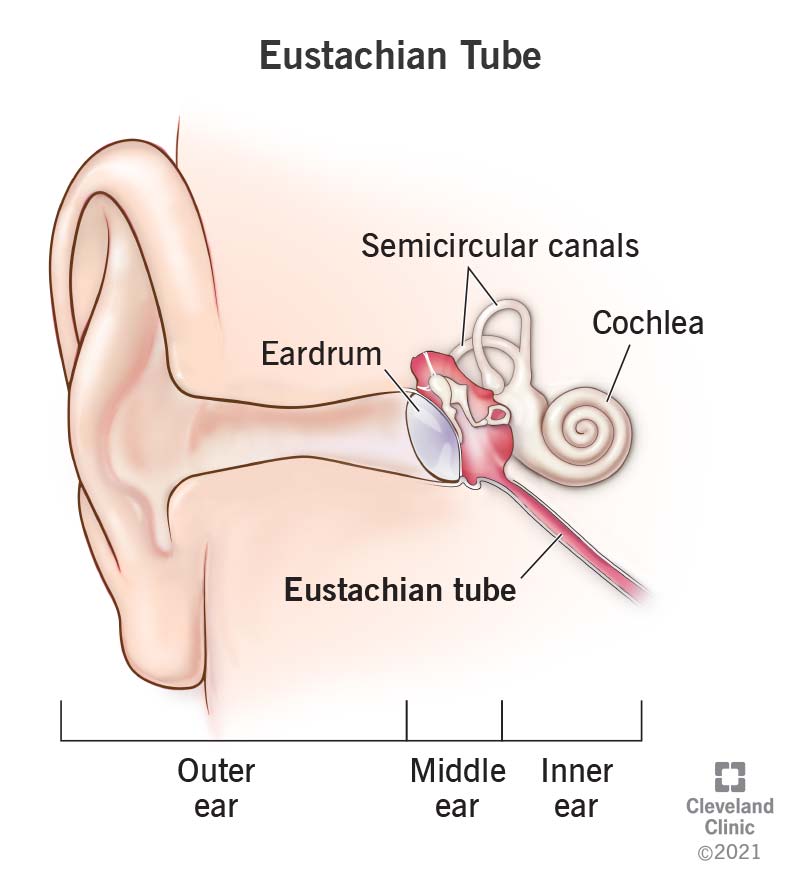
inner ear
helps hearing, balance, detecting and transferring auditory signals to brain
vestibular, tympanic canals (perilymph fluid)
cochlear duct (endolymph fluid)
organ/tunnel of corti
basilar membrane
cochlea
hair cells (stereocilia)
auditory nerve fibres
tympanic and vestibular canals
transduce movement of air that cause tympanic membrane and ossicles to vibrate to movement of liquid and basilar membrane
filled with perilymph fluid to assist
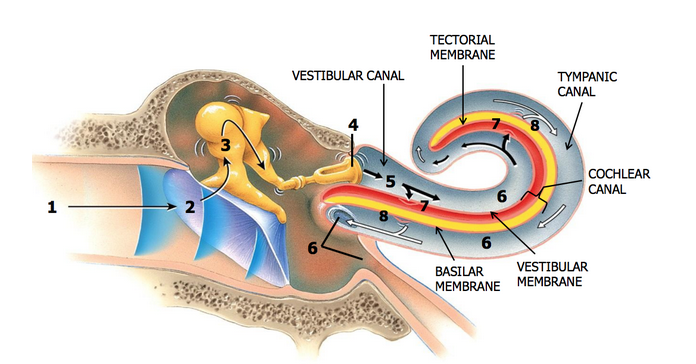
reissner’s membrane
aka vestibular membrane - separates cochlear duct from vestibular duct and helps transmit vibrations
basilar membrane
separates the cochlea from the tympanic and vestibular canals
cochlear duct
houses organ of corti, filled with endolymph fluid, between the tympanic and vestibular duct - self-contained