Intro/Norms - class 1-2
1/54
There's no tags or description
Looks like no tags are added yet.
Name | Mastery | Learn | Test | Matching | Spaced | Call with Kai |
|---|
No analytics yet
Send a link to your students to track their progress
55 Terms
what is a psycholgical test? (def + 3 main characteristics)
a standardized tool/instrument designed to measure of specific psychological attribute like personality traits, intelligence or mental health status
must be objective, reliable and valid
how psychological tests differ from other measurement tools? (2)
focus on intangible (*latent) theoretical constructs (e.g. psychological attributes) unlike tools measuring physical properties (e.g. rules, scales)
require specialized knowledge for proper interpretation unlike physical measurements
Ex. Unlike tests like length-- you don't need to be an expert to use and interpret the measures a ruler gives you
what is a psychological construct or attribute? (3)
unobserved abstract concepts like intellgence, anxiety or self-esteem
hypothesized to explain the covariation btwn observed behvaiours *we have good evidence/theory to suggest that they exist--their existence is the reason why certain behaviours co-exist together
Ex. is a person loud, outgoing, sociable, etc. bc we see those behaviours existing together, theory tells us those may be indicators of extraversion. we can differentiate btwn ppl low VS high on extroversion
measured indirectly via behaviours, responses or test results *So we hypothesizes/theorize, identify observable behaviour/indicators of that phenomenon, we measures them which allows us to rate and classify ppl based on the construct (our theory)
two accounts of psychological constructs
social constructivist vs positive objectivist account
social constructivist vs positive objectivist account
Social Constructivist → Psychological constructs/tests are shaped by culture, history, and social values. They are not universal truths but culture-bound ways of understanding people.
Positive Objectivist → Psychological phenomena (e.g., memory, anxiety) exist universally across cultures; tests aim to measure these real features of humans.
3 defining characteristics of psychological tests (3)
1)test consists of representative sample behaviours—obsverable and measurable actions *(behvaiours) thought to measure (an underlying) psychoglical attribute
2)behavioural samples obtained under standardized conditions *Tests must be given under uniform (standardized) conditions so results are comparable across individuals.
3)have results for scoring *Tests are designed to produce scores that quantify the behaviours/attributes being measured.
These scores allow for interpretation (e.g., higher vs. lower passion for psychometrics, level of anxiety, cognitive ability).
In short: Psychological tests (1) have represenative sample behaviours representing a construct, (2) are administered to behavioural samples under standardized conditions, and (3) produce scores that allow for systematic evaluation.
similarities (1) vs differences (6) btwn psychological tests
similarities: all require a person to perform a behaviour
differences: behaviour performed *behaviours you are asked to perform
construct measured and outcome
content
administration and format *How the tests are administered and what its format is
scoring and interpreations *How they are score and interpreted
psychometric quality *Not all tests are made equally—they may differ in psychometric qualities like reliability and validity
4 kind of purposes for testing (4)
1)classification
2)promoting self-understanding
3)planning, evaluation and modifcation of treatments/programs
4)scientific inquiry *to advance scientific inquiry
1)classification (2)
Classification Purposes of Psychological Tests
1. Diagnosis: Place an individual into categories of distinct psychopathology. (ex. Diagnosing depression, ADHD, or anxiety disorder.)
Test results guide treatment decisions.
Accuracy is crucial → high standards for evaluating tests.
2. Selection: Select individuals for specific roles, jobs, or promotions. (ex. Example: Hiring employees, selecting candidates for specialized training programs)
Helps maximize efficiency of resources by choosing the most suitable candidates.
2)promoting self-understanding (3)
Tests can promote better understanding of ourselves
We have a motivation to know ourself more and better--tests help us to satisfy this need
Multiple tests we can take to provide more insight on self: goals, managing emotions, values, etc.
ex. vocation interest tests (to ‘find which job is best for you’)
3)planning, evaluation and modifcation of treatments/programs (4 lvls)
1)process lvl: Focuses on how a treatment or program is delivered.
2)outcome lvl: Focuses on the effects or results of the intervention.
3)individual lvl: Tests help design and modify treatment for specific individuals.
4)group lvl: Tests help design or modify programs for groups or populations.
scientific inquiry (3)
1)quantification & hypothesis testing
Tests provide quantitative data for research and program evaluation.
Accurate measurements are crucial to quantify relationships between variables (e.g., Variable A related to Variable B).
2)reducing type II error
Imprecise tests increase noise and the risk of Type II errors (phenomenon exists but test/data fails to detect it). *pregnancy test doesn’t detect pregnancy for pregnant woman, ‘false negative’
measurement (def), outcome for measurement (3)
measurement: the process of obtaining a numerical description of the degree to which an individual possesses a particular characteristic
We want to turn observations into measurable data--basically measurement; Turning what we observe into numbers in a consistent way
Ex. Observe friendliness, convert into numbers based on objective/consistent rules that can be applied to other ppl
outcome of measurement: assign individuals to a category (number) *creating categories for individuals
the complete set of categories make up a scale of measurement
the relationship betwn these categories defines the type of measurement scale *relationship between numbers determines the type of measurement scale we use
(applications of) measurement scale (2)
RE: the relationship betwn these categories defines the type of measurement scale *relationship between numbers determines the type of measurement scale we use
measurement scale determines the kinds of:
1)statistical procedures that can be applied to the (test) score produced by the measure
2)comparisons we can make among individuals using that scale
“If a thing exists, it exists in some amount; and if it exists in some amount, it can be measured’ - Thorndike
4 types of scale
1)nominal
2)ordinal
3))ratio
3)interval
*never order rotten ice (cream)
1)nominal (def, appropriate stats, possible comparisons)
def: numbers are assigned to represent labels or categories of data only
No magnitude, equal interval or absolute 0
appropriate stats: frequency & mode
possible comparison btwn score: different *Tells us that categories are just diff from each other (e.g. men vs women, blue vs red) we can't compare categories in terms of amount of difference
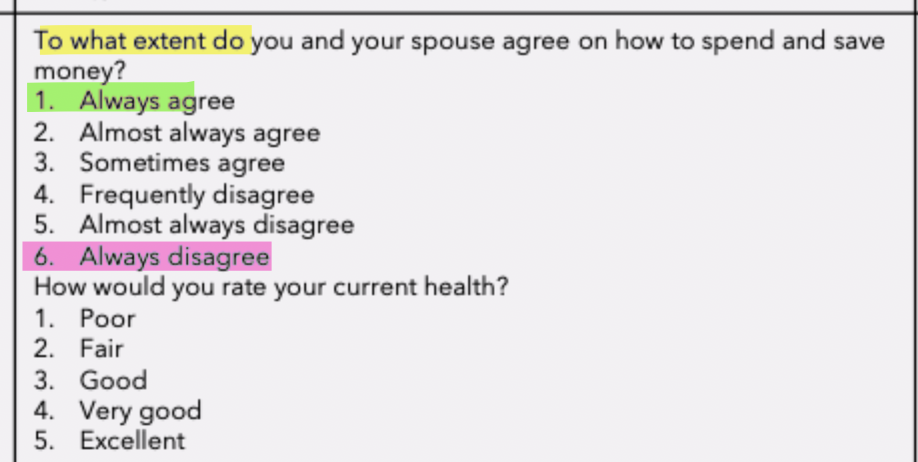
2)ordinal (def, appropriate stats, possible comparisons)
def: numbers are assigned to rank-ordered data; distance btwn numbers is not equal
*rank individuals/objects–but no meaningful difference between the ranks
Magnitude but no equal interval nor absolute 0
appropriate stats: frequency, mode, median, percentile, rank-order correlation
possible comparisons btwn scores: ordered different *but we can't tell how much more and that the differences are the same across the whole scale
3)interval (def, appropriate stats, possible comparisons) - 4
def: numbers assigned/represent rank-ordered data AND 2)distance betwn numbers is equal (equal interval present) *We assume the distances btwn categories are the same across the whole scale
but no abosolute zero
appropriate stats: frequency, mean, mode, median, percentile, pearson correlation, t-test
possible comparisons: amount of difference + subtract
4)ratio (def, appropriate stats, possible comparisons btwn groups)
def: numbers assigned/represent rank-ordered data AND 2)distance betwn numbers is equal (equal interval present) AND 3) absolute 0 present *We assume the distances btwn categories are the same across the whole scale
appropriate stats: frequency, mean, median, mode, Pearson correlation, t-test, proportion
possible comparisons btwn groups: amount of differnce, subtract AND proportion
*ex. temp is interval bc not true zero, but kilometers is ratio bc there is true 0
norms (3)
norms give meaning to test scores
norms = test scores achieved by a defined groups of individuals (i.e. norm sample) *norm sample creates reference point
norm-based interpretations: compare an individual’s score to the norm group
where does a test taker stand in comparison with the group that defines the norm?
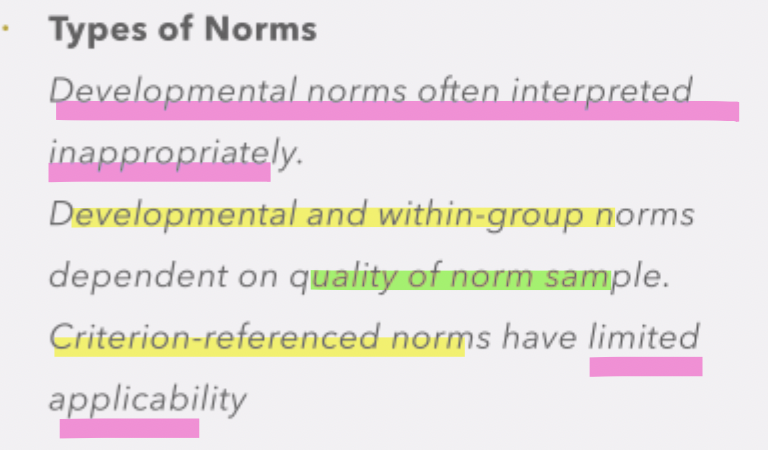
3 types of norms (4)
2 categories of norms: norms that use a norm sample VS norms without a norm sample
norms that use a norm sample: a)developmental norms and b)within-group norms
norms without a norm sample: c)criterion-reference norms
1)developmental norms (4)
Purpose: standards set to assess whether children/teens are developing cognitive, social, motor, and other skills at approximately the same rate as their peers.
Show typical skills expected at each age/grade (e.g., 5 y/o count to 10; 10 y/o add & subtract)
Based on median performance of age/grade group (less affected by outliers).
2 types: performance level (dev norms) + age-equiavalent and grade equivalent norms
How are developmental norms determined? (3)
Test takers are compared to a norm sample/reference group (same age or grade).
Median score (not the mean) is used: The median is less affected by outliers.
Example: A group of 3-year-olds take a motor development test. The scores are ordered from lowest to highest. The score at the midpoint (50% above, 50% below) is the median.
If a child scores at the median, we say their development is typical for that age. If a 36-month-old scores at the level of the median 26-month-old, we say their motor development is typical of a 26-month-old.
performance levels (developmental norms)
performance levels: each age group or grade level has a typical range of skills or knowledge that most people at that age or grade are expected to show
(e.g. most 5 yr olds can count to 10, while most 10 yr old can add and subtract numbers. these are typcial skills for these age groups)
age-equiavalent and grade equivalent norms (developmental norms) (2)
age-equiavalent and grade equivalent norms: these scores show how a person’s performance comapares to the average scores of others in the same age or grade
they are based on the median score, which representes the middle score when all scores are lined up from lowest to highest
(e.g. if a 7 yr old scores the same on a reading test as the avergae 9 ur old, we say their reading lvl if ‘age-equivalent’ to a 9 yr old)
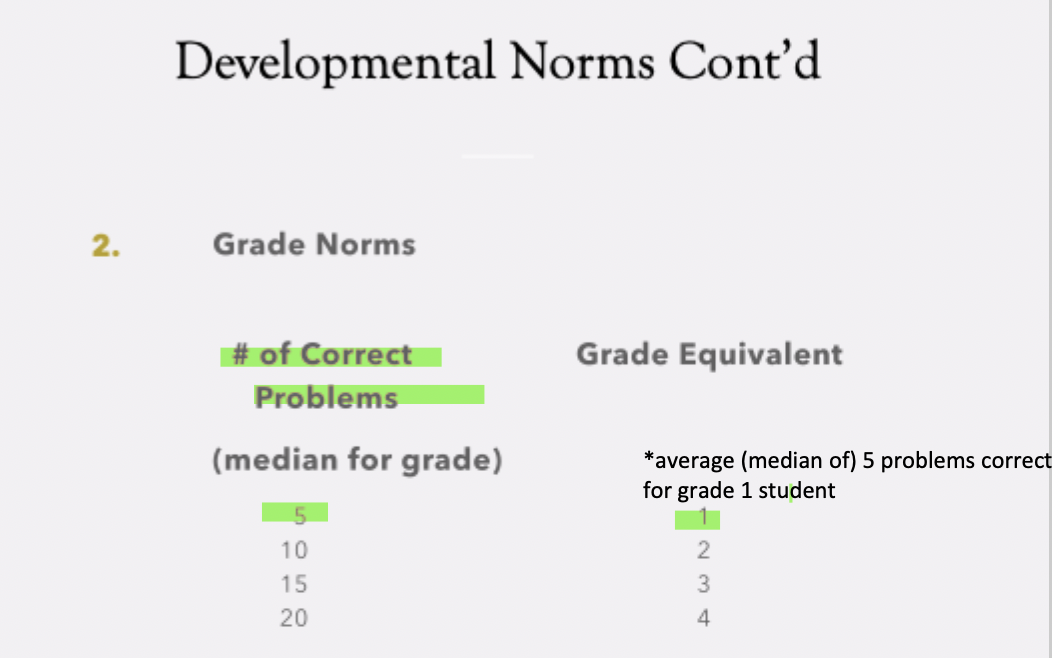
performance VS age-equiavalent and grade equivalent norms:
Performance Levels: Each age or grade has a typical range of skills/knowledge that most individuals are expected to show.
Age-equivalent score: A child’s performance is compared to the median score of a reference age group.
Grade-equivalent score: Same principle, but compares performance to students in a specific grade
3 purposes of developmental norms
1)show what skills are typical for each age, guiding expectations and curiculum
2)help identify students who may need extra support or (*who may encounter) additional challenges
3)assist in developing personalized educational plans
limitations of developmental norms (3)
scores can be misleading across grades
*across grades, a child might appear to be performing “above grade level” based on scores, but this doesn’t necessarily mean they’ve mastered the curriculum of the higher grade.
a child may score as well as a higher-grade student without having learned all the grade level material *just bc there’s overlap in material btwn grades
*a Grade 3 child might test at the same level as an average Grade 4 child bc their performance overlaps with what is typical for older children. They may have reached the score in a different way, using partial or uneven knowledge.
high scores indicate relative performance, not necessarily that the child has acquired the full set of skills expected at that age or grade *High scores indicate relative performance, not full skill mastery (of all higher grade-lvl skills)
ex. while high score shows a child is performing better than most peers of the same age or grade, it does not guarantee they have acquired all the skills expected for that stage of development. For instance, they might be advanced in vocabulary but behind in comprehension, and the score hides this unevenness.
within-group norms (3 types)
1)percentiles
2)z-scores (aka standard scores)
3)transformed standard scores (e.g. T-score, IQ)
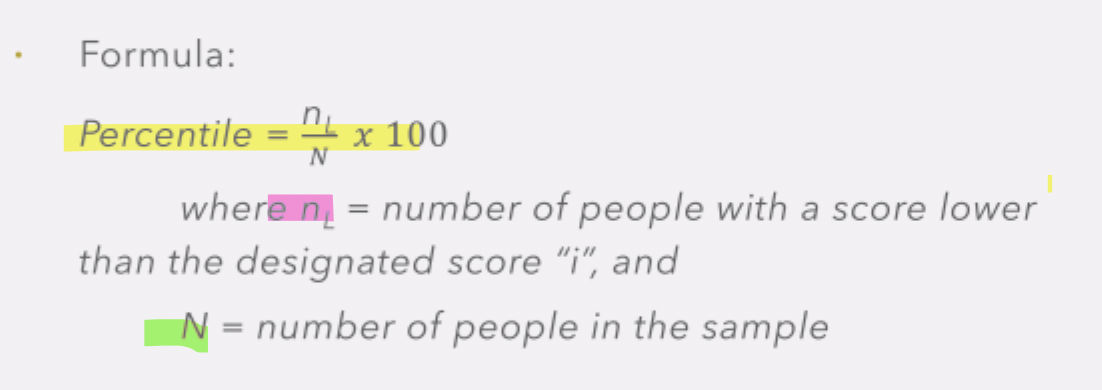
percentiles (3)
a percentile is a way to rank data by dividing it into 100 equal parts
the percentile reflects the percentage of individuals falling below a test score *percentage of test scores below a certain test score
e.g. if half the members of the norm sample had a score below 24 on a test, then 24 = 50th percentile
percentile formula (3)
normal distributions characterisitics (4)
Test scores typically follow a normal distribution.
single peak at the centre
symmetrical, bell-shaped curve
Cases pile up in the center (average scores are most common).
Scores drop off on both sides (fewer people at the extremes).
Mean = Median = Mode (all the same in a perfect normal distribution).
Intelligence in the population is normally distributed → most people have average levels, with fewer scoring very low or very high.
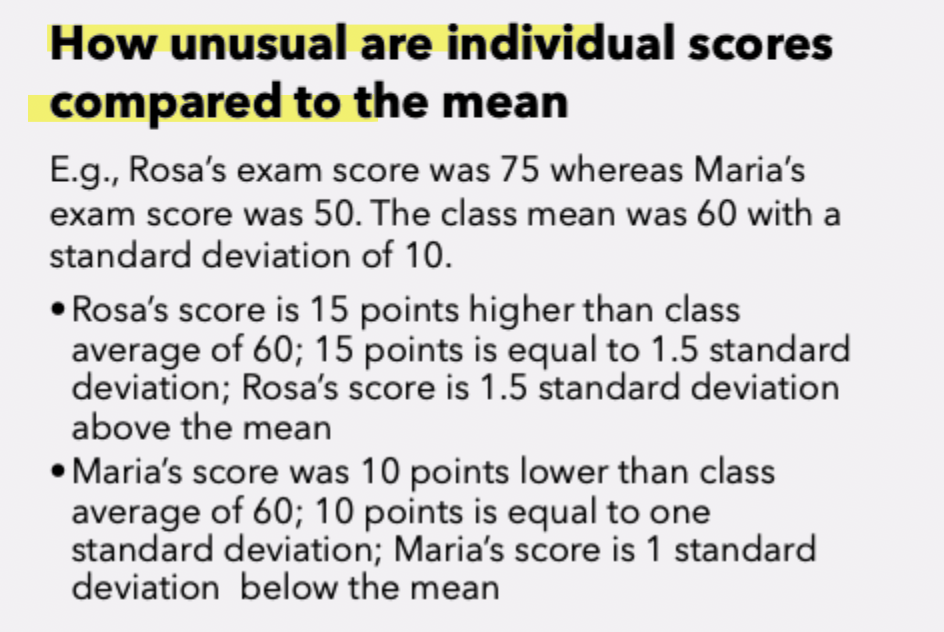
standard deviation (3)
*deviation—distance from the mean
standard deviation as a measure of average distance of scores from the mean
distance of a score from the mean = # of standard deviations of the score from the mean
SD and normal distribution help us determine how unusual *diff individual scores are compared to the mean *They help us compare scores from difference tests that use different measurements
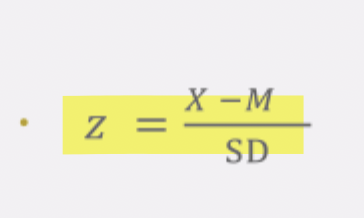
z-transformation (3)
z-transformation as the distance of a score (x) from the mean (M) expressed in standard deviation (SD) units
relative position of x in a distrbution of scores *in comparison to the mean
*Relative position: Instead of just knowing the raw score, the z-score shows where that score lies compared to the rest of the distribution. (ex. : A z-score of +1 means the score is one standard deviation above the mean. A z-score of –2 means that X is two standard deviations below the mean.)
→typical VS atypical scores
Typical scores are those close to the mean (z ≈ 0).
Atypical scores are those far from the mean (very high or very low z-values, e.g., ±2 or more).
This helps us see whether a score is “normal” for the population or unusually high/low.
z-transformation formula (3 pts)
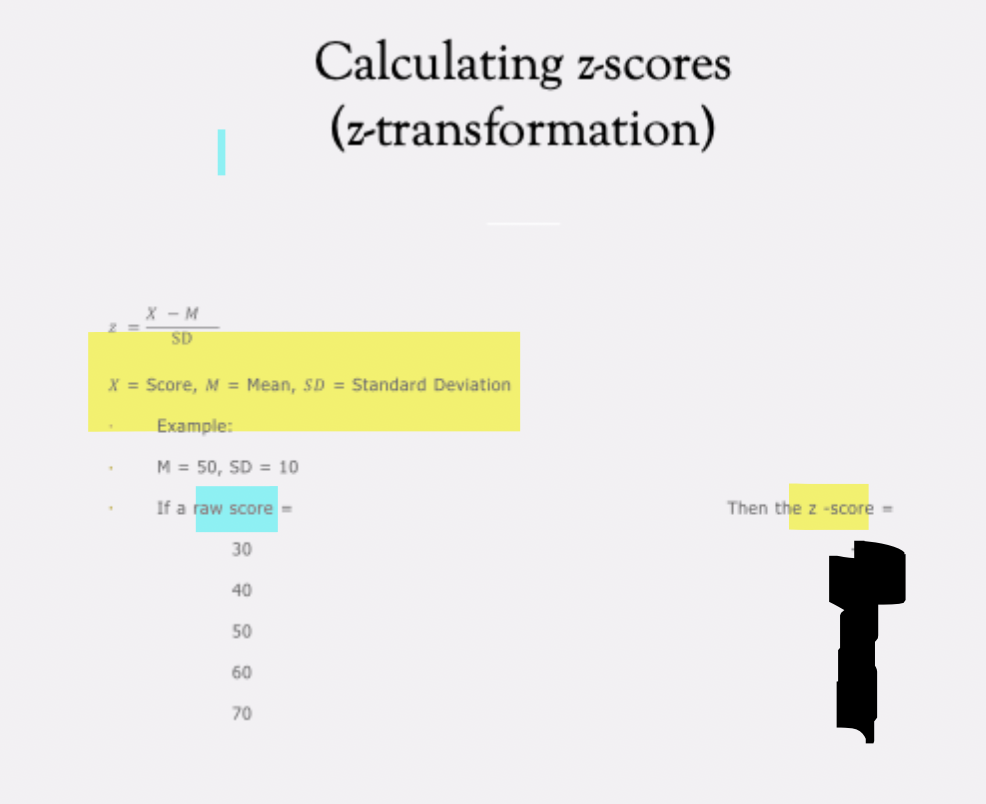
practice
purpose of z-transformation (3)
z-scores enable comparison of scores from diff tests by transforming them into common metric
standardizes scores based on each test’s mean and standard deviation;
expresses scores in terms of standard deviation from their respective means
facilitates direct and meaningful cross-test comparison
transformed standard scores (3)
transformed standard scores are the simple linear transformation of z-scores
Transform raw scores to z-scores and then transform z-score (standard scores) into transformed standard scores
1)Raw scores → z-scores. First, raw test scores are standardized into z-scores (mean = 0, SD = 1). Problem: z-scores are not very intuitive for comparing test scores (average = 0 or 1 is not meaningful).
2)Z-scores → transformed standard scores. To make scores more interpretable, z-scores are transformed into standard scores with new means and SDs. These are simple linear transformations of z-scores.
ex. SAT or IQ scores are the most well-known transformed standard scores
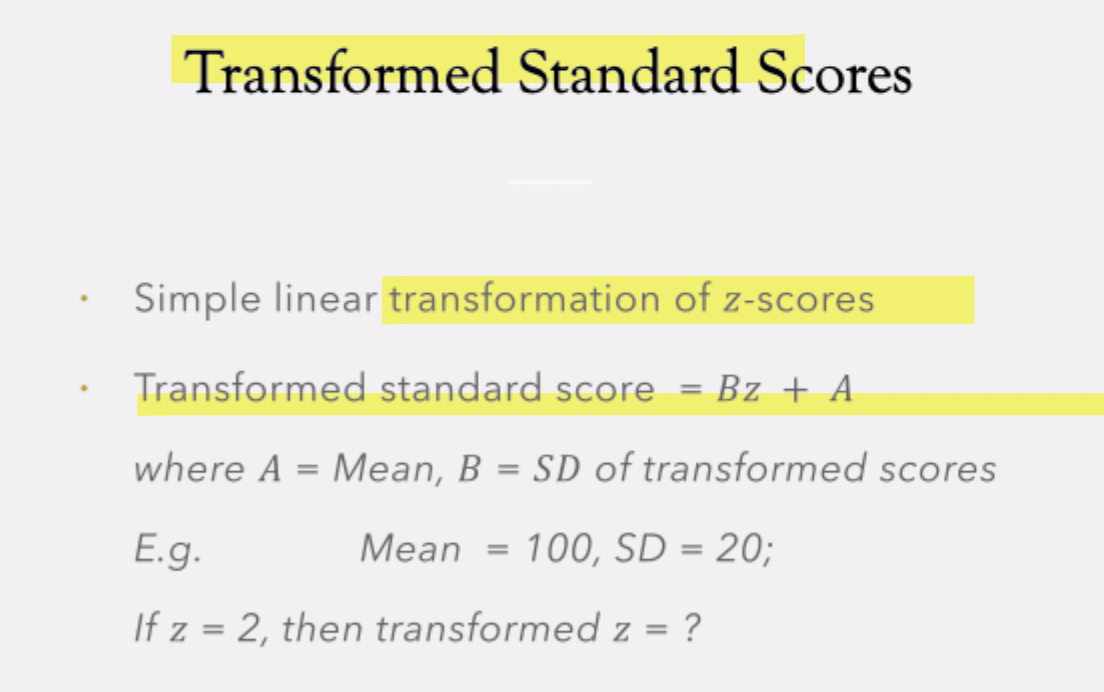
transformed standard score formula + practice
relationship btwn z-scores, percentiles and transformed standard scores
Normal Distribution Properties: Symmetrical, bell-shaped curve. Peak = mean = median = mode. Most data points fall in the center; fewer are in the tails. Because it’s a known distribution, we know how many data points should be in each region.
Percentages in the Distribution: 68% of scores fall within ±1 SD of the mean (34% on each side). As you move away from the mean: fewer data points → tails have very few cases. (Ex: ~0.13% of cases fall beyond ±3 SD (very rare/extreme scores). This allows calculation of z-scores, percentiles, and standard scores.
Connections: Z-scores express a raw score’s distance from the mean in SD units.
Percentiles: show the percentage of people scoring below a given score. (E.g., the 3rd percentile means the score is higher than 3% of people (very low).
T-scores and other standard scores: rescaled versions of z-scores for convenience.
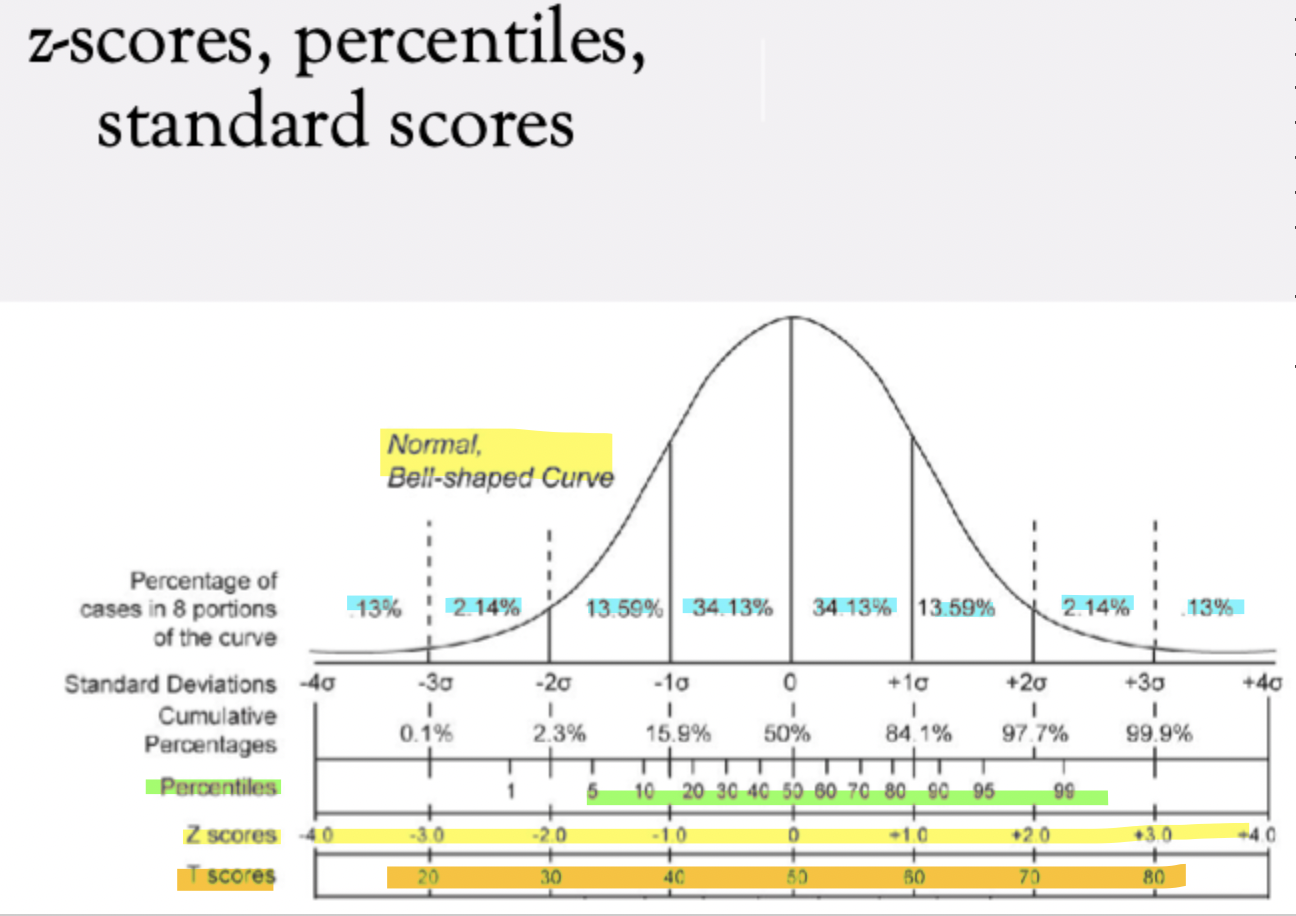
key differnces btwn percentiles, z-scores and t-scores (standard scores)
Percentiles: Unevenly spaced.Squished in the middle (small differences in raw scores lead to big percentile jumps). Stretched in the tails (big raw score differences only change percentile a little).
Z-scores: Evenly spaced. A change of 1 z-unit always equals 1 SD difference, regardless of whether the score is near the mean or in the tails.
T-scores: Another type of standard score, often used in testing (mean = 50, SD = 10). Convenient because they avoid negative values (unlike z-scores).
In short: Normal distribution properties let us map scores onto z-scores, percentiles, and standard scores. Z-scores show standardized distance, percentiles show rank in the population, and standard scores (like T-scores) re-scale z-scores for practical use.

normal distribution of people with respect to their standard scores (3)
50% of ppl below the mean *Because the normal distribution is symmetrical, exactly half of people score below the mean and half score above it.
about 34% between mean and 1 SD *In a normal distribution, the region between the mean and 1 standard deviation (SD) below the mean contains about 34% of the population.
*68% together for +1 and -1 SD from the mean
about 16% below 1 SD below the mean *Beyond 1 SD below the mean, only about 16% of people fall in this lower tail.
pros of standard scores (2)
1)show how far a score is from the mean in standard deviations
2)suitable for most statistical analyses (e.g. correlation, regression)
cons of standard scores (2)
1)less familiar to non-specialists
2)less meaningfull when data is not normally distributed
pros of percentiles (3)
1)easy to understand
2)simple to compute
3)interpretation remains consistent regardless of distribution
cons of percentiles (3)
1)magnifies differences near the mean; minimizes differnces at the extremes *not evenly spaced in same way as standard scores (e.g. z score)
2)does not convey the magnitude of score differences
3)limited use in advanced statistical analyses (e.g. regression, correlation) due to distribution assumptions
limitations of within-group norms (2)
only meaningful if the standardization sample is representative
the individual being assessed must resemble the group on which the norms are based; otherwise, interpretations may be inaccurate
within-group comparisons can encourage competitiion
focusing on relative standing may promote rivalry, which can distract form personal growth and understanding
criterion referenced norms (3)
evaluate performance relative to an absolute criterion or standard rather than performance of other individuals *Instead of comparing a test-taker to their peers (like in norm-referenced tests), performance is judged against a fixed standard.
an absolute evaluation (criterion reference) vs relative evaluation (norm reference)
requirement: define content domain narrowly and specifically *To use criterion-referenced norms, the skills or knowledge domain must be clearly defined and limited.
ex. If assessing “fractions,” the test must specify what fraction skills (adding fractions with like denominators, converting improper fractions, etc.), otherwise the criterion has no clear meaning.
an absolute vs relative evaluation (4)
Absolute evaluation (criterion-referenced): Measures if someone met a specific skill/knowledge standard (e.g., can tie shoelaces, can read 100 words per minute).
Relative evaluation (norm-referenced): Compares people to each other (e.g., scored better than 70% of students).
criterion referenced norms (Ex. Driving Test) - 3
Example: Driving Test
There are defined criteria for being a safe driver (e.g., can change lanes, park, follow signals).
When you take the test, you are assessed on whether you meet those criteria.
Passing depends on meeting the threshold of mastery, not on being above the average performance of peers. *absolute standard
→ This is what makes it criterion-referenced, rather than norm-referenced.
limitations of criterion referenced norms (3)
1)can elements of performance be specifically defined? it’s hard to define subjective/complex areas precisely
Criterion-referenced testing depends on having clearly defined skills or knowledge domains.
In complex areas (e.g., “critical thinking,” “social skills”), it’s very difficult to specify all the elements that count as “mastery.” *we may end up not capturing everything we want to bc hard to define
2)focus on minimum standards *instead of full/exeeding ability range
Often, criterion-referenced norms are designed around cutoff scores (e.g., 70% = pass).
This can lead to a “minimum competence” mindset—students may only aim to meet the standard, not exceed it.
3)absence of relative knowledge/*standing in comparison to peers
Criterion-referenced tests don’t tell you how someone did compared to others.
While you know whether they “met the standard,” you don’t know if they performed much better, slightly better, or worse than peers.
summary of types of norms (3)
norm-referenced testing (2)
Convert raw score to standardized scores (e.g., z-score, t-scores, IQ scores, etc)
A raw score (e.g., 45 out of 60 questions correct) by itself isn’t very informative
To make scores meaningful, raw scores are converted into standardized scores (z-scores, etc.), which show where an individual stands relative to the distribution of scores in the reference group (the norm sample).
Requires comparing raw score to norm sample (aka "norm based interpretation")
Norm-referenced testing is based on relative standing: how a person did compared to others in the same age, grade, or demographic group. *same characteristics
The norm sample is a large, representative group used as a benchmark.
Example: An IQ score of 115 doesn’t mean “115 points correct”; it means the person scored higher than about 84% of the population (since the mean is 100 with SD = 15).
elevated score (2)
elevated score is a test score that is unusually high relative to the distribution of scores.
Tests often use elevated scores to flag people for further attention (e.g., clinical assessment, giftedness testing, or high-risk screening
In ranking contexts → shows someone at the upper end relative to peers.
In clinical contexts → often defined as ≥ 2 SDs above the mean (z = +2), but the exact cutoff depends on the test. *elevated” usually means above a certain cutoff relative to norms.
In short: An elevated score is a score significantly higher than average, often flagged when it’s ≥ 2 SDs above the mean in clinical contexts, though the exact cutoff depends on the test.
characteristics of a good norm sample (3)
norm samples are critical to interpretation of most psychosocial test scores
characteristics of a good norm sample:
1)sufficiently large (avoid sampling error) *Large samples minimize sampling error, more unique individuals become part of the larger group in larger samples
2)representative of the target population *the larger the sample, the more likely to be representative
3)contemporary *Good samples have been drawn relatively recently so norms are contemporary/recent
Norms/attribute we are assessing may change over time. Ex: The average IQ has been increasing over the last couple decades. So we need to update norms every once in a while.