Research methods 2 Psych
1/81
There's no tags or description
Looks like no tags are added yet.
Name | Mastery | Learn | Test | Matching | Spaced | Call with Kai |
|---|
No analytics yet
Send a link to your students to track their progress
82 Terms
quantitative data
numerical data that can be measured and analysed statistically allowing objective comparisons
qualitative data
descriptive data expressed in words providing depth and insight into behaviour
primary data
data collected first hand by the researcher for the specific study increasing relevance and control
secondary data
data collected by someone else and used by the researcher providing convenience but less control
nominal data
data in categories without numerical value allowing simple frequency counts
ordinal data
data that can be ranked but intervals between values are not equal limiting statistical precision
interval data
data with equal intervals between values but no true zero allowing more precise analysis
ratio data
data with equal intervals and a true zero allowing the most powerful statistical tests
mean
the arithmetic average of a data set providing a sensitive measure of central tendency
mean strength
uses all data values making it representative
mean limitation
affected by extreme scores reducing accuracy
median
the middle value in an ordered data set providing a measure unaffected by extremes
median strength
not influenced by outliers increasing accuracy in skewed data
median limitation
less sensitive because it ignores most data values
mode
the most frequently occurring value providing a simple measure of central tendency
mode strength
useful for categorical data
mode limitation
may be unrepresentative if multiple modes exist
range
the difference between the highest and lowest values showing overall spread
range strength
easy to calculate
range limitation
affected by extreme scores reducing accuracy
standard deviation
a measure of how far scores deviate from the mean showing consistency of data
standard deviation strength
uses all data values giving a precise measure of spread
standard deviation limitation
affected by extreme scores
normal distribution
a symmetrical bell shaped distribution where most scores cluster around the mean
skewed distribution
an asymmetrical distribution where scores cluster at one end affecting measures of central tendency
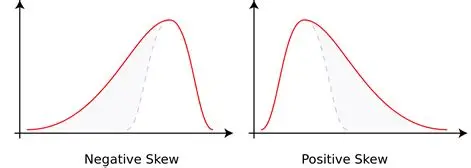
positive skew
most scores are low with a long tail to the right shifting the mean above the median
negative skew
most scores are high with a long tail to the left shifting the mean below the median
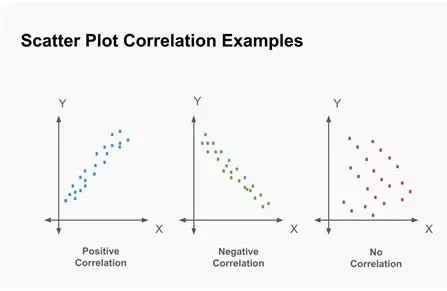
correlation
a statistical relationship between two variables showing how they change together
positive correlation
as one variable increases the other also increases
negative correlation
as one variable increases the other decreases
zero correlation
no relationship between the variables
correlation strength
useful for identifying relationships for further study
correlation limitation
cannot establish cause and effect
scattergram
a graph showing the relationship between two variables used to identify correlations
bar chart
a graph showing discrete data using separate bars making comparisons easy
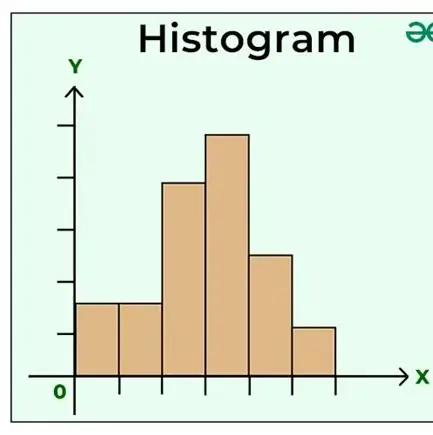
histogram
a graph showing continuous data with touching bars representing frequency distribution
x-axis : range of values or bins of the data,
y-axis : represents the frequency or number of occurrences
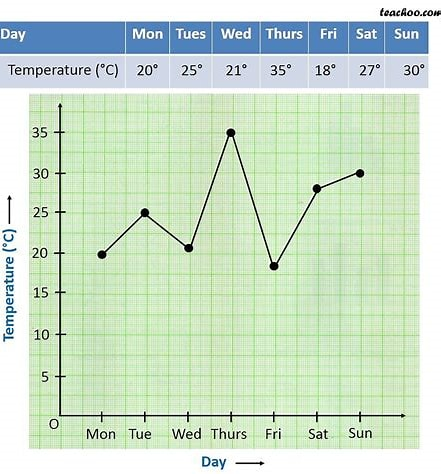
line graph
a graph showing changes over time using connected points
pie chart
a circular chart showing proportions of categories
content analysis coding
categorising qualitative data into meaningful units allowing quantification
thematic analysis
identifying recurring themes in qualitative data providing deeper understanding
raw data
unprocessed data collected directly from participants before analysis
descriptive statistics
numerical summaries of data such as mean and standard deviation
inferential statistics
tests used to determine whether results are due to chance
levels of measurement importance
determines which statistical test is appropriate ensuring valid conclusions
frequency table
a table showing how often each value occurs organising data for analysis
percentage
a proportion expressed out of 100 allowing easy comparison between groups
measure of central tendency
a value representing the centre of a data set such as mean median or mode
measure of dispersion
a value showing the spread of data such as range or standard deviation
inferential statistics
statistical tests used to determine whether results are due to chance allowing researchers to draw conclusions about populations
significance level
the probability threshold for rejecting the null hypothesis usually set at 0.05 to balance accuracy and risk of error
critical value
the value that the test statistic must exceed to reject the null hypothesis ensuring decisions are based on probability
observed value
the calculated test statistic from the data compared against the critical value to determine significance
type one error
rejecting the null hypothesis when it is actually true meaning a false positive conclusion is made
type two error
failing to reject the null hypothesis when it is actually false meaning a false negative conclusion is made
parametric test
a statistical test requiring interval data normal distribution and equal variances providing more power when assumptions are met e.g T test
non parametric test
a statistical test used when data does not meet parametric assumptions allowing analysis of ordinal or non normal data e.g Chi squared
chi square test
significant association between two categorical (nominal) variables.
compares observed frequencies and expected frequencies
chi square requirement
expected frequencies must be above five to ensure accuracy of the test
sign test
a test used for repeated measures and nominal data to assess differences in direction of change
to see whether the difference between two means is significant.
sign test calculation
count positive and negative signs and compare the smaller value to the critical value
wilcoxon test
a test used for repeated measures and ordinal or interval data to assess differences between related scores
non‑parametric statistical test used when your data is ordinal or not normally distributed.
wilcoxon requirement
data must be at least ordinal to allow ranking
mann whitney test
a test used for independent groups and ordinal or interval data to assess differences between two samples
non‑parametric test used to compare two independent groups
mann whitney requirement
data must be at least ordinal and samples must be independent
spearman rho
a correlation test used for ordinal or interval data to assess the strength and direction of a relationship
spearman rho requirement
data must be at least ordinal and variables must be monotonic (moves in one direction)
pearson correlation
a correlation test used for interval data and normally distributed variables to assess linear relationships
pearson requirement
data must be interval and show a linear relationship
related t test
a parametric test used for repeated measures and interval data to assess differences between related means
related t test requirement
data must be interval and normally distributed
unrelated t test
a parametric test used for independent groups and interval data to assess differences between two means
unrelated t test requirement
data must be interval normally distributed and have equal variances
anova
a parametric test used to compare means across three or more groups to identify overall differences
anova requirement
data must be interval normally distributed and have equal variances
degrees of freedom
a value based on sample size used to determine the critical value for statistical tests
one tailed test
a test predicting a specific direction increasing power but increasing risk of type one error
two tailed test
a test predicting a difference in either direction reducing risk of type one error
effect size
a measure of the strength of a relationship or difference providing information beyond significance
power of a test
the probability of correctly rejecting a false null hypothesis increased by larger samples and stronger effects
pilot statistical check
using small scale data to ensure the chosen test is appropriate before full analysis
reporting significance
stating whether the observed value exceeded the critical value and whether the null hypothesis was rejected
interpreting non significant results
concluding that evidence was insufficient to reject the null hypothesis but not proving it true